


S&P 500 – Minor bounce before new downleg
click to enlarge charts
Key Levels (1 to 3 weeks)
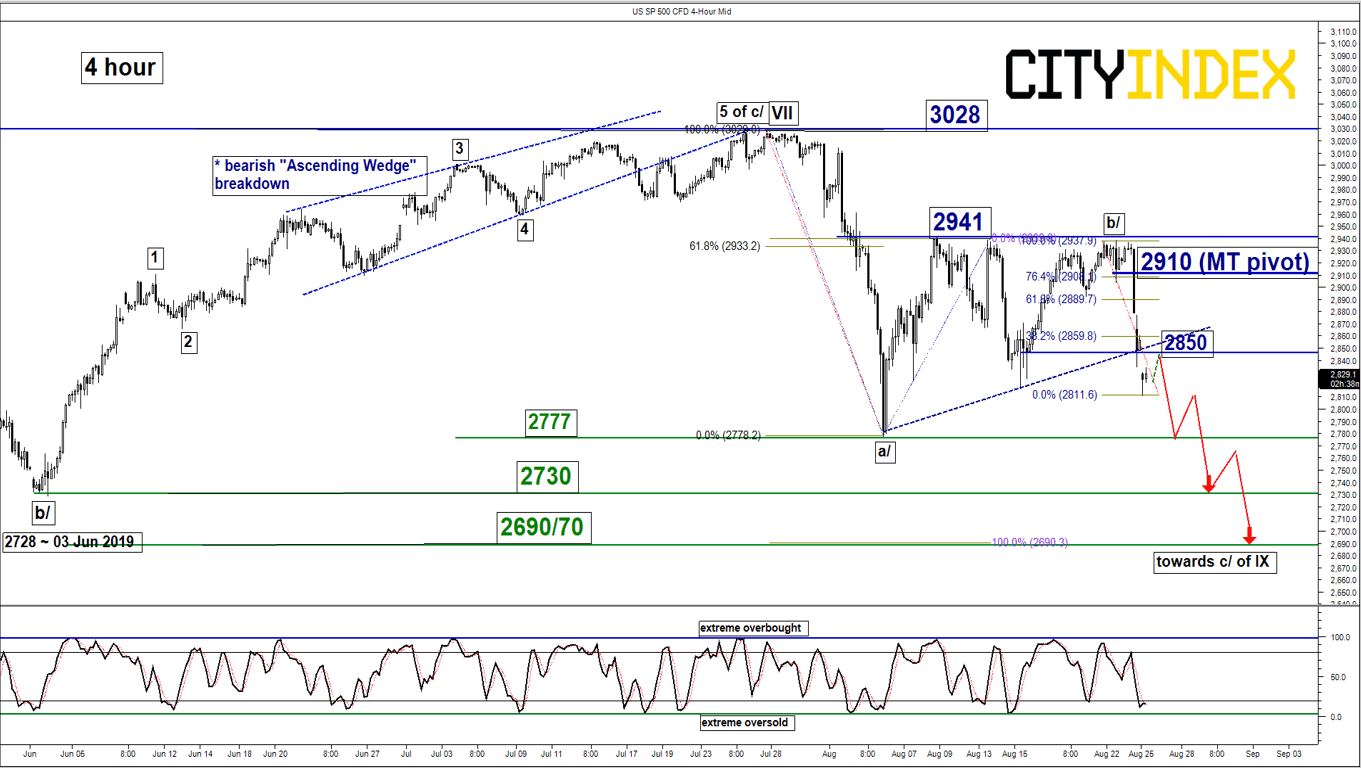
Intermediate resistance: 2850/60
Pivot (key resistance): 2910
Supports: 2777, 2730 & 2690/70
Next resistances: 2941 & 3028
Directional Bias (1 to 3 weeks)
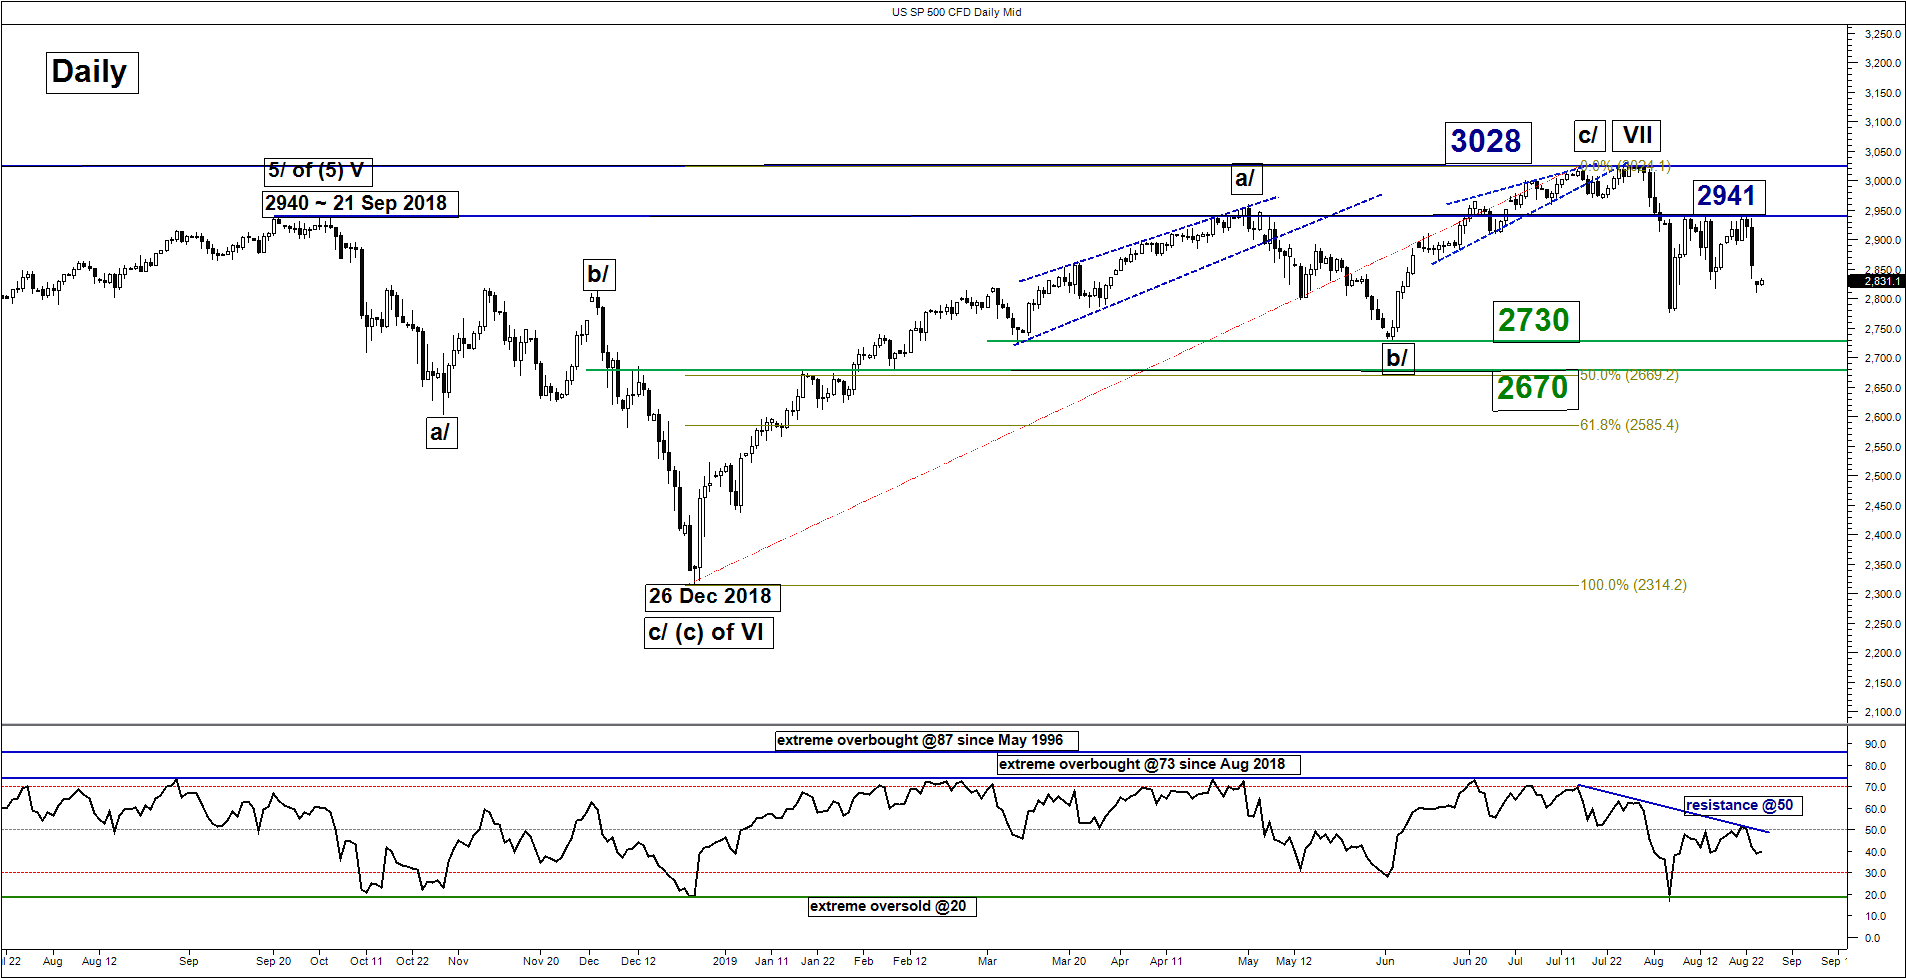
Last week, the SP 500 Index (proxy for the S&P 500 futures) has declined as expected right below the 2941 key medium-term pivotal resistance after a 3rd retest below it (click here for a recap).
It has ended last week, down by -2.28% and recorded a weekly close below the former major swing highs of 26 Jan 2018, 25 Sep 2018 and 01 May 2019. Technical elements remain negative; maintain bearish in any bounces below a tightened key medium-term pivotal resistance at 2910 (76.4% retracement of the recent steep decline from 22 Aug high to 25 Aug low) for a further potential decline to retest 2777 before targeting the next supports at 2730 and 2690/70.
However, a break above 2910 negates the bearish tone for a push up to retest the 2941 range resistance in place since 08 Aug 2019. Only a daily close above 2941 invalidates the bearish tone for a squeeze up towards the current all-time level at 3028.
Key elements
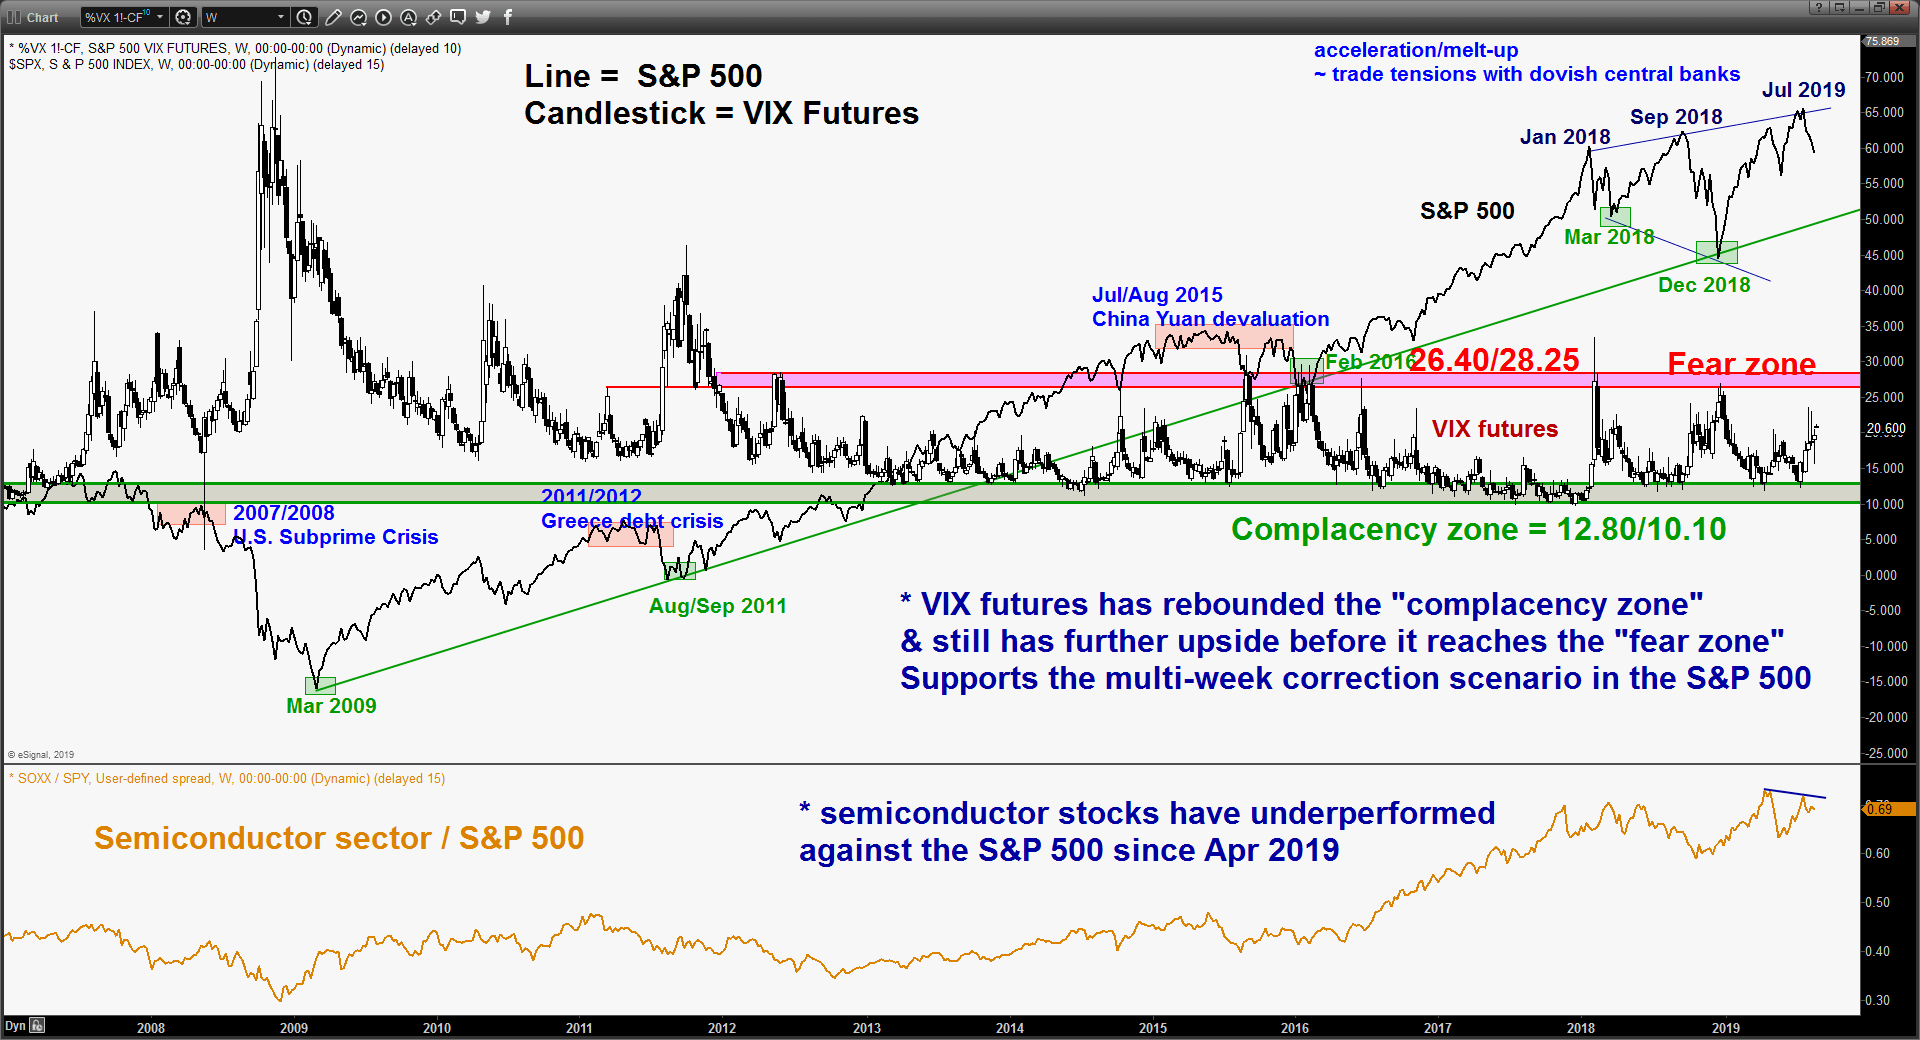
- The movement of the VIX futures (as a contrary opinion indicator) still has further potential upside before it reaches the “fear zone” level of 26.40/28.25 which suggests that the S&P 500 is not due for a significant rebound or recovery at this juncture.
- Relative strength analysis suggests that the leading Semiconductor sector is still underperforming the market (S&P 500).
- Shorter-term oscillators of the S&P 500, the 4-hour Stochastic is coming close to an extreme oversold level which suggests a minor bounce may occur soon towards the 2850/60 intermediate resistance zone (gap, former ascending support from 06 Aug 2019 low & 38.2% retracement of the recent steep decline from 22 Aug high to 25 Aug low).
Hang Seng – Low conviction for a mean reversion rebound, at risk of bearish breakdown
click to enlarge charts
Key Levels (1 to 3 weeks)
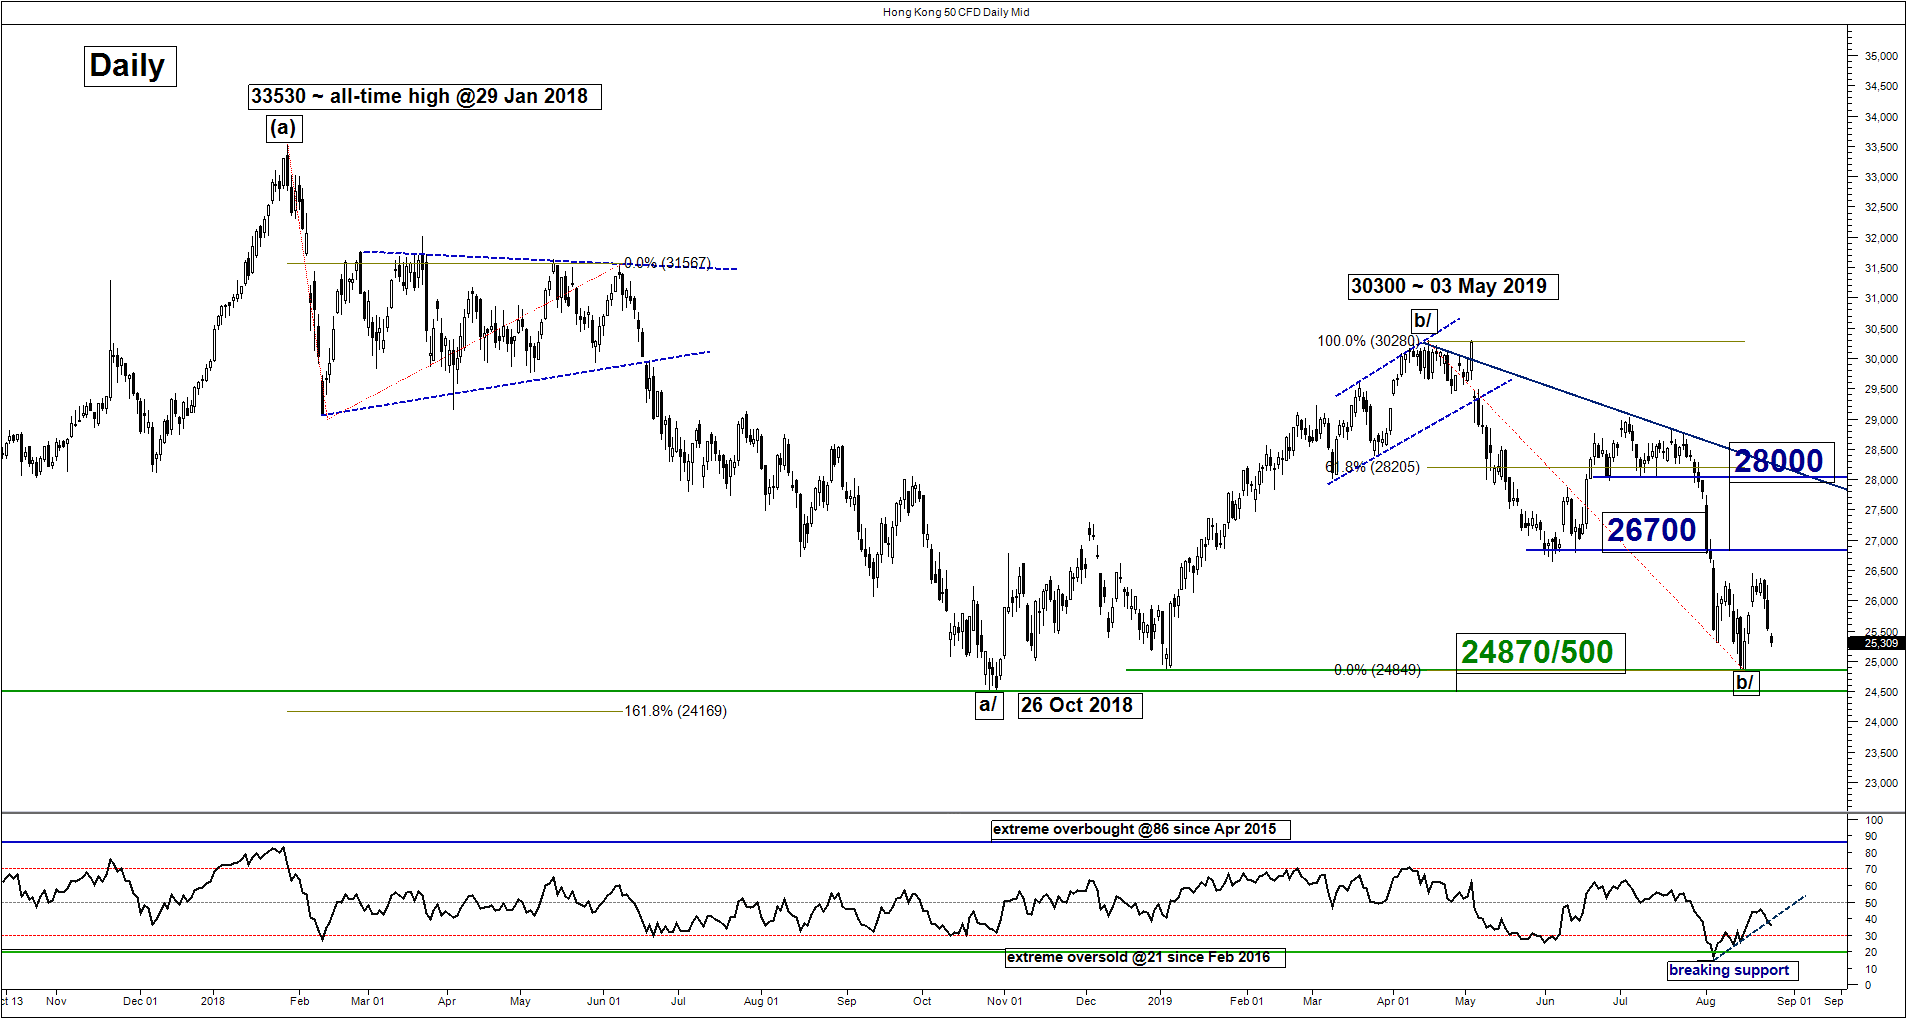
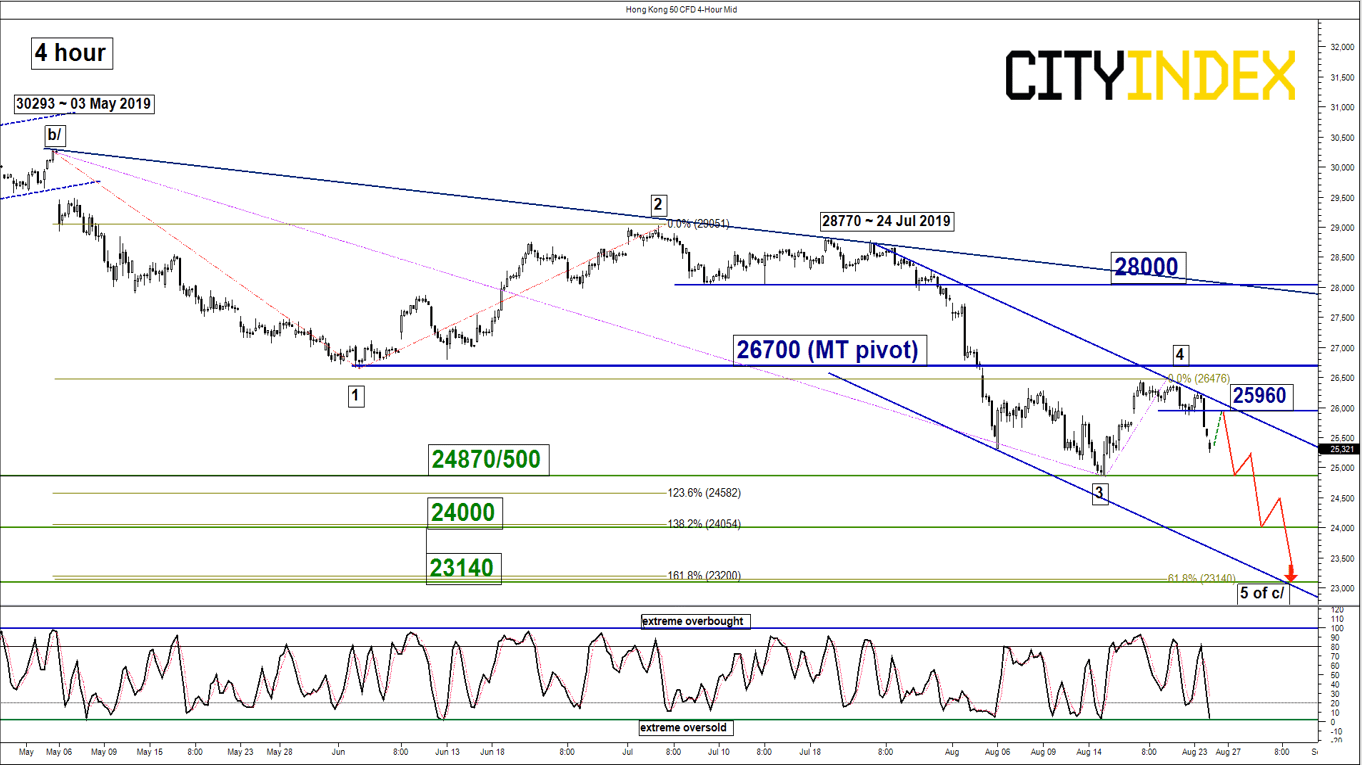
Intermediate resistance: 25960
Pivot (key resistance): 26700
Supports: 24870/500, 24000 & 23140
Next resistance: 28000
Directional Bias (1 to 3 weeks)
Last week, we have highlighted a mean reversion rebound for the Hong Kong 50 Index (proxy for Hang Seng Index futures) but the conviction is now low even though it is still trading above the 24870/500 support. The current bearish configuration on the S&P 500 and the bullish USD/CNH (offshore yuan) has altered our view.
We now flip to a bearish bias in any bounces below the 26700 key medium-term pivotal resistance for a potential bearish breakdown below 24870/500 to target the next supports at 24000 and 23140. However, a clearance with a daily close above 26700 revives the mean reversion rebound scenario towards the 28000 resistance (also the descending trendline from 03 May 2019 high).
Nikkei 225 – Bearish breakdown from range configuration
click to enlarge charts
Key Levels (1 to 3 weeks)
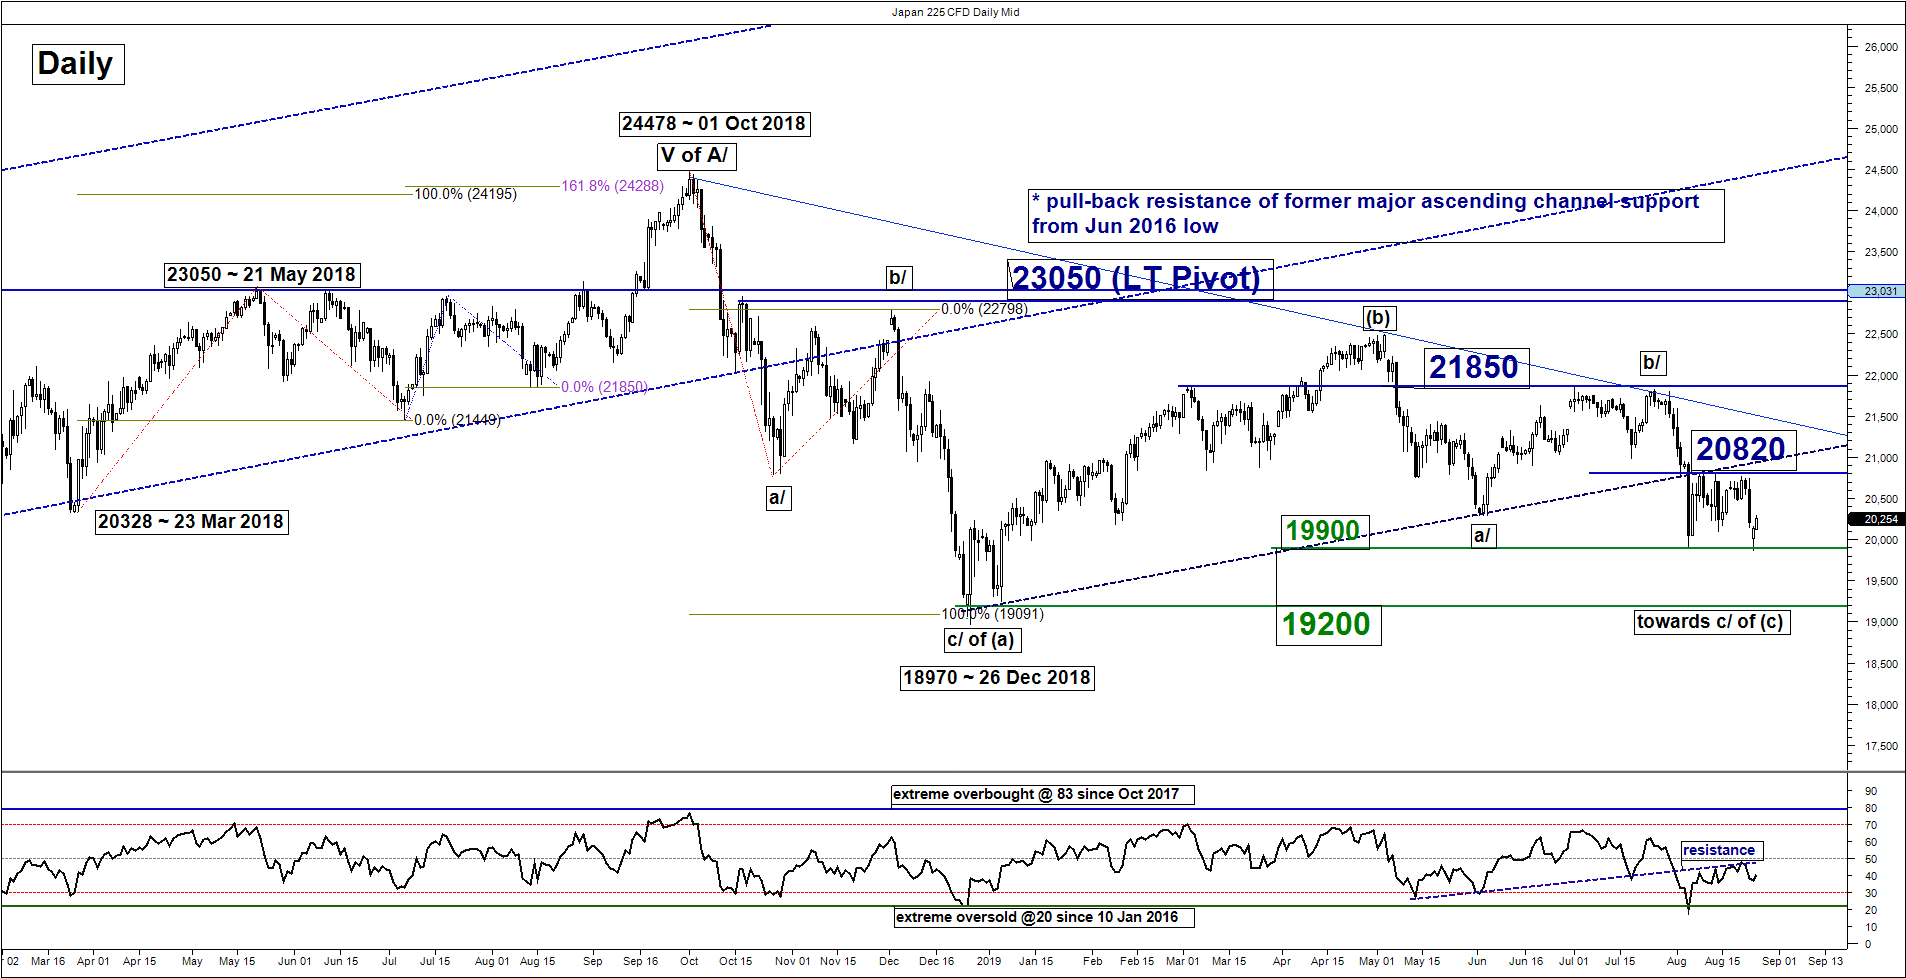
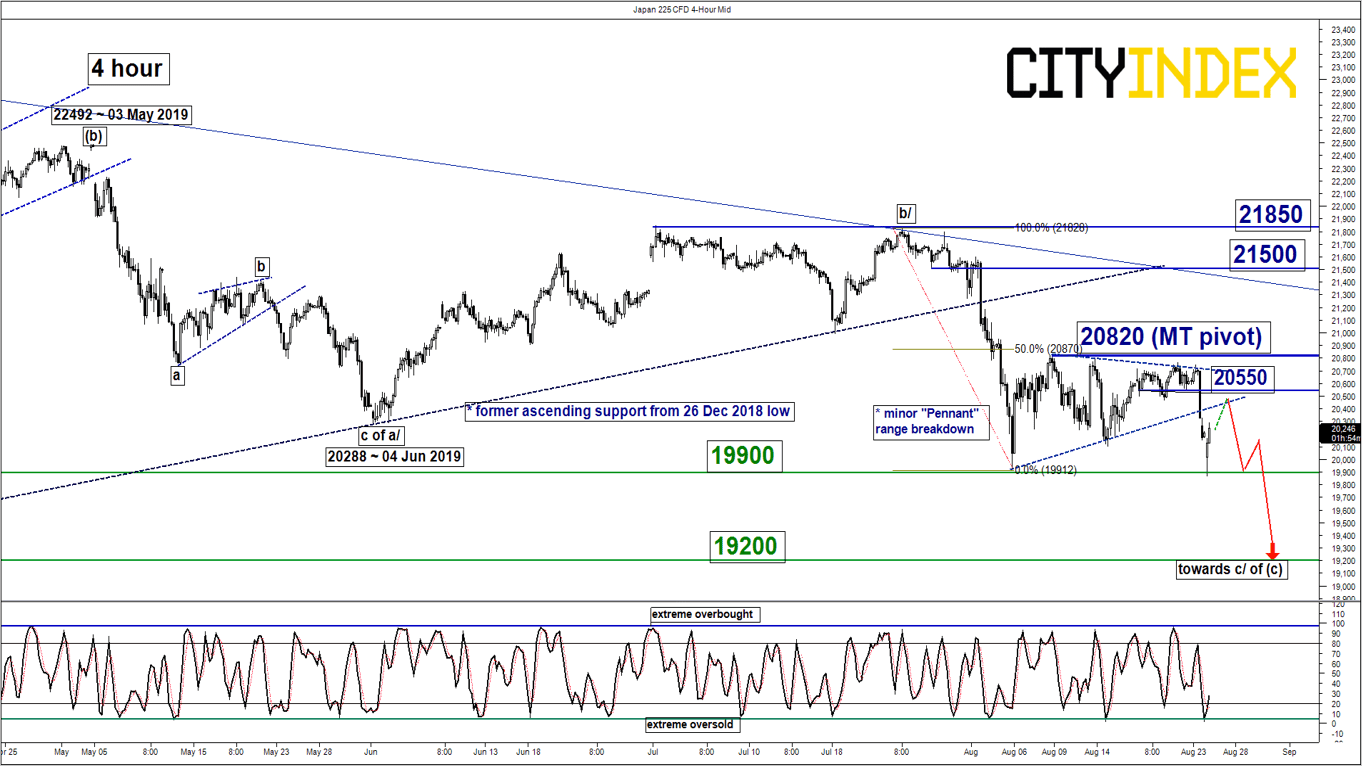
Intermediate resistance: 20550
Pivot (key resistance): 20820
Supports: 19900 & 19200
Next resistances: 21500 & 21850
Directional Bias (1 to 3 weeks)
The Japan 225 Index (proxy for the Nikkei 225 futures) has staged the expected bearish breakdown from its minor “pennant” range configuration as per highlighted in our previous report.
Right now, the 4-hour Stochastic oscillator has exited from its oversold region which highlights the risk of a minor bounce to retest 20550 (pull-back resistance of former “pennant” range support). Maintain bearish bias in any bounces below an adjusted key medium-term pivotal resistance at 20820 for a further potential push down to target next supports at 19900 and 19200.
However, a clearance with a daily close above 20820 invalidates the bearish scenario for an extended corrective rebound towards the next resistance at 21500.
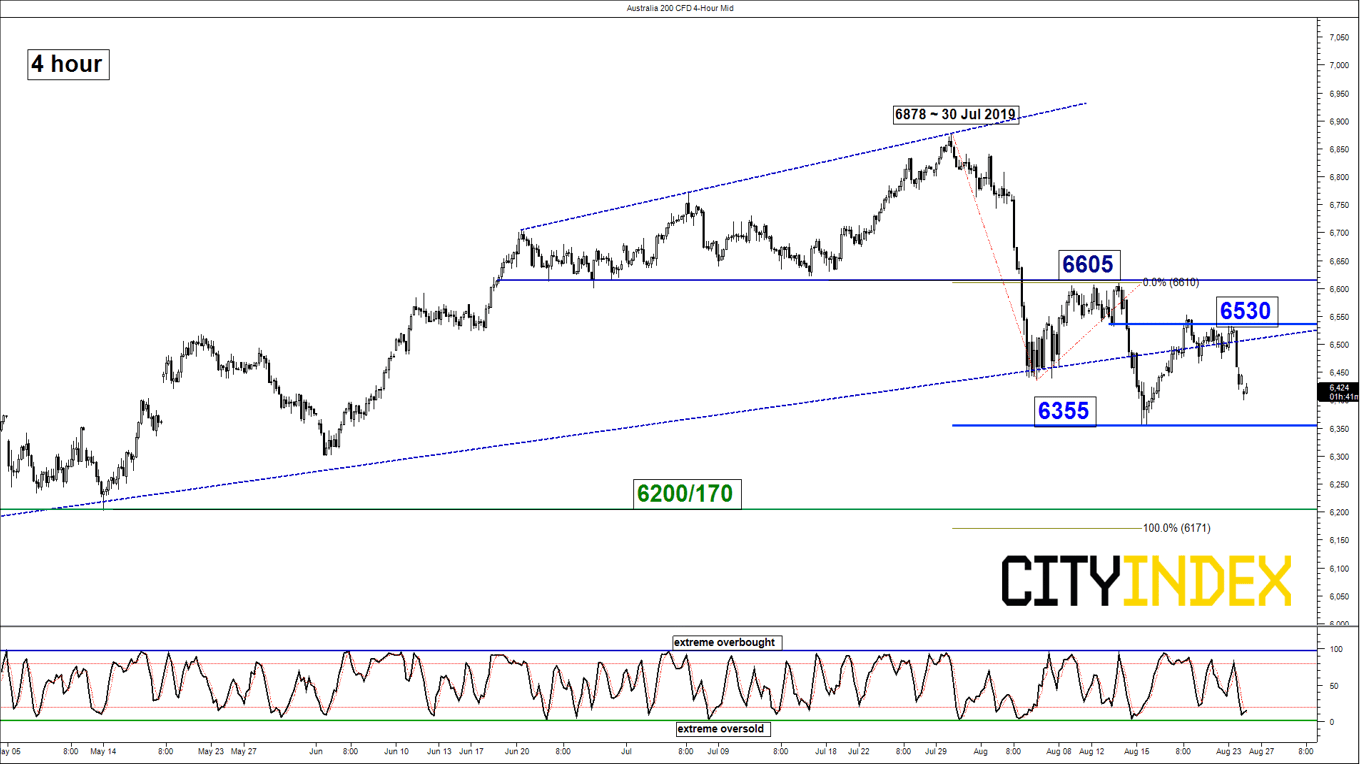
ASX 200 – Sideways, watch range support at 6355
click to enlarge charts
Key Levels (1 to 3 weeks)
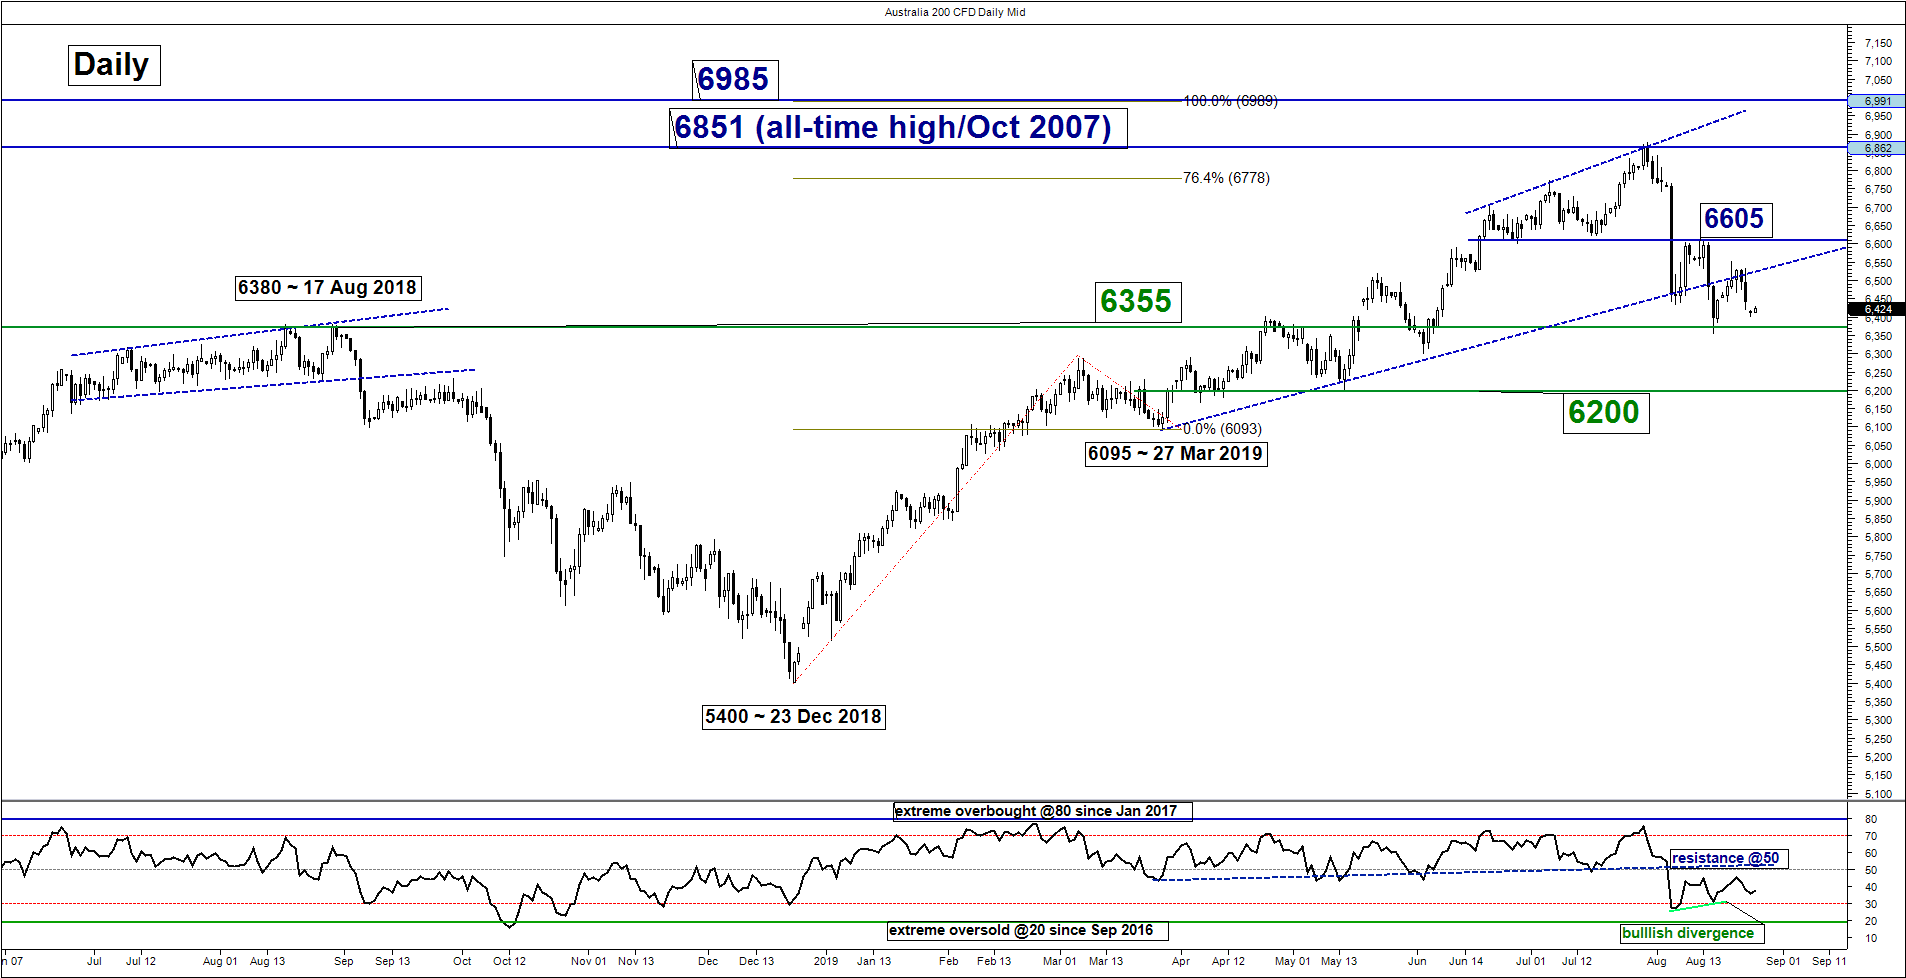
Supports: 6355 & 6200/170
Resistances: 6530 & 6605
Directional Bias (1 to 3 weeks)
Last week, the Australia 200 Index (proxy for the ASX 200 futures) has tested the upper limit of the neutrality range at 6500/6530 before it traded back down inside the range.
Mix elements prevail; maintain neutrality stance between 6530 and 6355. A break below 6355 sees a further decline towards the next support at 6200/170 (also the 1.00 Fibonacci expansion of the recent downleg from 30 Jul 2019 high to 06 Aug 2019 low projected from 14 Aug 2019 high).
On the flipside, a clearance above 6530 opens up scope for an extended corrective rebound towards the next intermediate resistance at 6605.
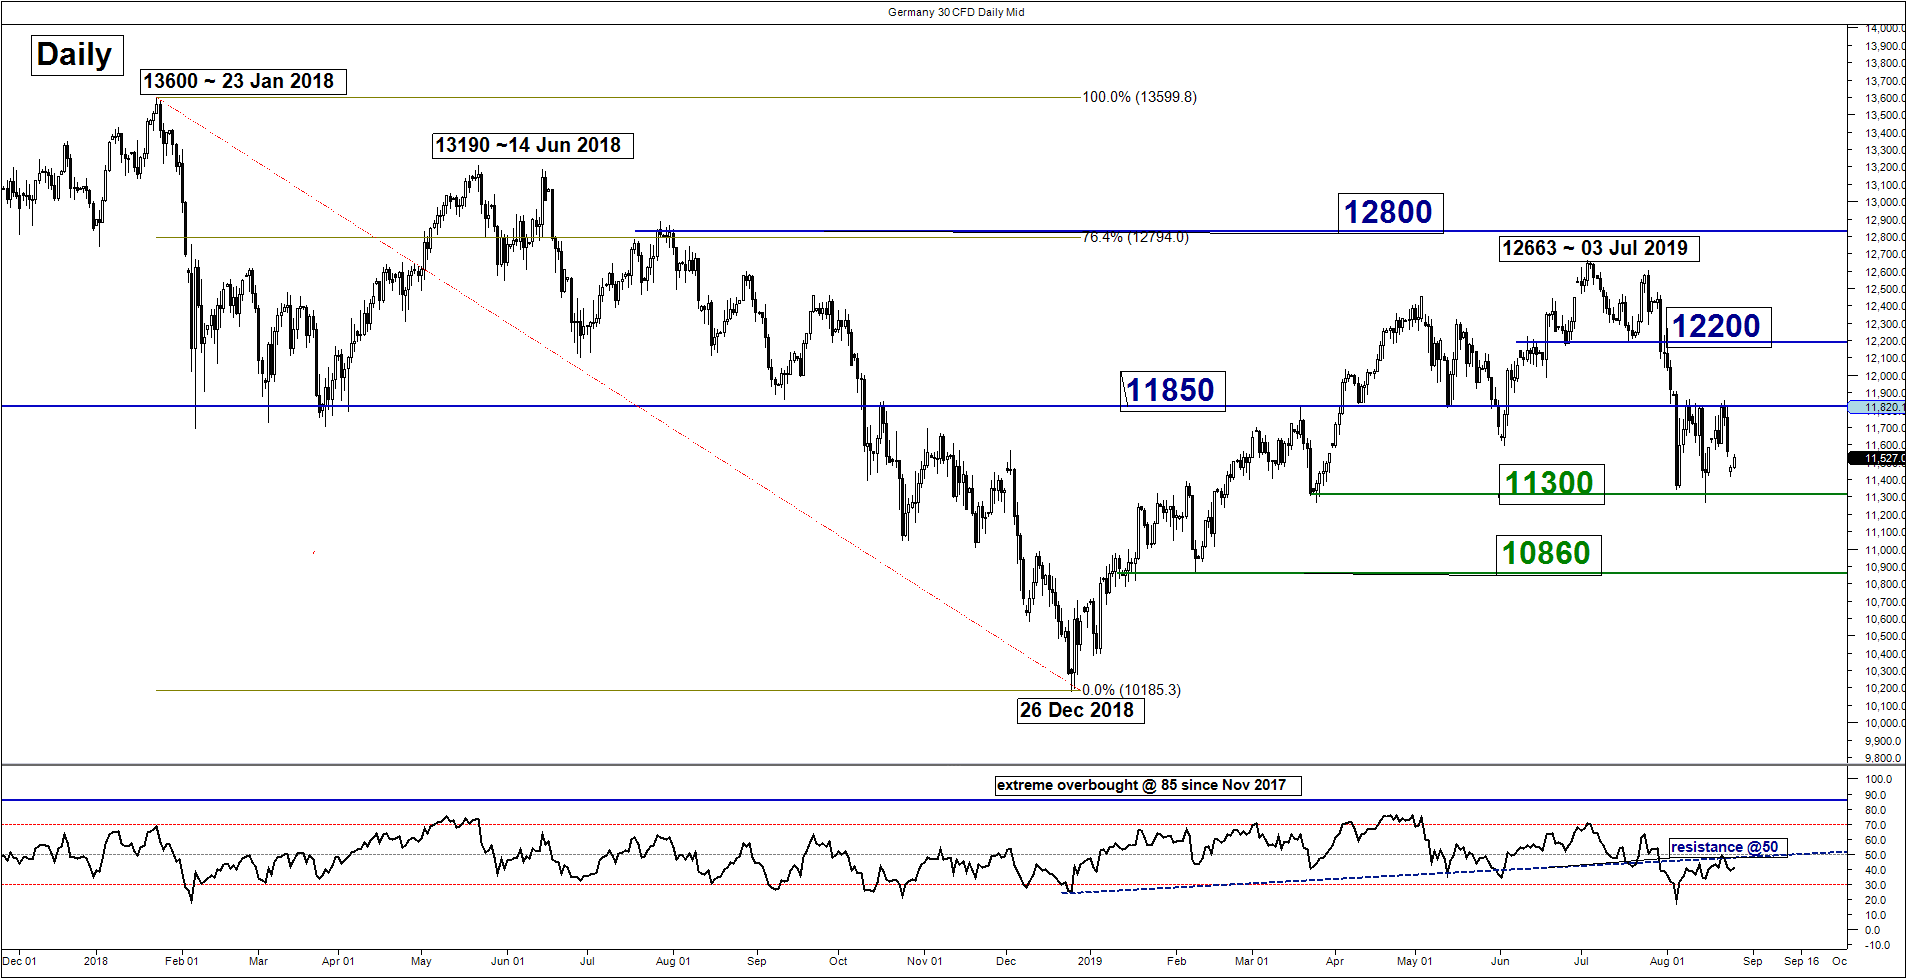
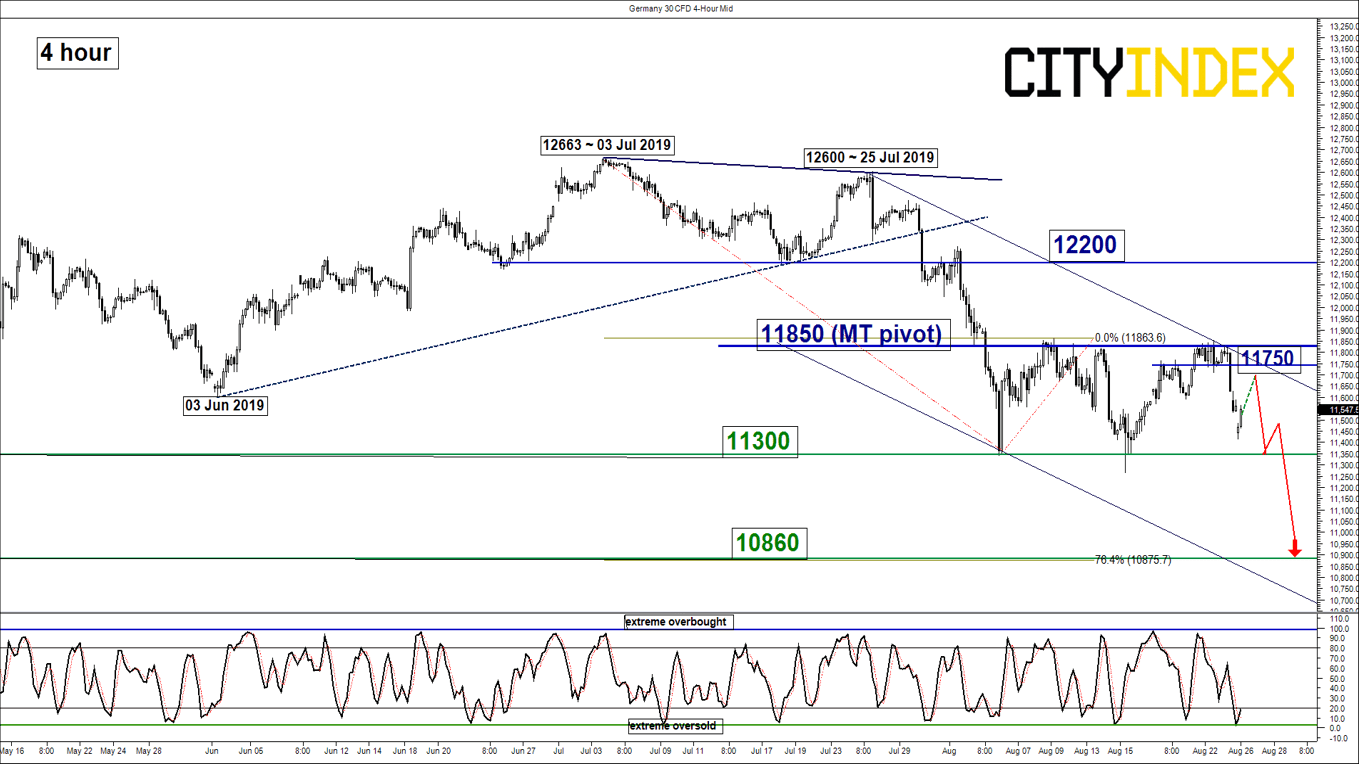
DAX – At risk of bearish breakdown below 11300 range support
click to enlarge charts
Key Levels (1 to 3 weeks)
Intermediate resistance: 11750
Pivot (key resistance): 11850
Supports: 11300 & 10860
Next resistance: 12200
Directional Bias (1 to 3 weeks)
Last week, the Germany 30 Index (proxy for the DAX futures) has staged a 3rd test on a key range resistance at 11800 area before it tumbled by 2.5% to print a low of 11534 on last Fri, 23 Aug.
Current technical elements suggest a risk of a bearish breakdown below its 4-week range configuration in place since 05 Aug 2019. Flip to a bearish bias in any bounces below key medium-term resistance at 11850 and a break below 11300 reinforces another downleg to target the next support at 10860 (also the 0.764 Fibonacci expansion of the recent down move from 03 Jul 2019 high to 06 Aug 2019 low projected from 09 Aug 2019 high).
However, a clearance with a daily close above 11850 invalidates the bearish scenario for an extension of the corrective rebound towards the next intermediate resistance at 12200.
Key elements
- Since its 25 Jul 2019 high of 12600, the Index has started to evolve within a medium-term descending channel with the upper boundary action as a resistance at 11850.
- The daily RSI oscillator remains bearish below a significant corresponding resistance at the 50 level which suggests no revival of medium-term upside momentum at this juncture.
- The 4-hour Stochastic oscillator has started to inch up from an extreme oversold level which highlights the risk of a minor bounce towards 11750 intermediate resistance.
Charts are from City Index Advantage TraderPro & eSignal
Latest market news
Latest Indices articles

April 17, 2024 11:00 AM
April 16, 2024 08:00 PM
April 16, 2024 04:54 PM