Weekly Technical Outlook on Stock Indices Mix bag with mean reversion rebound intact for Hang Seng
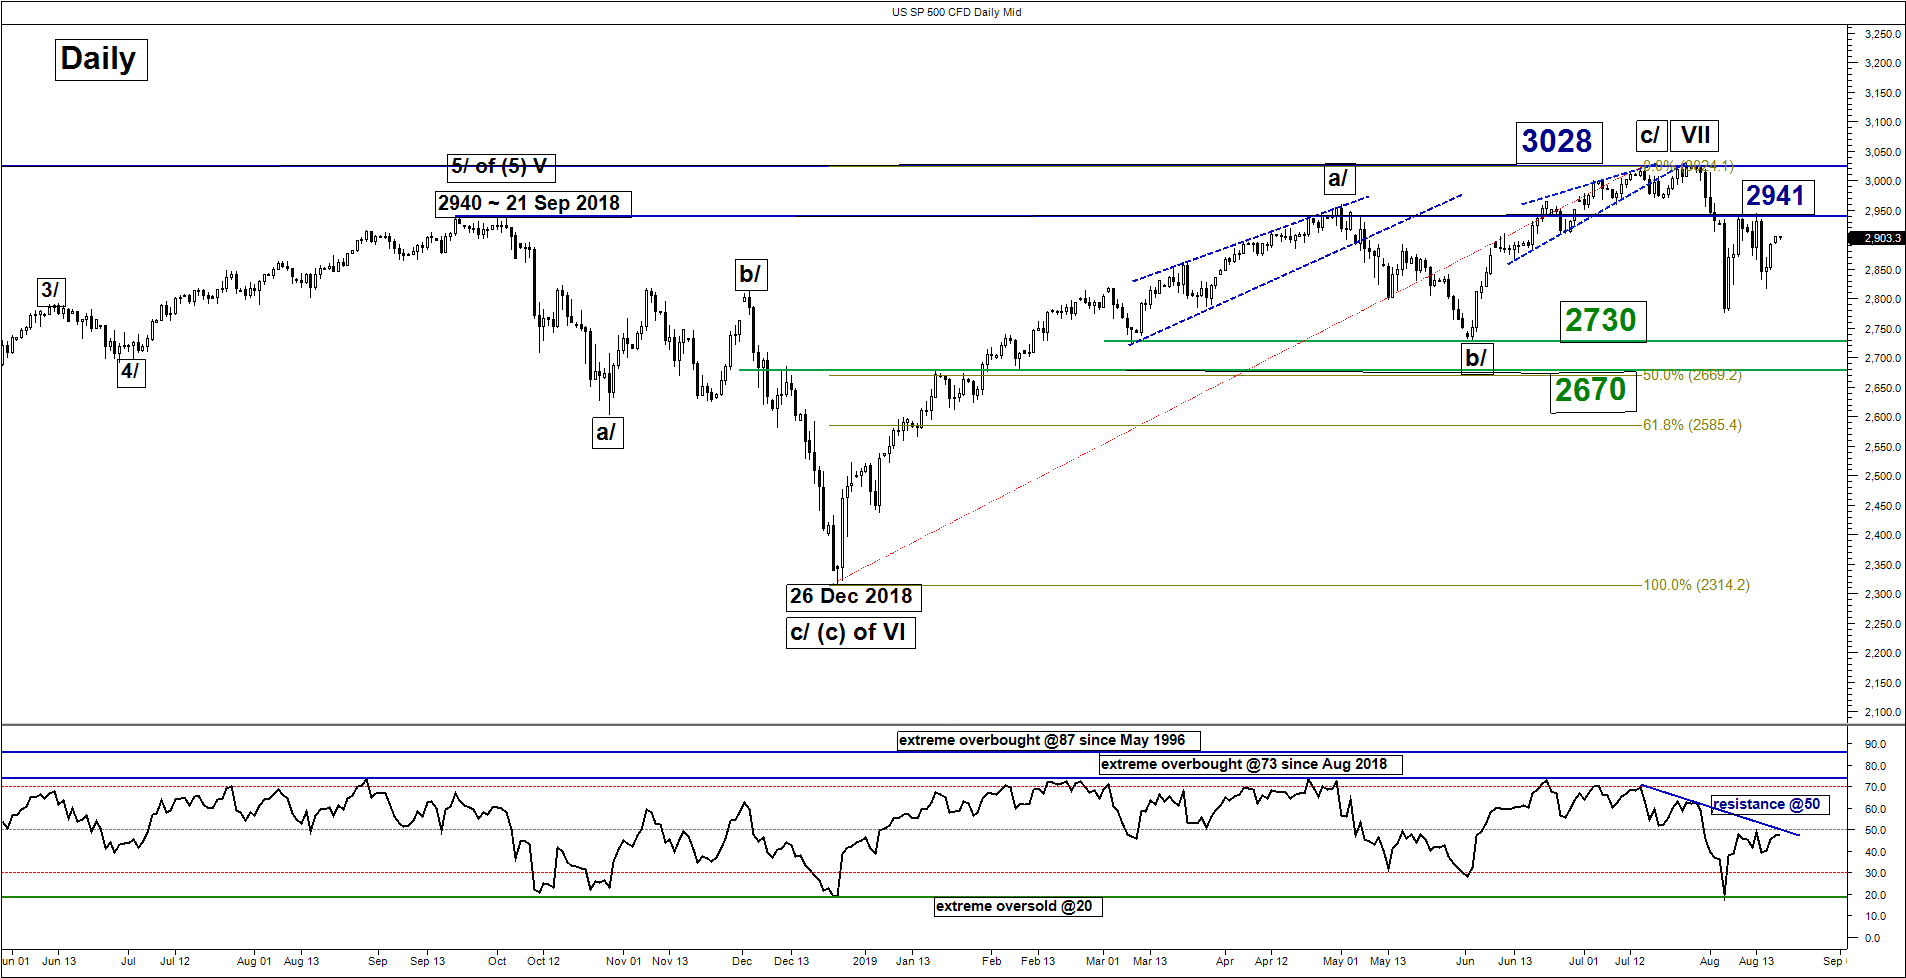
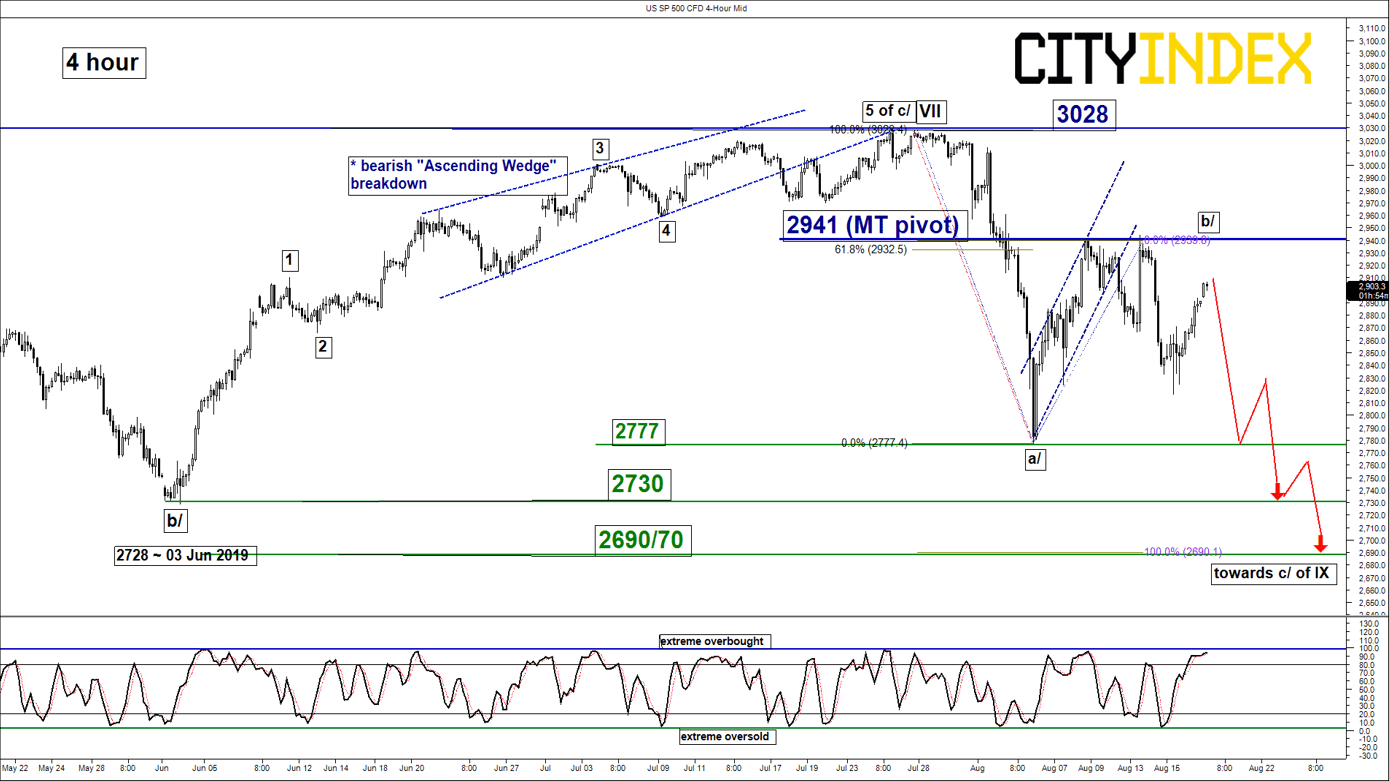
S&P 500 – 2941 remains the key resistance to watch
click to enlarge charts
Key Levels (1 to 3 weeks)
Pivot (key resistance): 2941
Supports: 2777, 2730 & 2690/70
Next resistance: 3028
Directional Bias (1 to 3 weeks)
Since our last update on 13 Aug, the bounce seen on the SP 500 Index (proxy for the S&P 500 futures) after the announcement by the U.S. White House on the partial delay of the 10% tariffs on China’s products has managed to stall at the 2941 key medium-term pivotal resistance (click here for a recap).
No major changes on its key elements; maintain bearish bias below 2941 key pivotal resistance and a break below 2777 is likely to reinforce the start of another potential downleg to target the next supports at 2730 and 2690/70. On the other hand, a clearance with a daily close above 2941 invalidates the bearish scenario for a choppy squeeze up to retest the current all-time level at 3028.
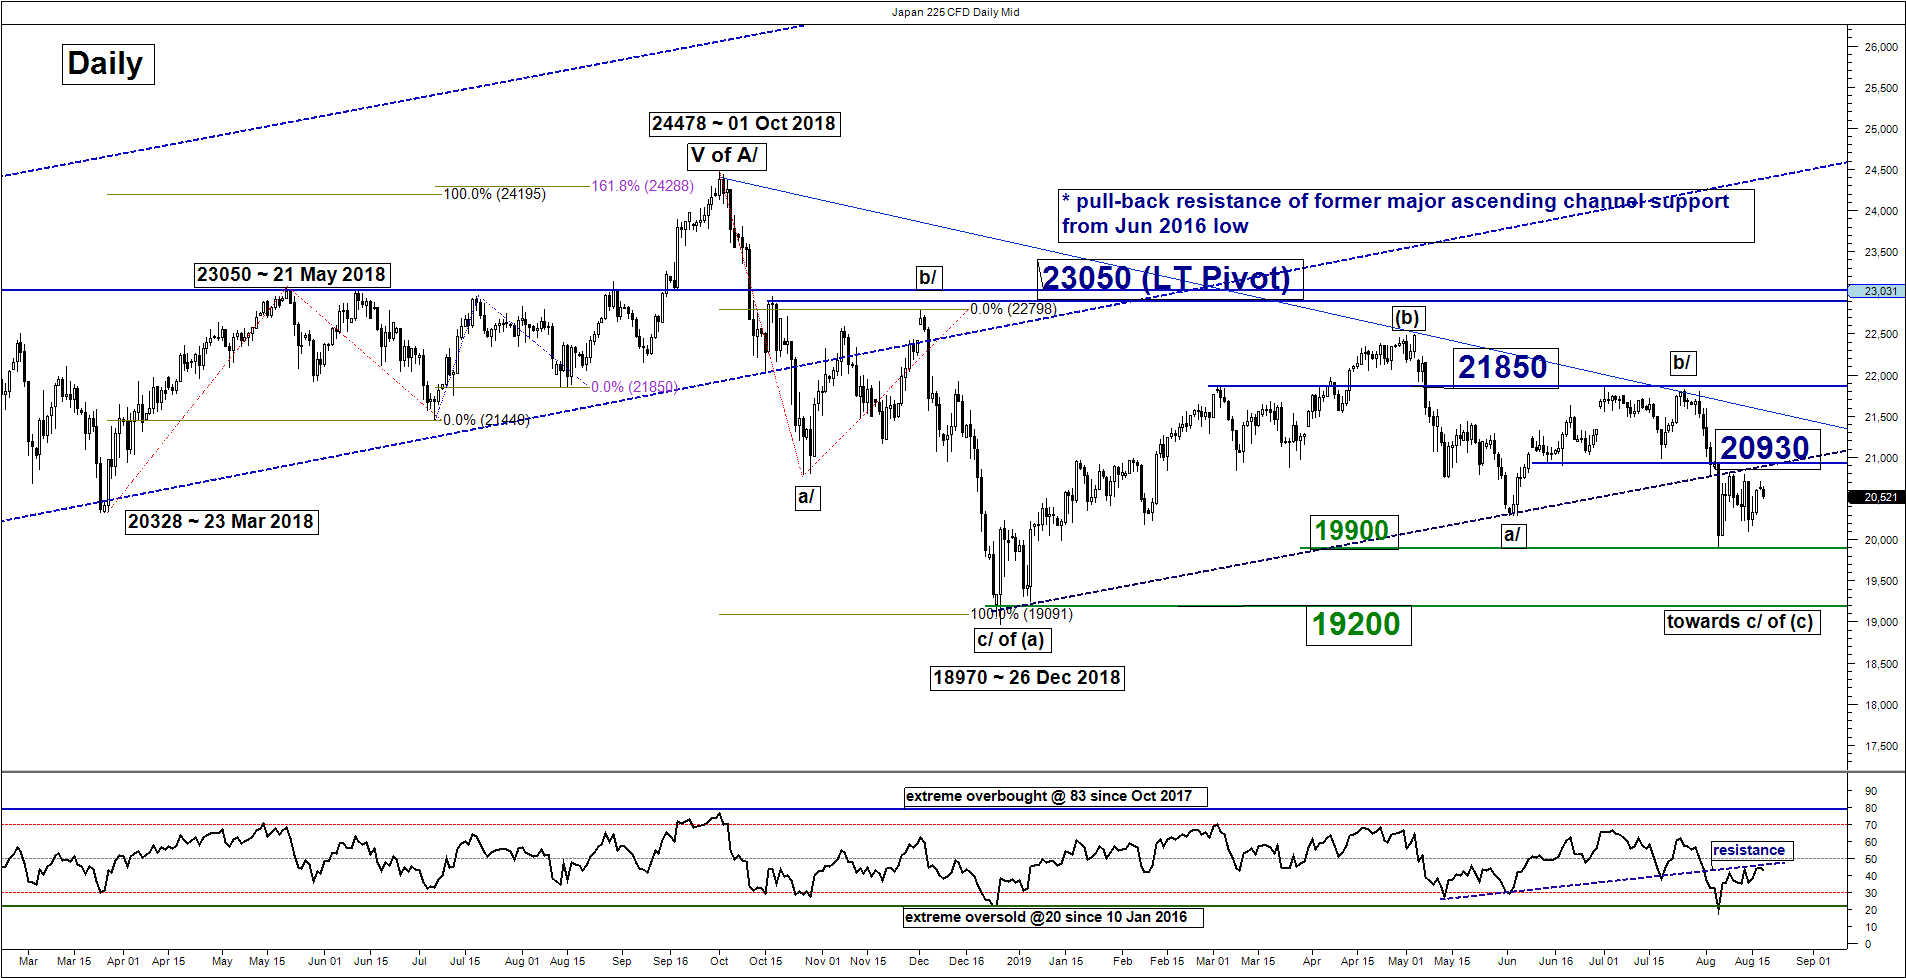
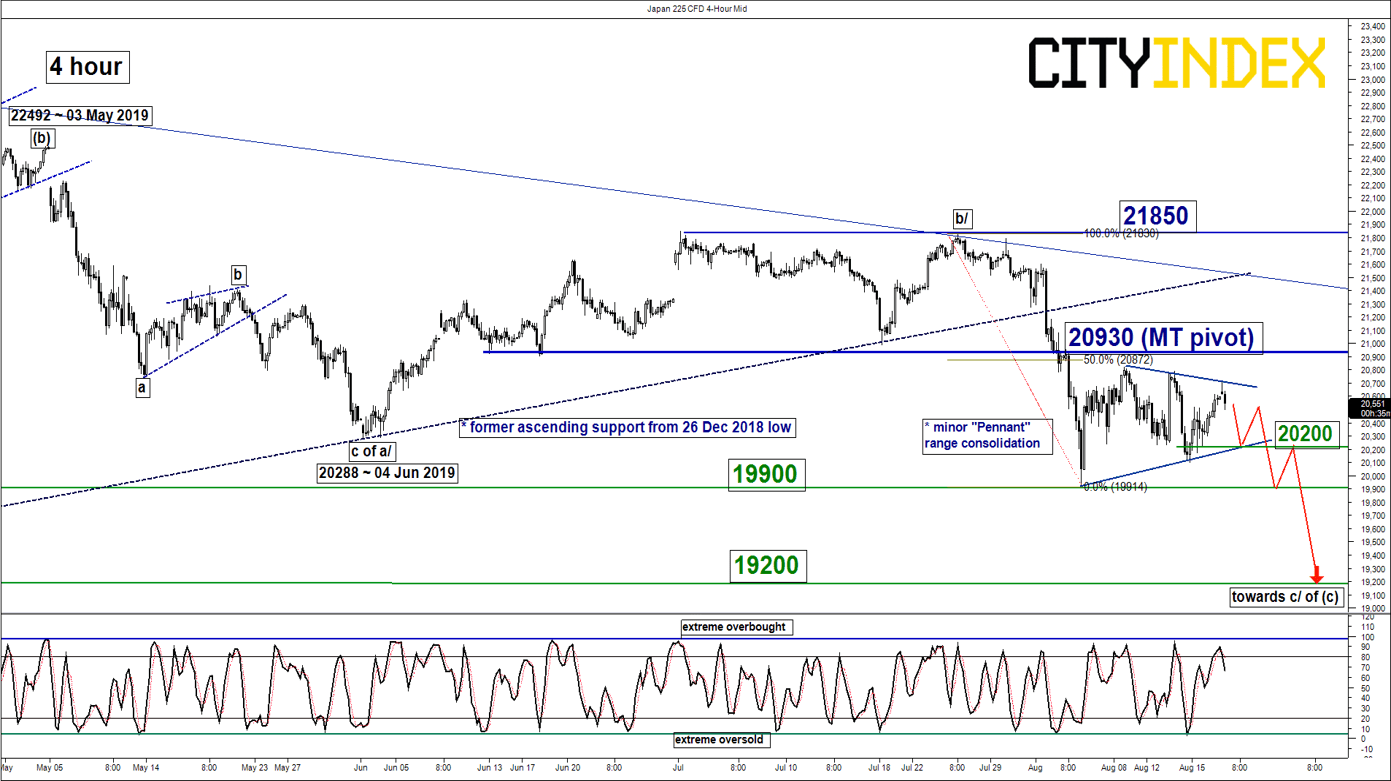
Nikkei 225 – Consolidation before new potential downleg
click to enlarge charts
Key Levels (1 to 3 weeks)
Pivot (key resistance): 20930
Supports: 20200, 19900, 19200
Next resistance: 21850
Directional Bias (1 to 3 weeks)
Since its low of 19923 printed on 06 Aug 2019, the Japan 225 Index (proxy for the Nikkei 225 futures) has started to trade sideways and evolved into an impending minor “Pennant” range configuration that tends to form after a prior steep down move (25 Jul high to 06 Aug 2019). After the completion of the “Pennant” range configuration, the price movement of the Index is likely to resume its downward motion.
Bearish bias below 20930 key medium-term pivotal resistance and a break below 20200 is likely to reinforce a potential downleg to target the next supports at 19900 and 19200. On the other hand, a clearance with a daily close above 20930 invalidates the bearish scenario for an extended corrective rebound towards the next resistance at 2185.
Key elements
- The daily RSI oscillator remains below the 50 level and a corresponding former ascending support from 15 May 2019 low. These observations suggest that medium-term upside momentum of price action has not resurface.
- The support of the minor “Pennant” range configuration is at 20200.
Hang Seng – Mean reversion rebound is still in play
click to enlarge charts
Key Levels (1 to 3 weeks)
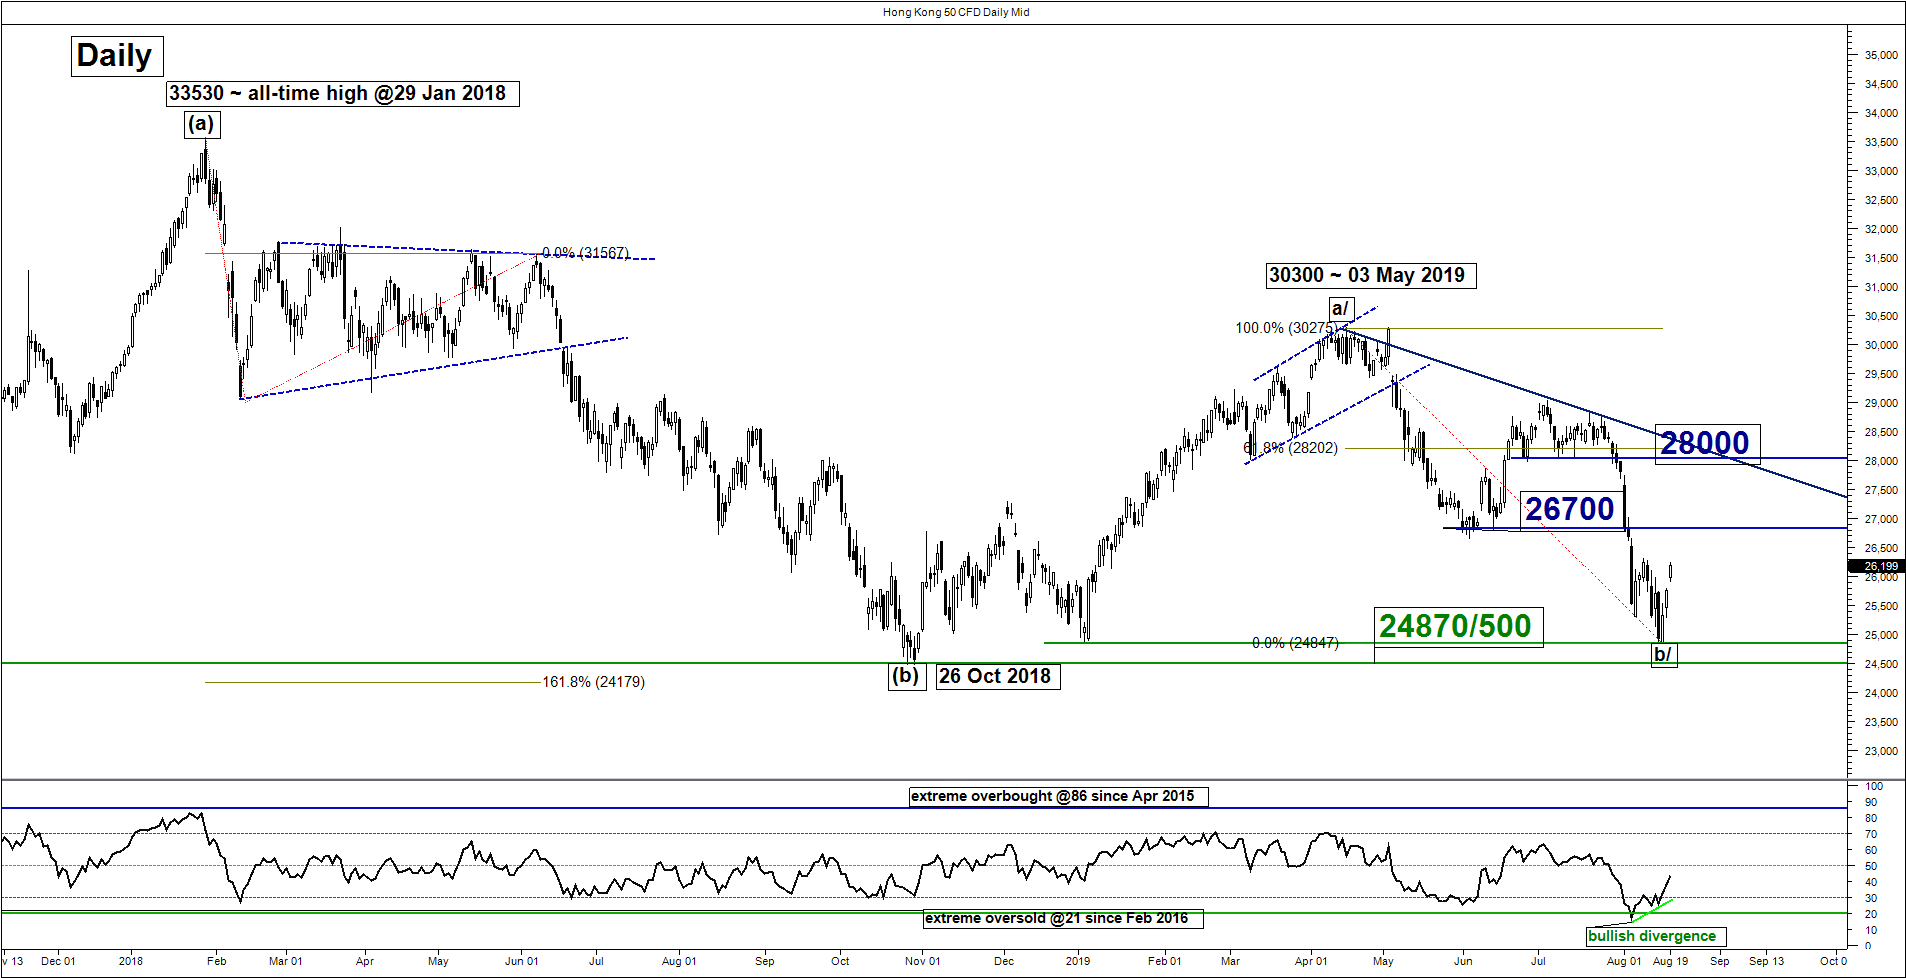
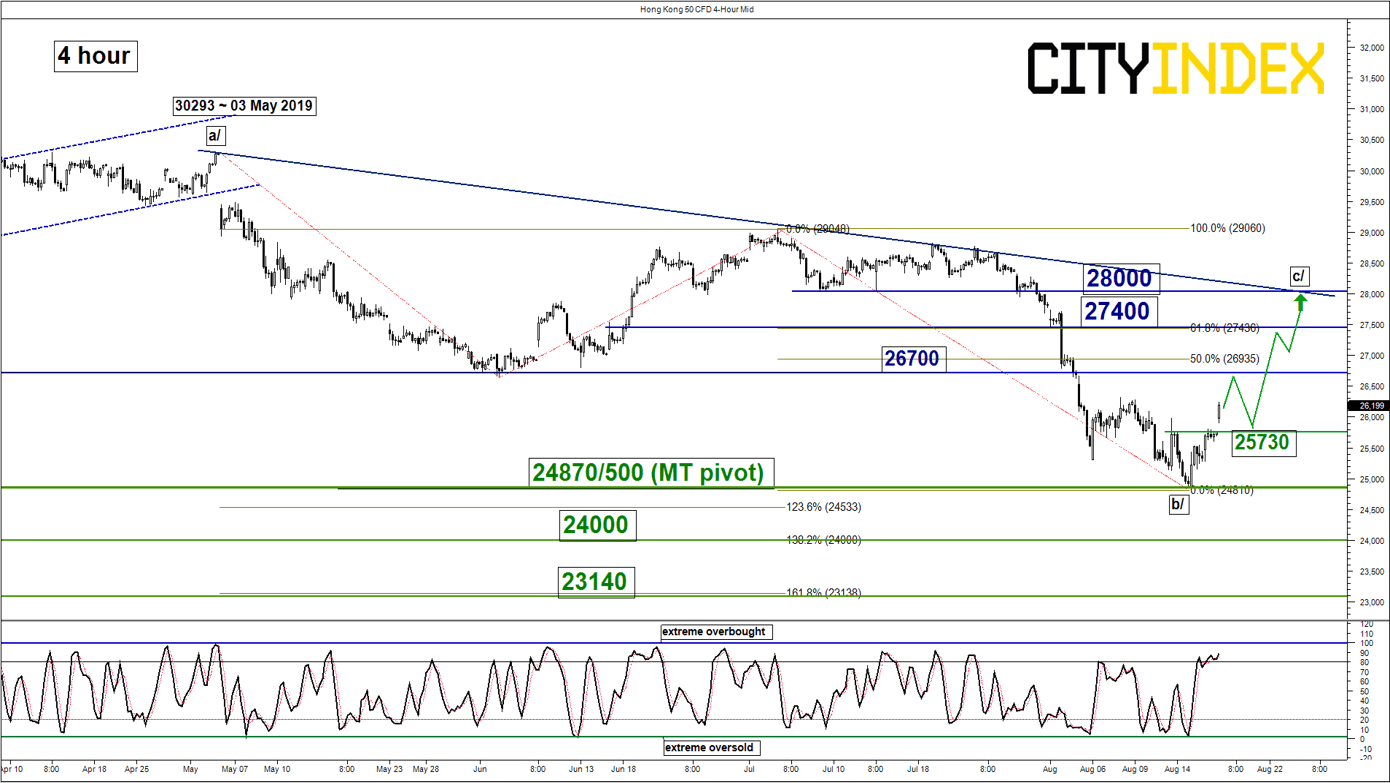
Intermediate support: 25730 (gap)
Pivot (key support): 24870/500
Resistances: 26700, 27400 & 28000
Next supports: 24000 & 23140
Directional Bias (1 to 3 weeks)
Since hitting a low of 24870 on 15 Aug 2019, the Hong Kong 50 Index (proxy for Hang Seng Index futures) has staged a rebound of 5.5 to print a current intraday high of 26239 in today, 19 Aug Asian session coupled with positive elements.
Bullish bias above 24870/500 key medium-term pivotal resistance for a further potential mean reversion rebound sequence within a complex range configuration in place since 26 Oct 2018 low to target the next resistances at 26700 and 27400 with a maximum set at 28000 (descending trendline from 03 May 2019 high & Fibonacci retracement/expansion cluster). On the other hand, a break with a daily close below 24500 invalidates the mean reversion rebound sequence for a continuation of the down move towards the next supports at 24000 and 23140.
Key elements
- The recent 17% decline seen in the Index from 03 May 2019 high of 30293 has stalled and staged a rebound close to the 26 Oct 2019 medium-term swing low of 24500.
- The daily RSI oscillator has reached an extreme oversold level and formed a bullish divergence signal. These observations suggest that the medium-term downside momentum of price action has weakened.
ASX 200 – Sideways
click to enlarge charts
Key Levels (1 to 3 weeks)
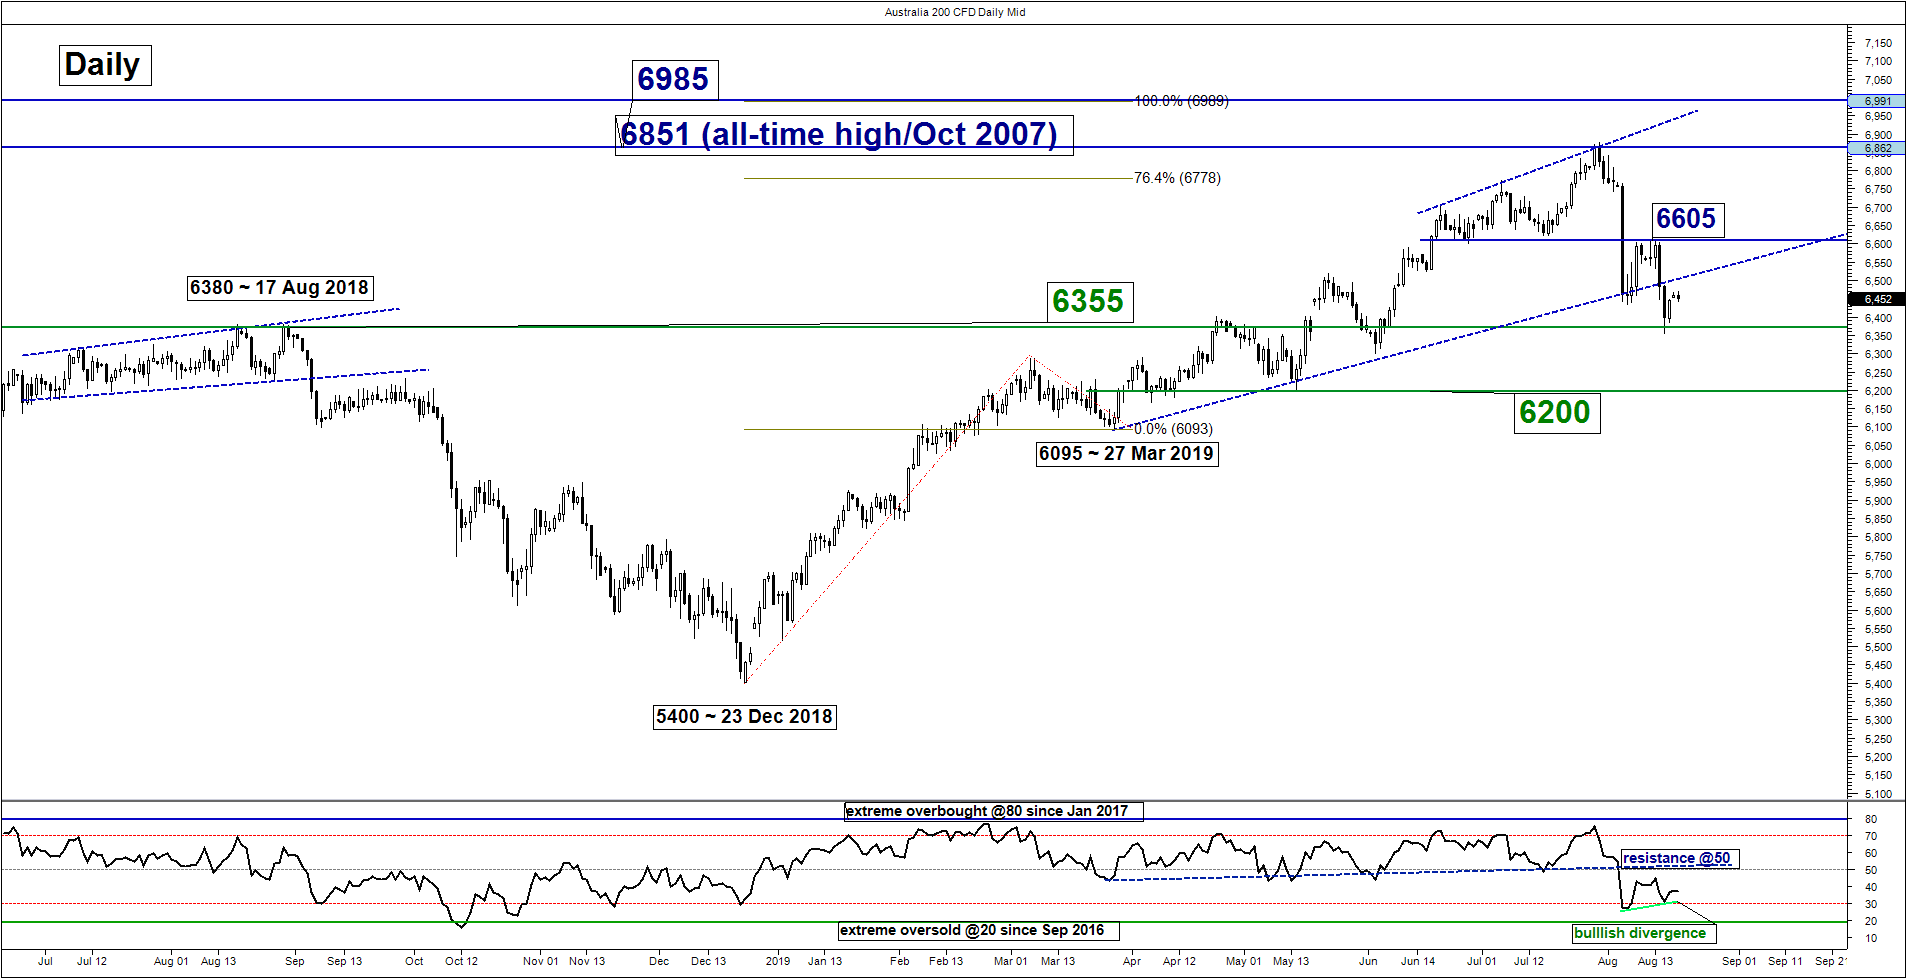
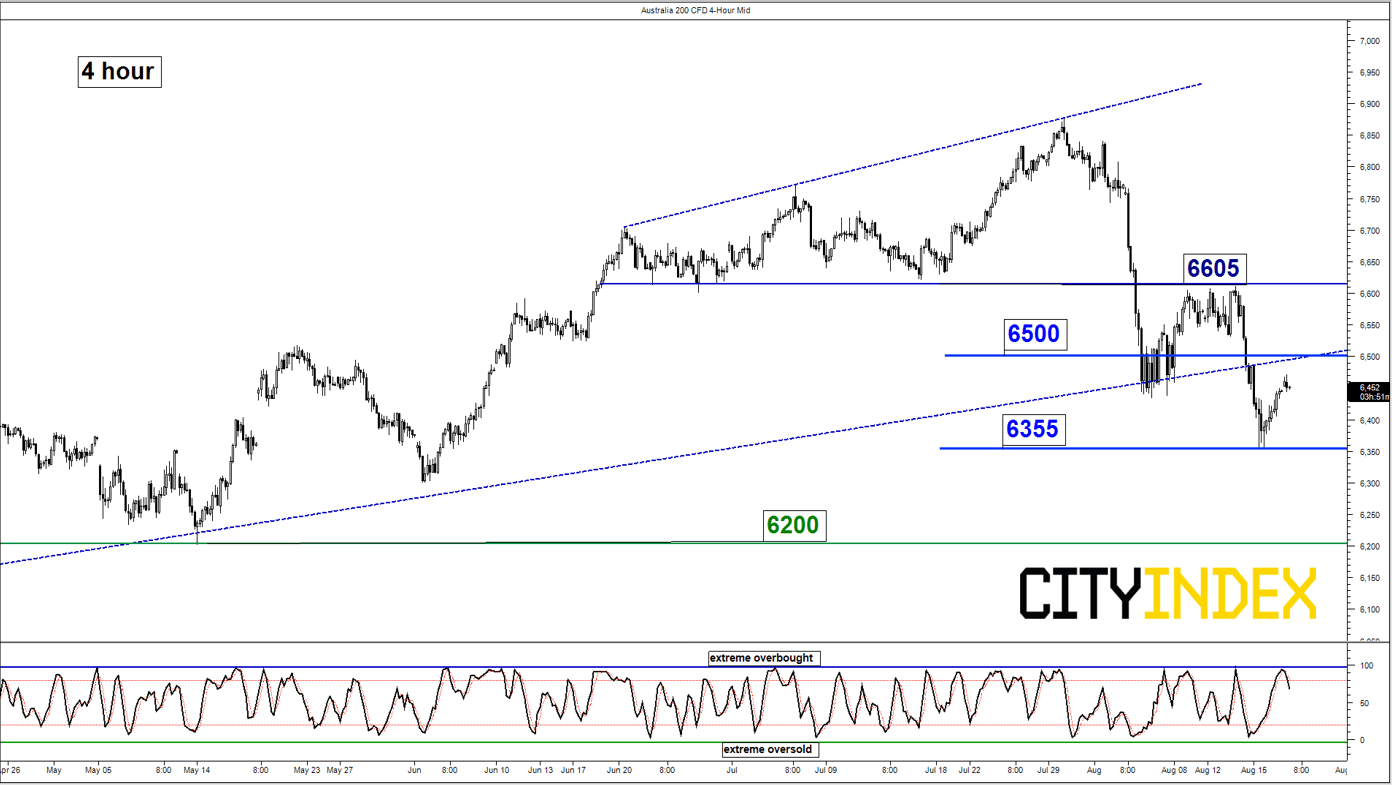
Supports: 6355 & 6200
Resistances: 6500 & 6605
Directional Bias (1 to 3 weeks)
Sideways with mix elements for the Australia 200 Index (proxy for the ASX 200 futures); prefer to turn neutral now between 6355 and 6500. A break above 6500 opens up scope for a corrective rebound towards the next intermediate resistance at 6605.
On the flipside, failure to hold at 6355 sees a further decline towards the next support at 6200 (also the 1.00 Fibonacci expansion of the recent downleg from 30 Jul 2019 high to 06 Aug 2019 low projected from 14 Aug 2019 high).
DAX – Sideways
click to enlarge charts
Key Levels (1 to 3 weeks)
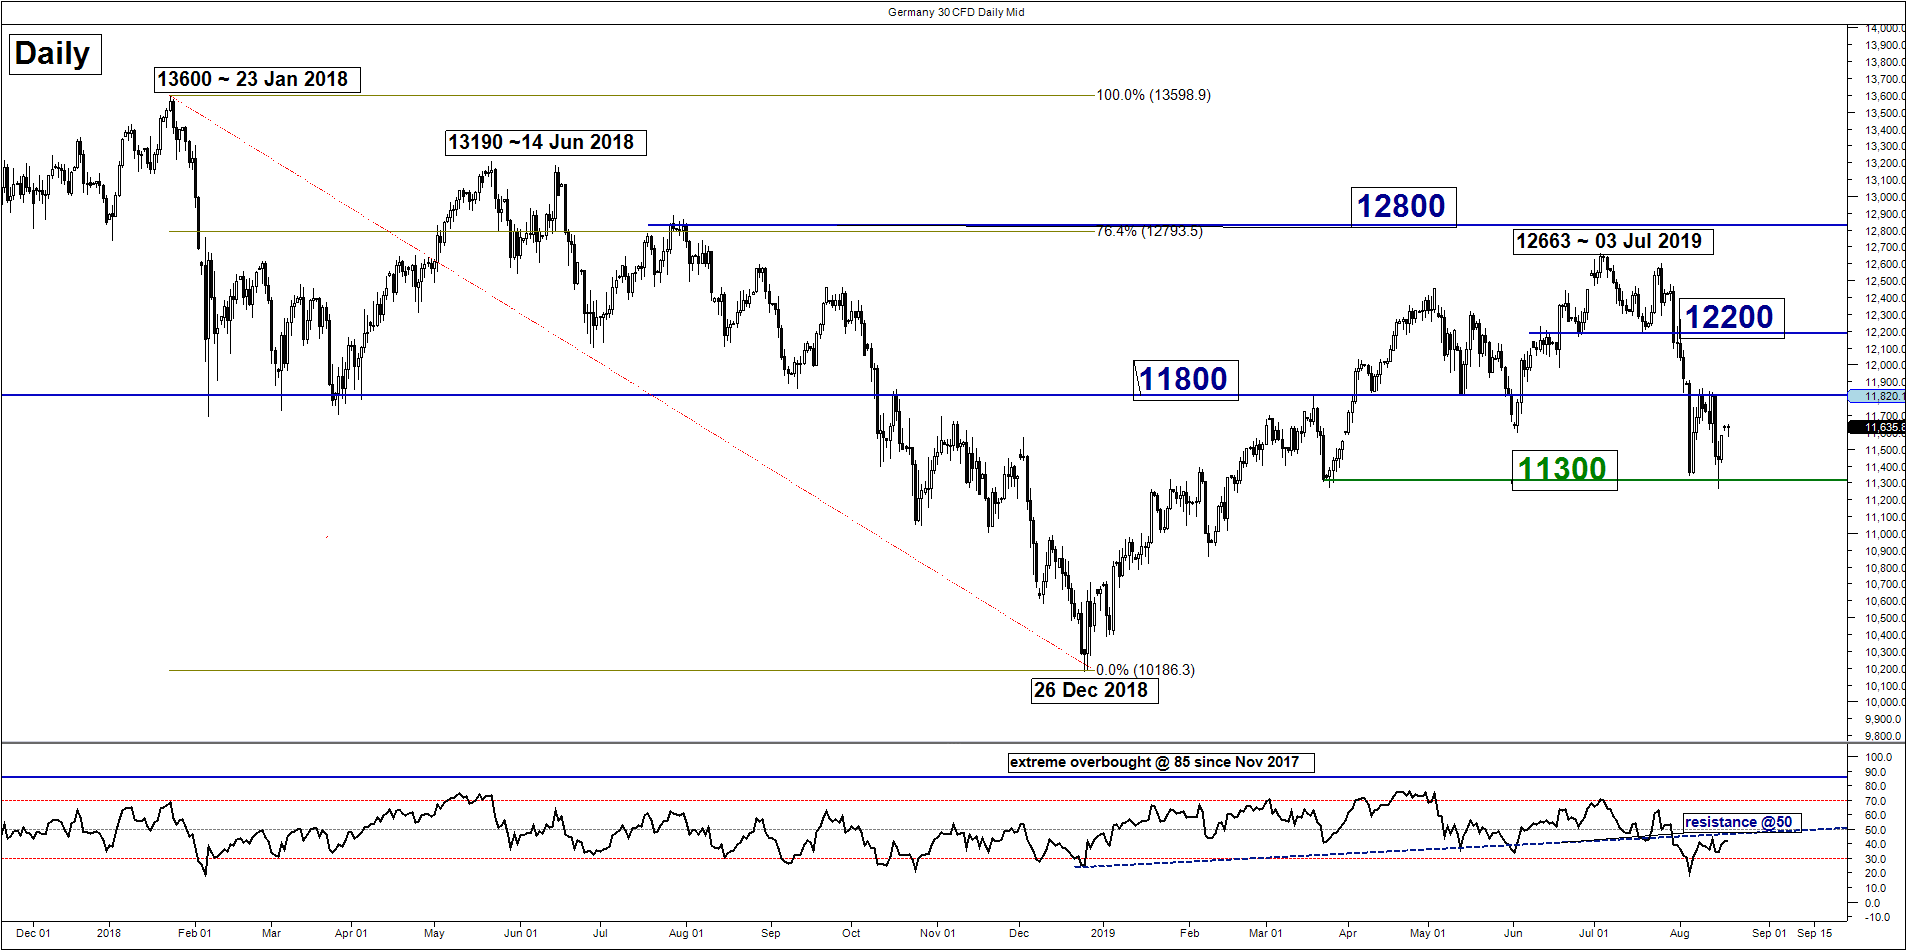
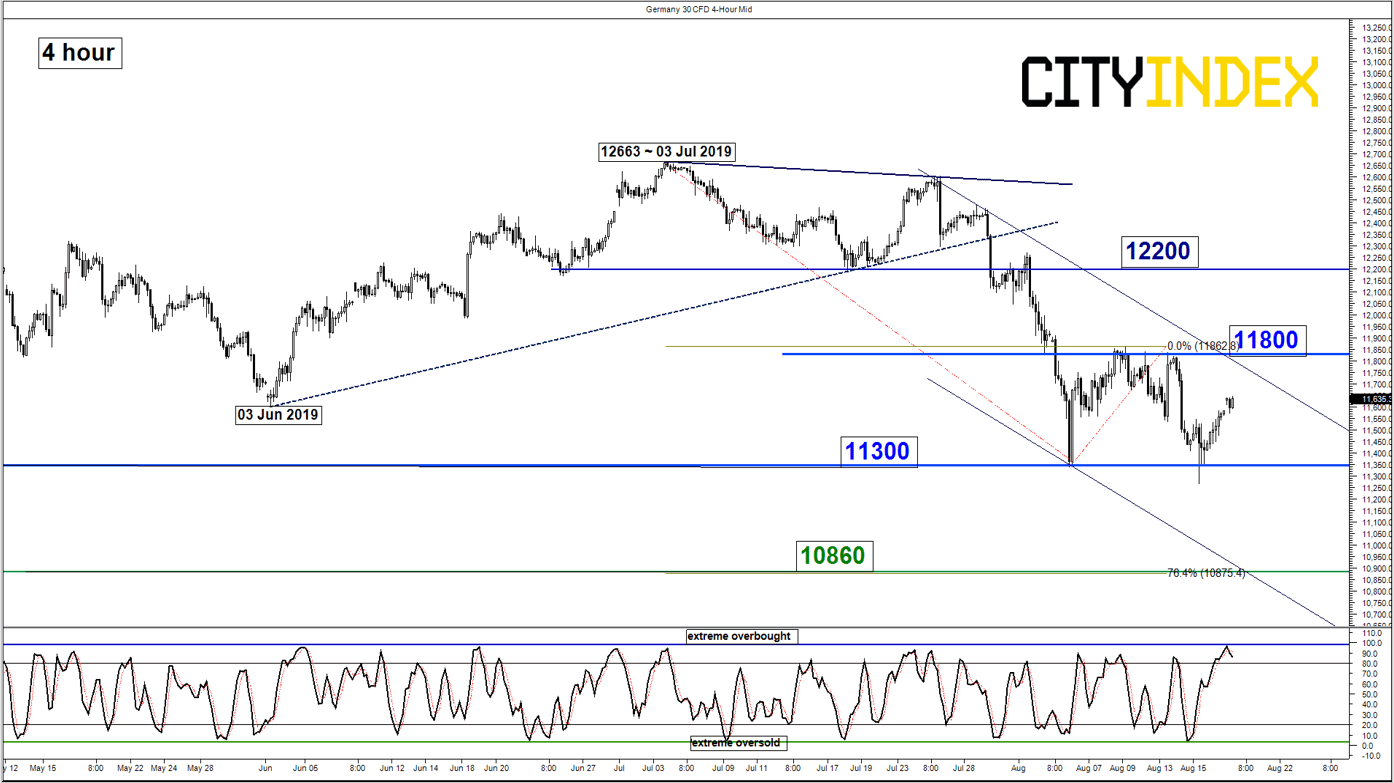
Supports: 11300 & 10860
Resistances: 11800 & 12200
Directional Bias (1 to 3 weeks)
Sideways with mix elements for the Germany 30 Index (proxy for the DAX futures); prefer to turn neutral now between 11800 and 11300. A break above 11800 opens up scope for an extension of the corrective rebound towards the next intermediate resistance at 12200.
On the flipside, failure to hold at 11300 sees a further decline towards the next support at 10860 (also the 0.764 Fibonacci expansion of the recent down move from 03 Jul 2019 high to 06 Aug 2019 low projected from 09 Aug 2019 high).
Charts are from City Index Advantage TraderPro
StoneX Financial Ltd (trading as “City Index”) is an execution-only service provider. This material, whether or not it states any opinions, is for general information purposes only and it does not take into account your personal circumstances or objectives. This material has been prepared using the thoughts and opinions of the author and these may change. However, City Index does not plan to provide further updates to any material once published and it is not under any obligation to keep this material up to date. This material is short term in nature and may only relate to facts and circumstances existing at a specific time or day. Nothing in this material is (or should be considered to be) financial, investment, legal, tax or other advice and no reliance should be placed on it.
No opinion given in this material constitutes a recommendation by City Index or the author that any particular investment, security, transaction or investment strategy is suitable for any specific person. The material has not been prepared in accordance with legal requirements designed to promote the independence of investment research. Although City Index is not specifically prevented from dealing before providing this material, City Index does not seek to take advantage of the material prior to its dissemination. This material is not intended for distribution to, or use by, any person in any country or jurisdiction where such distribution or use would be contrary to local law or regulation.
For further details see our full non-independent research disclaimer and quarterly summary.
CFDs are complex instruments and come with a high risk of losing money rapidly due to leverage. 69% of retail investor accounts lose money when trading CFDs with this provider. You should consider whether you understand how CFDs work and whether you can afford to take the high risk of losing your money. CFD and Forex Trading are leveraged products and your capital is at risk. They may not be suitable for everyone. Please ensure you fully understand the risks involved by reading our full risk warning.
City Index is a trading name of StoneX Financial Ltd. Head and Registered Office: 1st Floor, Moor House, 120 London Wall, London, EC2Y 5ET. StoneX Financial Ltd is a company registered in England and Wales, number: 05616586. Authorised and regulated by the Financial Conduct Authority. FCA Register Number: 446717.
City Index is a trademark of StoneX Financial Ltd.
The information on this website is not targeted at the general public of any particular country. It is not intended for distribution to residents in any country where such distribution or use would contravene any local law or regulatory requirement.
© City Index 2024