


S&P 500 – More potential pain ahead before recovery
click to enlarge charts
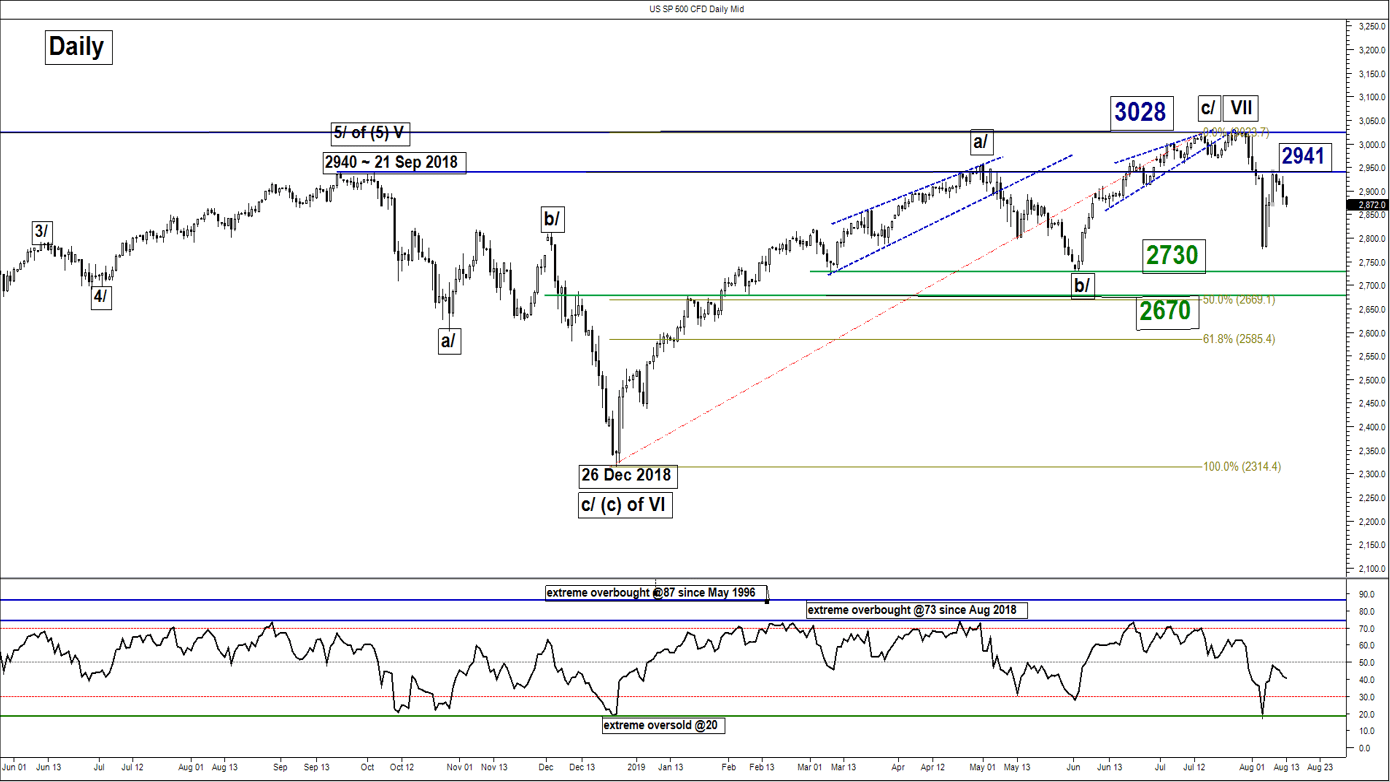
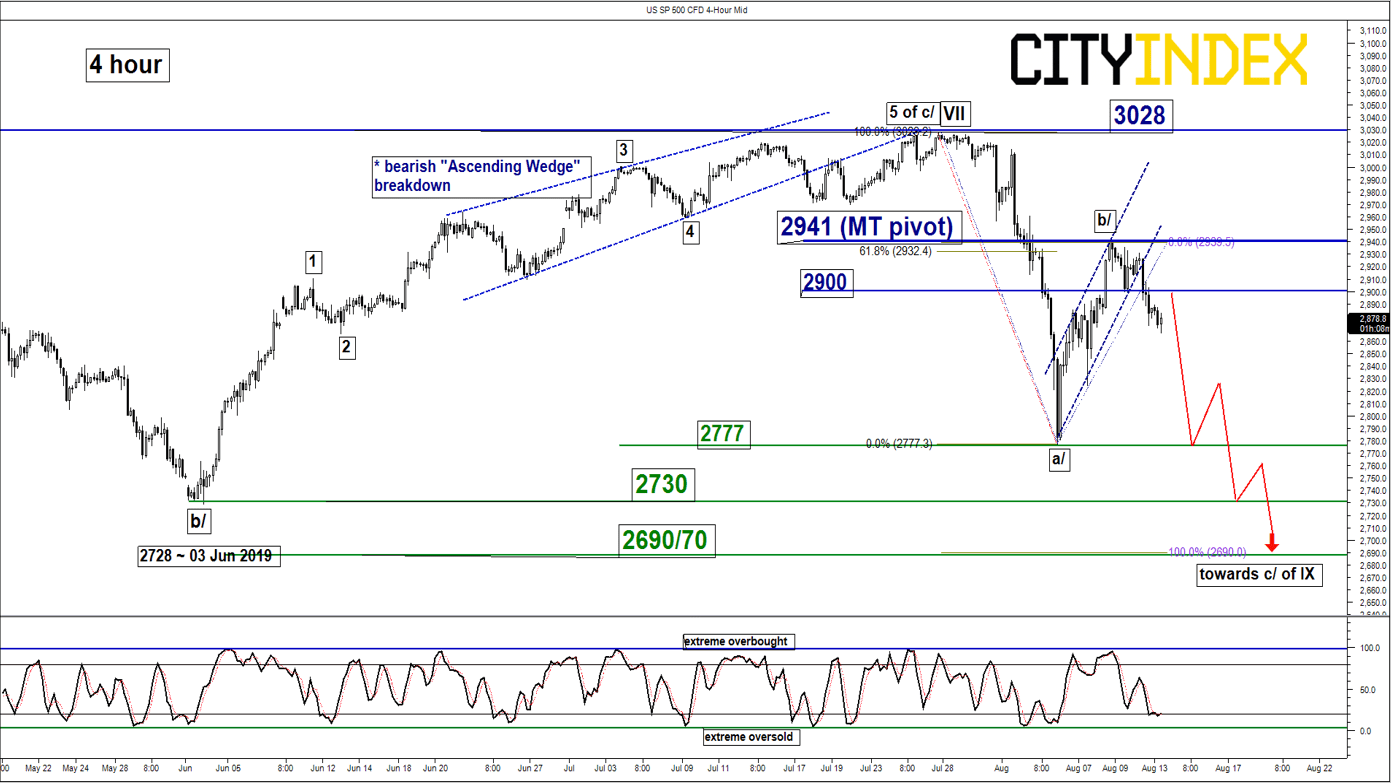
Key Levels (1 to 3 weeks)
Intermediate resistance: 2900
Pivot (key resistance): 2941
Supports: 2777, 2730 & 2690/70
Next resistance: 3028
Directional Bias (1 to 3 weeks)
The expected mean reversion rebound seen on the SP 500 Index (proxy for the S&P 500 futures) has managed to hit the target/resistance of 2900 as per highlighted in our previous report (click here for a recap). It printed a high of 2941 on last Fri, 08 Aug.
Flip back to a bearish bias in any bounces below 2941 key medium-term pivotal resistance for another potential down leg to retest 05 Aug 2019 low before targeting the next supports at 2730 and 2690/70 next. However, a clearance with a daily close above 2941 invalidates the bearish scenario for a squeeze up to retest its current all-time high level at 3028.
Key elements
- Medium-term momentum remains negative as indicated by the daily RSI oscillator which has reversed down right below the 50 level and still has further room to manoeuvre to the downside before it reaches an extreme oversold level at 20.
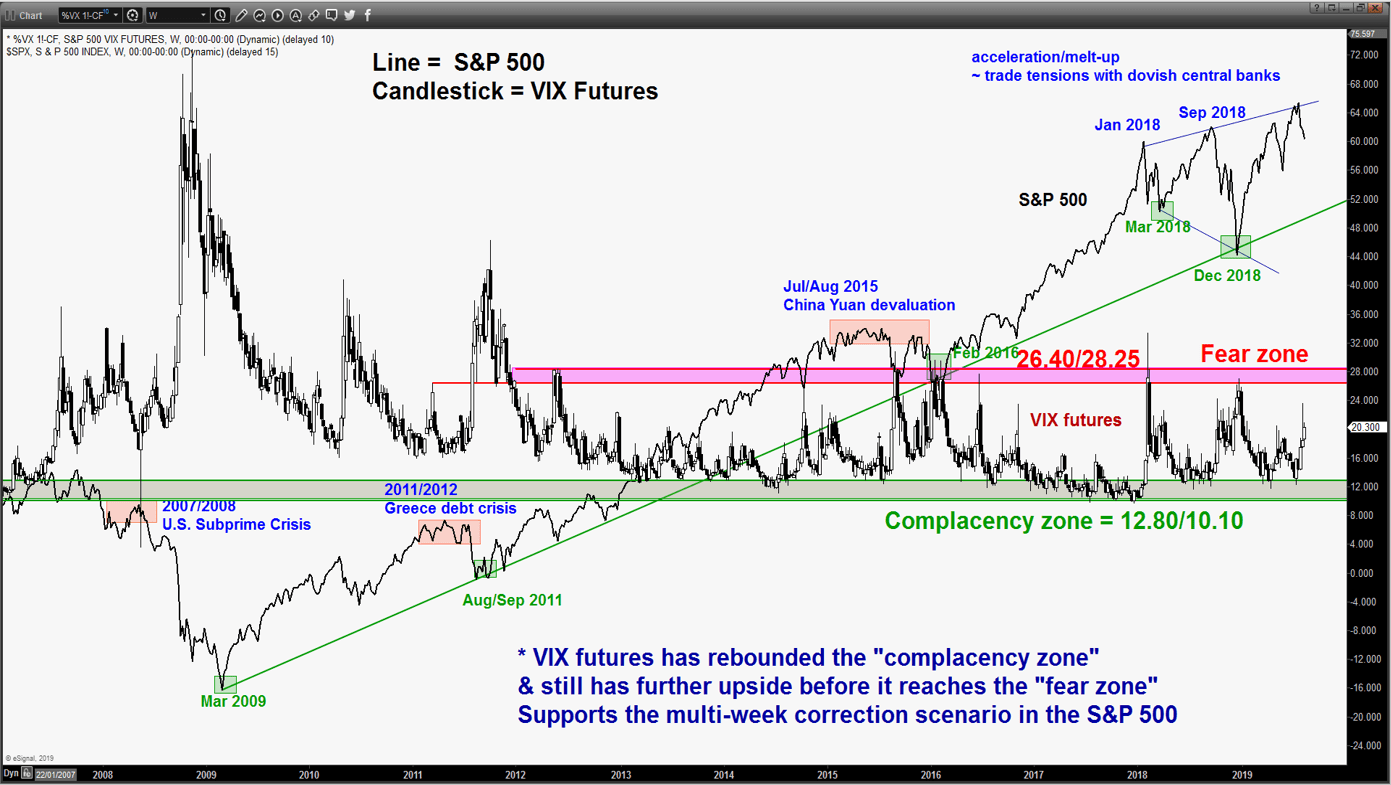
- The VIX futures has traded higher from the “Complacency zone” and shows further potential upside before it reaches the “Fear zone” of 26.40/28.25 where previous significant recoveries in the S&P 500 have occurred.
- The next significant medium-term support rests at 2670/30 which is defined by the previous congestion area of 29 Oct/23 Nov 2018 and a Fibonacci retracement/projection cluster.
Charts are from City Index Advantage TraderPro & eSignal
Latest market news
Yesterday 11:48 PM
Yesterday 11:16 PM
Yesterday 05:00 PM
Yesterday 01:13 PM
Latest Indices articles
Yesterday 11:00 AM
April 16, 2024 08:00 PM
April 16, 2024 04:54 PM
April 15, 2024 06:08 AM