Weekly Technical Outlook on Major Stock Indices Further Potential Rise As Fed Looms
S&P 500 – Rise in progress to retest all-time high
click to enlarge charts
Key Levels (1 to 3 weeks)
Intermediate support: 2870
Pivot (key support): 2840
Resistances: 2959 & 3003 (Fibonacci expansion)
Next support: 2800
Medium-term (1 to 3 weeks) Outlook
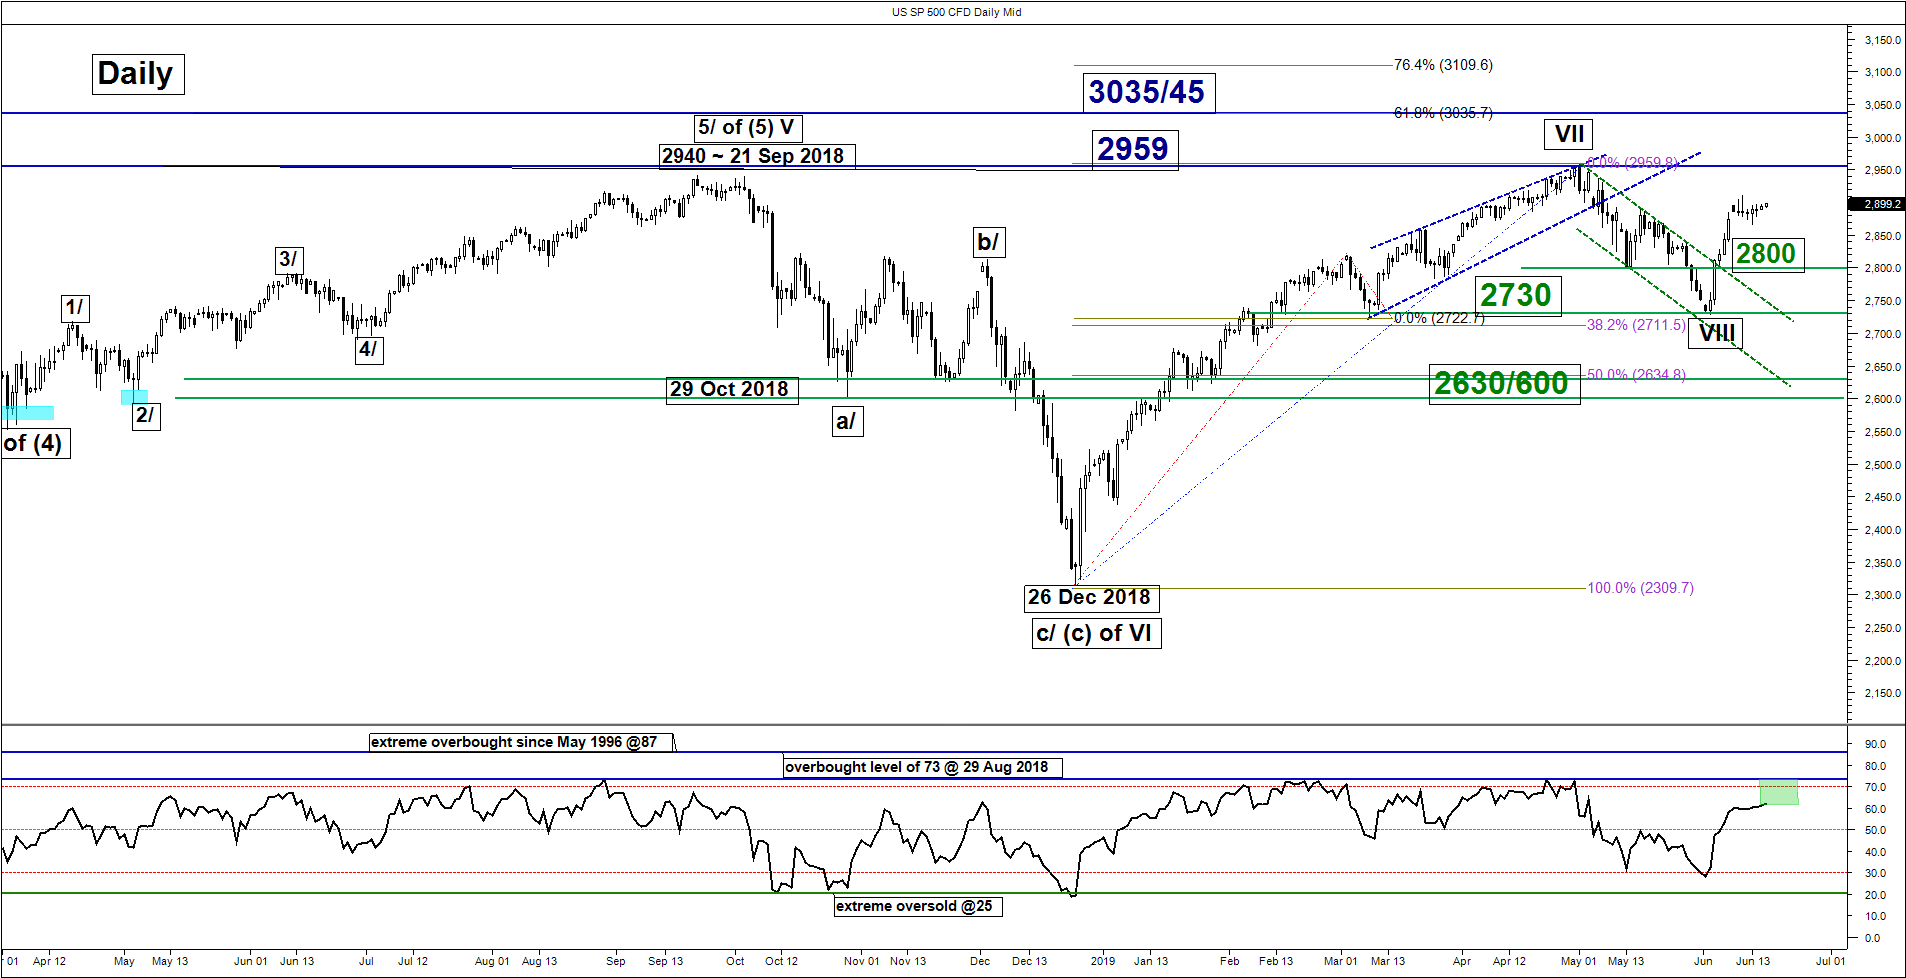
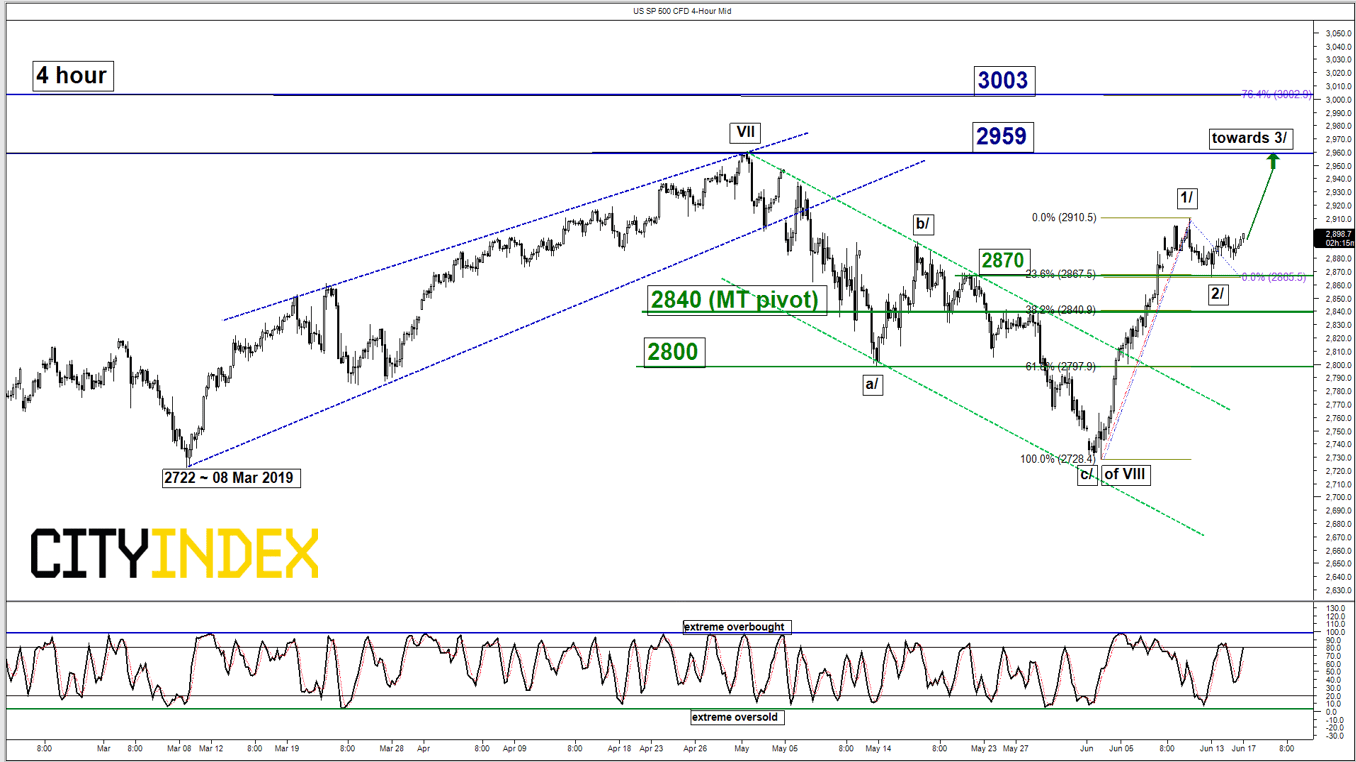
Last week, the SP 500 Index (proxy for the S&P 500 futures) had undergone the expected minor corrective pull-back within its medium-term uptrend phase in place since 03 Jun 2019 low of 2728. It printed a low of 2866 on last Thurs, 13 Jun and fell short of our corrective pull-back target of 2835 before it traded sideways. Click here for a recap.
Medium-term momentum has remained positive where the daily RSI oscillator has continued to inch higher above the 50 level and still has not reached an extreme overbought level of 73. Also, the pull-back seen last week has managed to find support at the 23% Fibonacci retracement of the recent up move from 03 Jun ow to 11 Jun 2019 high which indicates a “shallow pull-back”.
We maintain the bullish bias with an adjusted key medium-term pivotal support set at 2840 (former congestion area of 21 May/28 May 2019 & 38.2% Fibonacci retracement of the recent up move from 03 Jun low to 11 Jun 2019 high) for this week for a potential direct rise to target the all-time high of 2859 and a break above it sees a further potential upleg to target 3003 next.
On the other hand, a break with a daily close below 2840 negates the bullish tone for a deeper pull-back towards the next support at 2800 (also the 61.8% Fibonacci retracement of the recent up move from 03 Jun low to 11 Jun 2019 high).
Nikkei 225 – Further push up in progress within corrective rebound sequence
click to enlarge charts
Key Levels (1 to 3 weeks)
Pivot (key support): 20900/800
Resistances: 21600 & 21900
Next support: 20290/185
Medium-term (1 to 3 weeks) Outlook
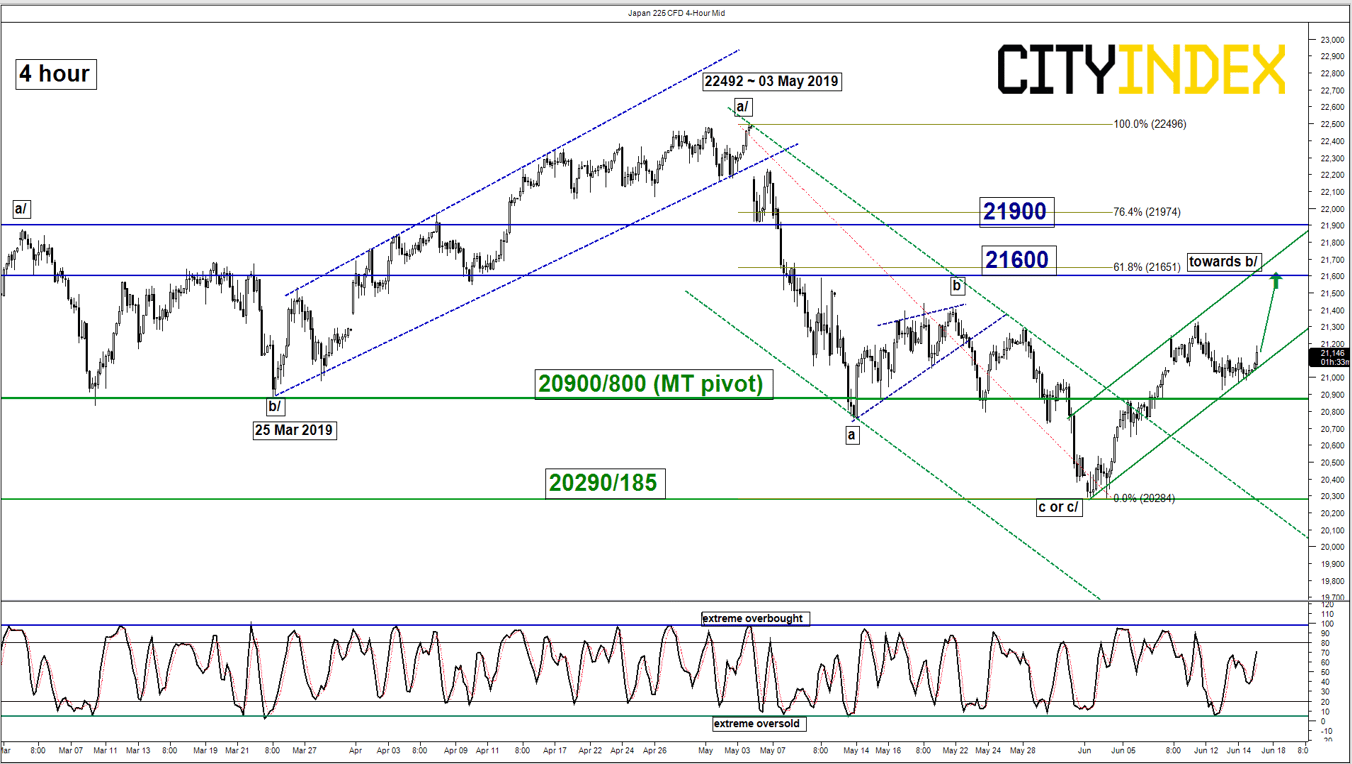
Last week, the Japan 225 Index (proxy for the Nikkei 225 futures) had staged the expected minor corrective pull-back to print a low of 20926 on last Thurs, 13 Jun which almost hit the expected pull-back of target of 20900 as per highlighted in our previous report.
Right now, it is likely that the minor corrective pull-back sequence has ended, and the Index is shaping another upleg of a medium-term (1 to 3 weeks) corrective rebound sequence within a long-term complex range configuration in place since 16 Oct 2018.
We maintain the bullish bias with an adjusted key medium-term pivotal support at 20900/800 for a further potential push to target the next resistance at 21600 and a break above its sees 21900 next (also the 76.4% Fibonacci retracement of the decline from 03 May high to 04 Jun 2019 low).
On the other hand, a break with a daily close below 20800 invalidates the corrective rebound scenario to for a deeper slide towards the next support at 20290/185.
Hang Seng – Sideways, watch 28000 resistance
click to enlarge charts
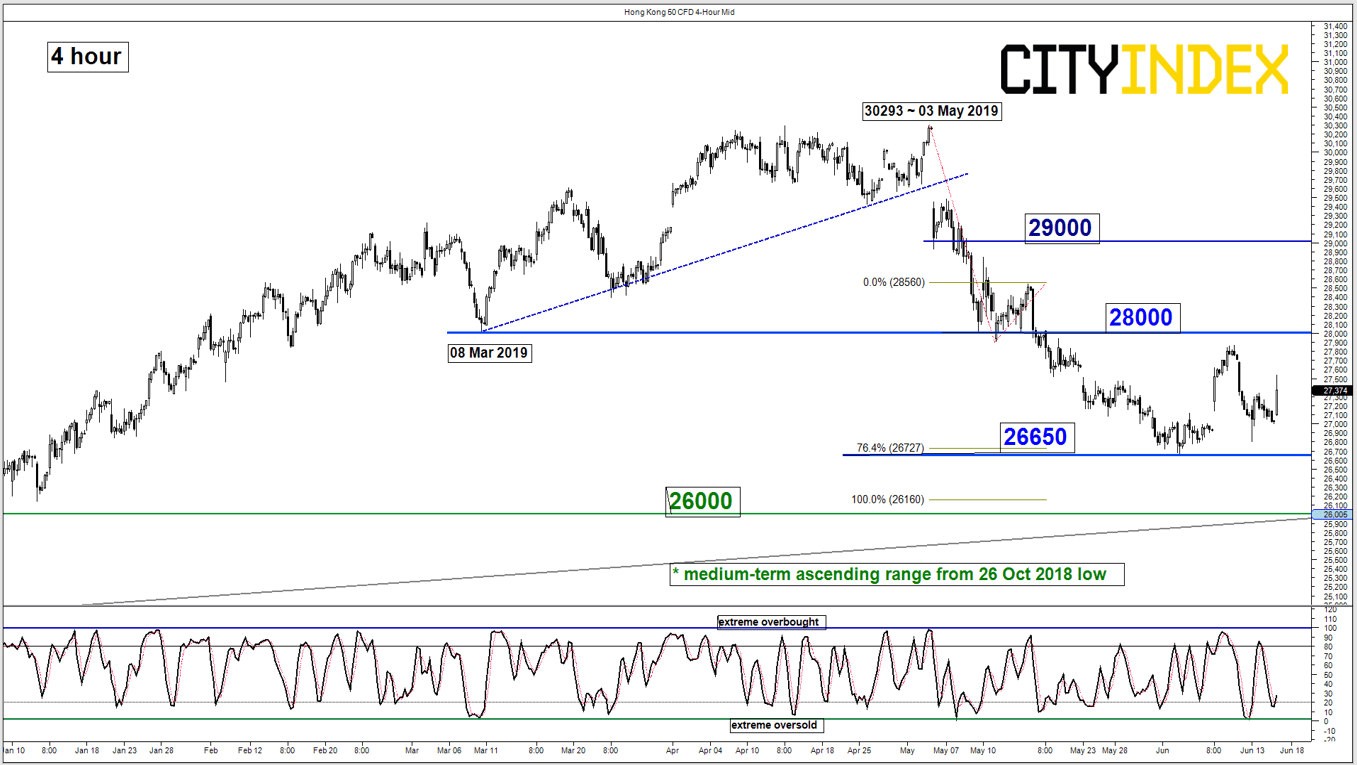
Key Levels (1 to 3 weeks)
Resistances: 27800 & 29000
Supports: 26650 & 26000
Medium-term (1 to 3 weeks) Outlook
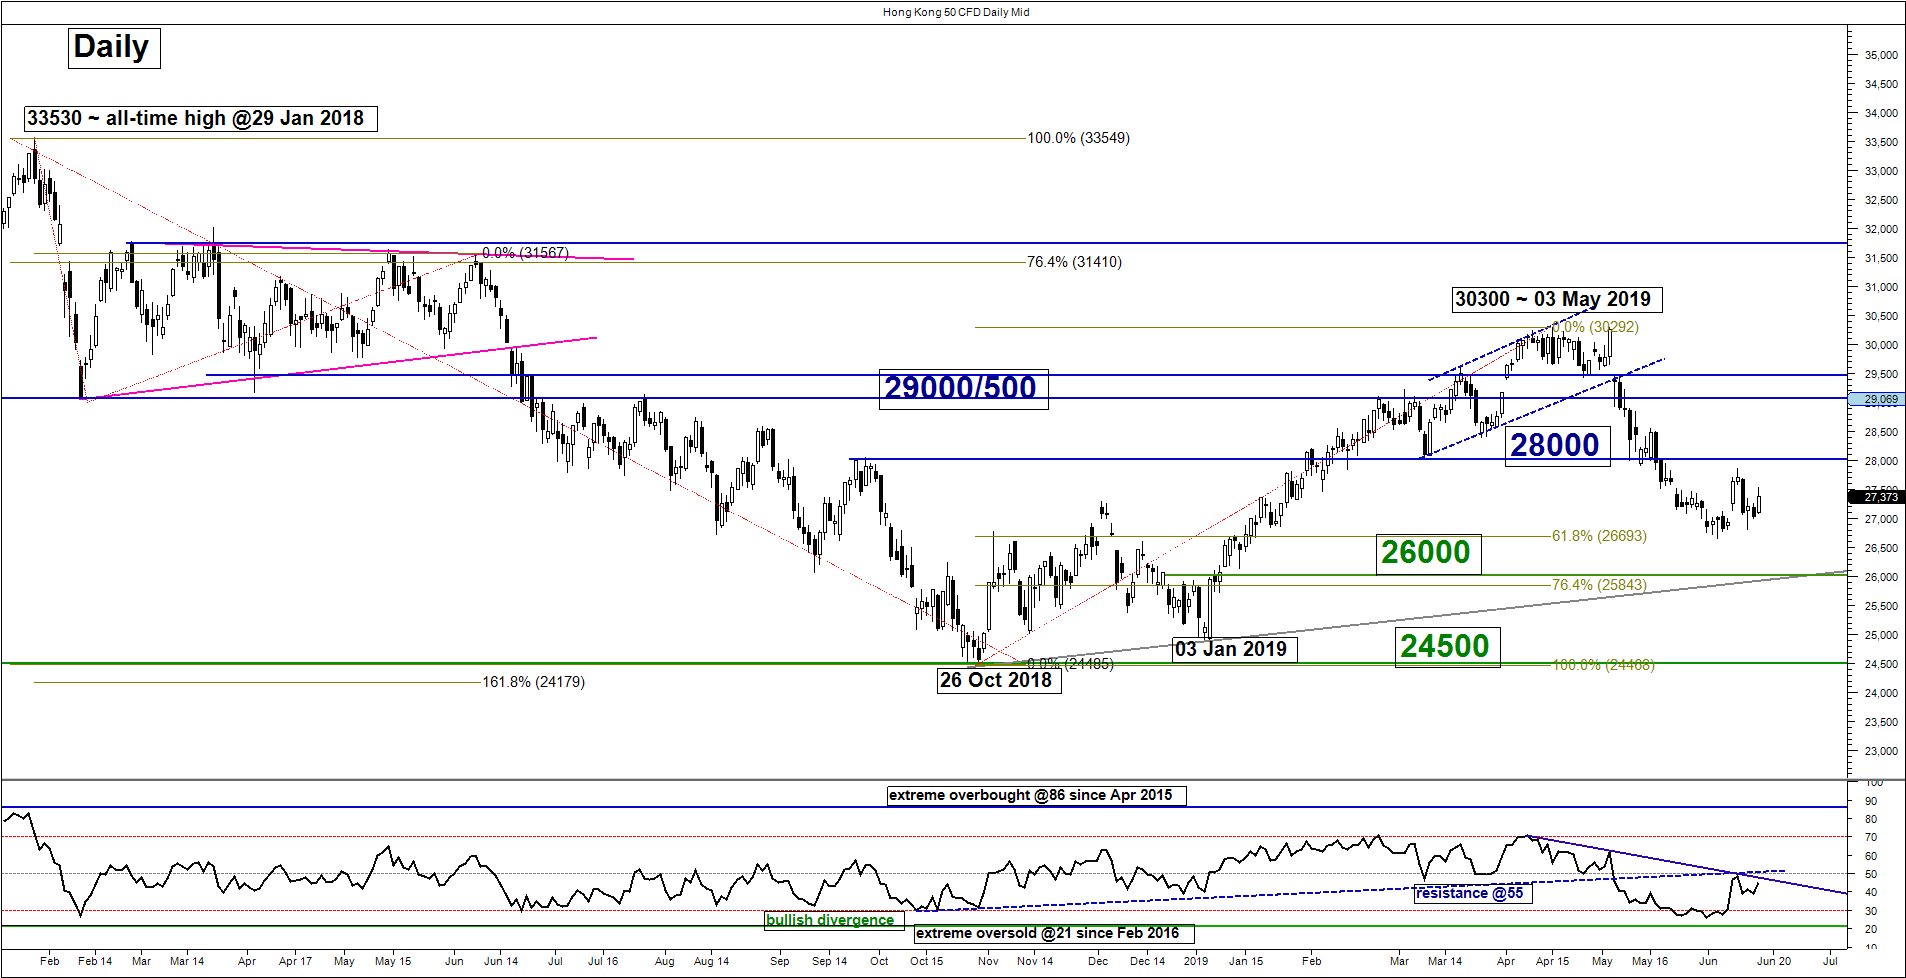
Last week, the Hong Kong 50 Index (proxy for Hang Seng Index futures) has staged a 3.7% drop from its 11 Jun 2019 high of 27871 to print a low 26803 on Thurs, 13 Jun where localised sentiment has been dampened due to massive street demonstrations over the controversial China extradition bill that the Hong Kong administration wants to pass.
Technical elements remain mix where last week’s drop has managed to find support right above the 26650 lower limit of the neutrality zone as per highlighted in our previous report. In addition, the daily RSI oscillator is sill below a significant corresponding resistance at the 55 level.
No change, we maintain the neutral stance between 28000 and 26650. Only a break below 26650 sees a further corrective decline towards the major support at 26000 (ascending range in place since 26 Oct 2018 low & Fibonacci retracement/expansion cluster). On the flipside, a clearance above 28000 opens ups cope for a further push up to target the next resistance at 29000 in the first step (former major swing low of 09 Feb 2018 & 61.8% Fibonacci retracement of the decline from 03 May high to 04 Jun 2019 low).
ASX 200 – Direct rise towards “Expanding Wedge” resistance
click to enlarge charts
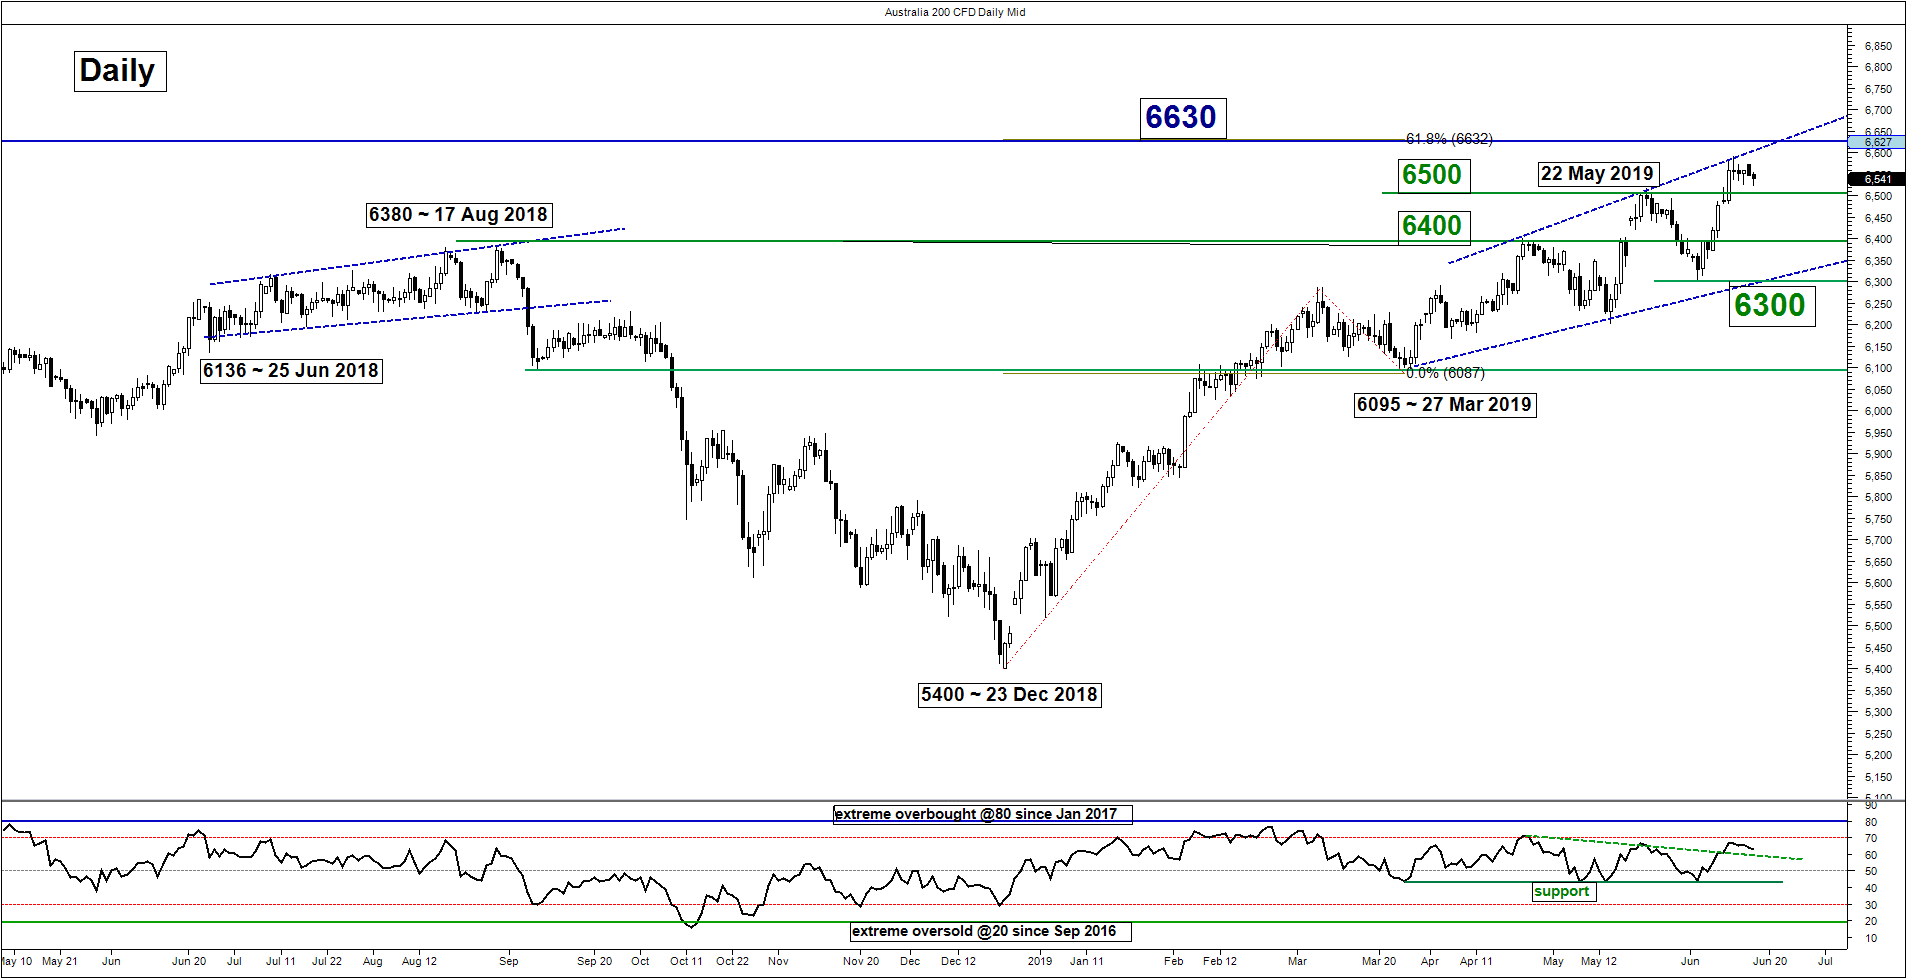
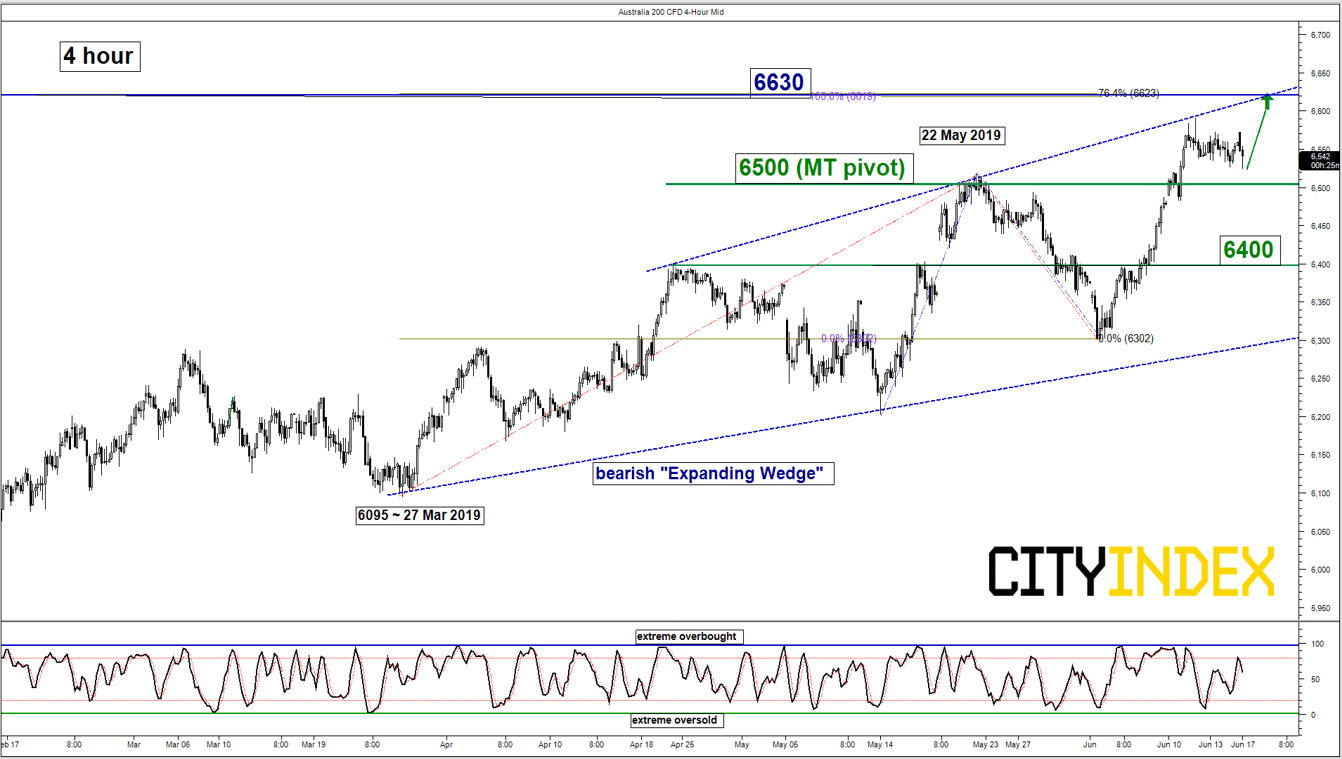
Key Levels (1 to 3 weeks)
Pivot (key support): 6500
Resistance: 6630
Next support: 6400
Medium-term (1 to 3 weeks) Outlook
Last week, Australia 200 Index (proxy for the ASX 200 futures) had shaped just a shallow pull-back to print a low of 6483 on 11 Jun 2019 before it staged a push up to break above 22 May 2019 high of 6520.
Momentum reading remains positive as seen from the daily RSI and 4-hour Stochastic oscillator. We maintain the bullish bias with an adjusted key medium-term pivotal support now at 6500 (also the 23.6% Fibonacci retracement of the recent up move from 03 Jun low to 12 Jun 2019 high) for a further potential push up to target the next resistance at 6630 (Fibonacci expansion cluster & upper limit of the “Expanding Wedge”).
On the other hand, a break with a daily close below 6500 negates the bullish tone for a deeper pull-back towards the next support at 6400 (also the 61.8% Fibonacci retracement of the recent up move from 03 Jun low to 12 Jun 2019 high).
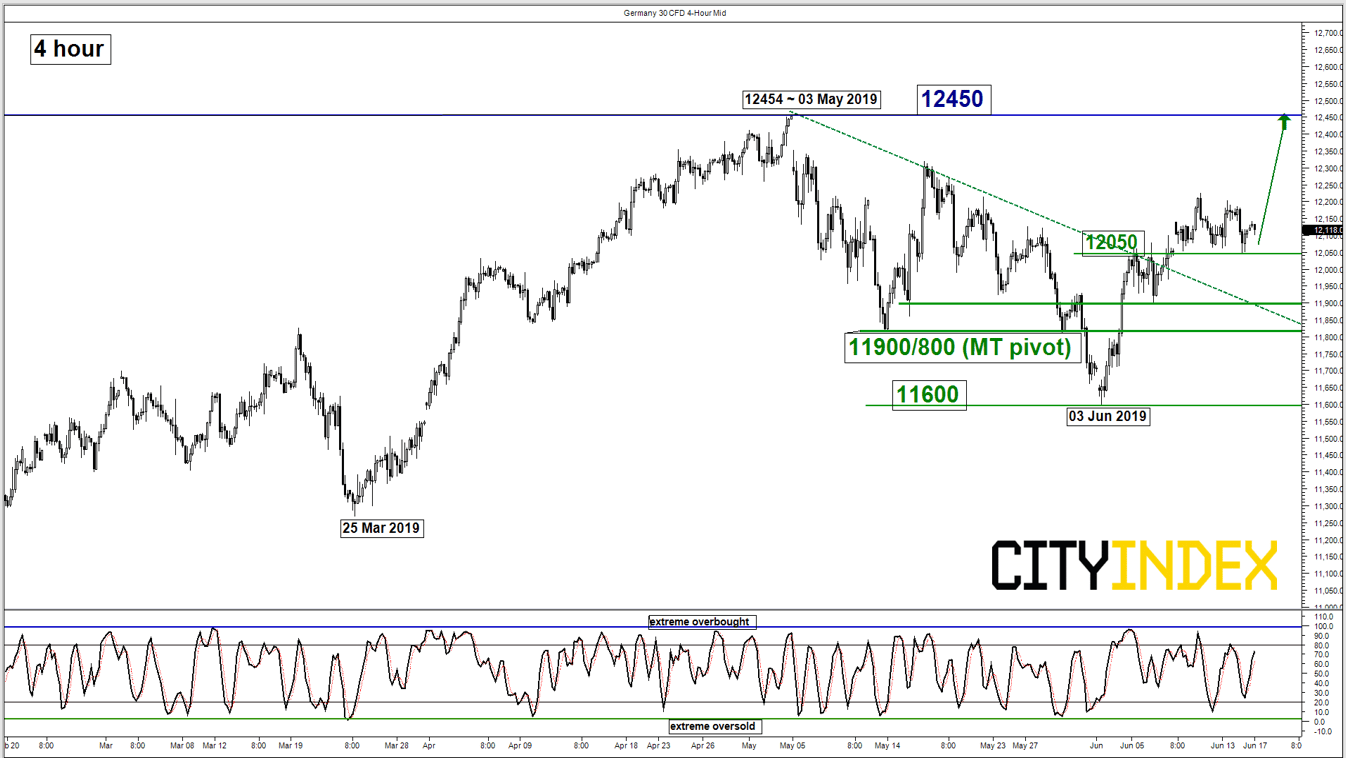
DAX – Bullish tone remains intact
click to enlarge charts
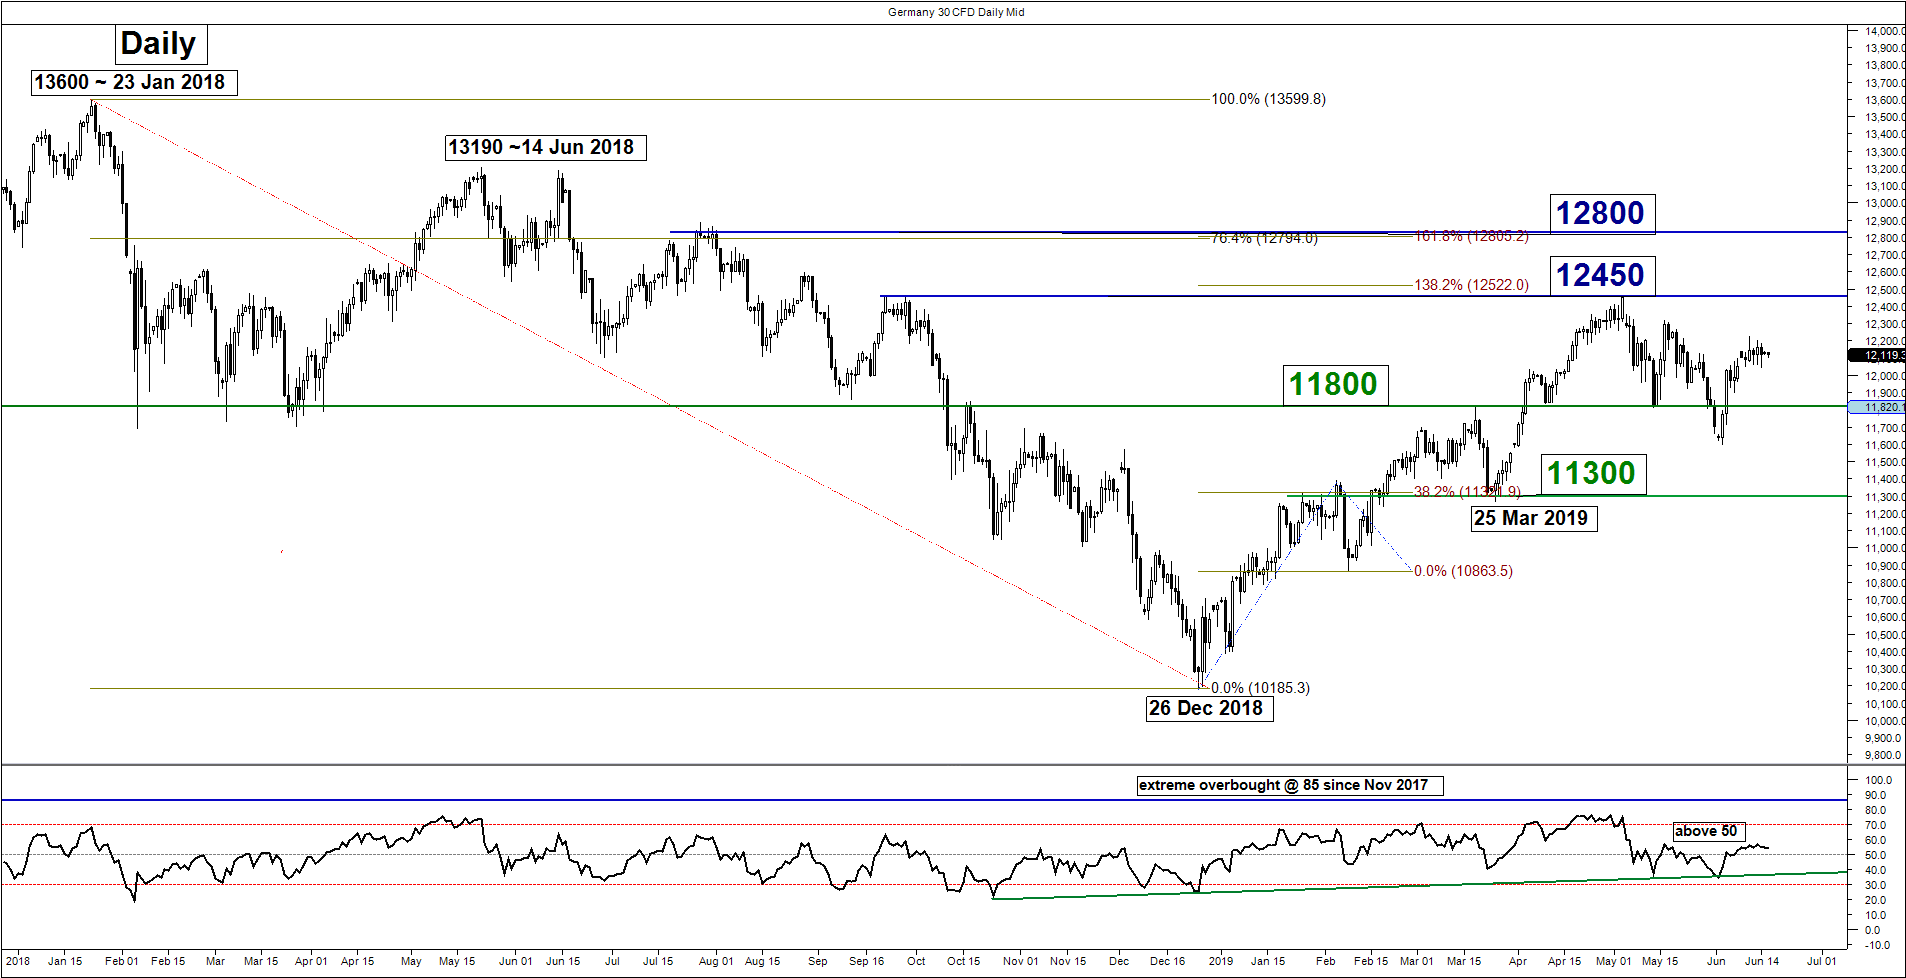
Key Levels (1 to 3 weeks)
Intermediate support: 12050
Pivot (key support): 11900/800
Resistance: 12450
Next support: 11600
Medium-term (1 to 3 weeks) Outlook
Last week, the Germany 30 Index (proxy for the DAX futures) has traded sideways since its bullish break above the former descending resistance from 03 May 2019 swing high.
Key elements remain positive; we maintain the bullish bias above the 11900/800 key medium-term pivotal support for a further potential push up to target the 12450 resistance (03 May 2019 swing high).
On the other hand, a break with a daily close below 11800 invalidates the bullish scenario for a slide to retest the 03 Jun 2019 low of 11600 in the first step.
Charts are from City Index Advantage TraderPro
StoneX Financial Ltd (trading as “City Index”) is an execution-only service provider. This material, whether or not it states any opinions, is for general information purposes only and it does not take into account your personal circumstances or objectives. This material has been prepared using the thoughts and opinions of the author and these may change. However, City Index does not plan to provide further updates to any material once published and it is not under any obligation to keep this material up to date. This material is short term in nature and may only relate to facts and circumstances existing at a specific time or day. Nothing in this material is (or should be considered to be) financial, investment, legal, tax or other advice and no reliance should be placed on it.
No opinion given in this material constitutes a recommendation by City Index or the author that any particular investment, security, transaction or investment strategy is suitable for any specific person. The material has not been prepared in accordance with legal requirements designed to promote the independence of investment research. Although City Index is not specifically prevented from dealing before providing this material, City Index does not seek to take advantage of the material prior to its dissemination. This material is not intended for distribution to, or use by, any person in any country or jurisdiction where such distribution or use would be contrary to local law or regulation.
For further details see our full non-independent research disclaimer and quarterly summary.
CFDs are complex instruments and come with a high risk of losing money rapidly due to leverage. 69% of retail investor accounts lose money when trading CFDs with this provider. You should consider whether you understand how CFDs work and whether you can afford to take the high risk of losing your money. CFD and Forex Trading are leveraged products and your capital is at risk. They may not be suitable for everyone. Please ensure you fully understand the risks involved by reading our full risk warning.
City Index is a trading name of StoneX Financial Ltd. Head and Registered Office: 1st Floor, Moor House, 120 London Wall, London, EC2Y 5ET. StoneX Financial Ltd is a company registered in England and Wales, number: 05616586. Authorised and regulated by the Financial Conduct Authority. FCA Register Number: 446717.
City Index is a trademark of StoneX Financial Ltd.
The information on this website is not targeted at the general public of any particular country. It is not intended for distribution to residents in any country where such distribution or use would contravene any local law or regulatory requirement.
© City Index 2024