US Stocks Bullish catch up for laggards BAC C CAT post trade deal
Global financial markets are in risk on mode after US President Trump has agreed to the terms of the U.S-China Phase One “mini trade deal” that will put on hold the additional 15% tariffs on US$160 billion worth of China products that are scheduled to take place on 15 Dec. In return, China will increase significantly the purchase of U.S agricultural products and step up commitments to do more to stop intellectual property theft. In additional, both sides have agreed to roll back “certain portions” of existing tariffs in place.
In additional, the “risk on” animal spirts have also been reinforced by the latest round of U.S. Federal Reserve’s repo operations to add additional liquidity of US$365 billion into the short-term funding market through Jan 2020 to ease any potential freeze in liquidity as we head into the crucial year end period.
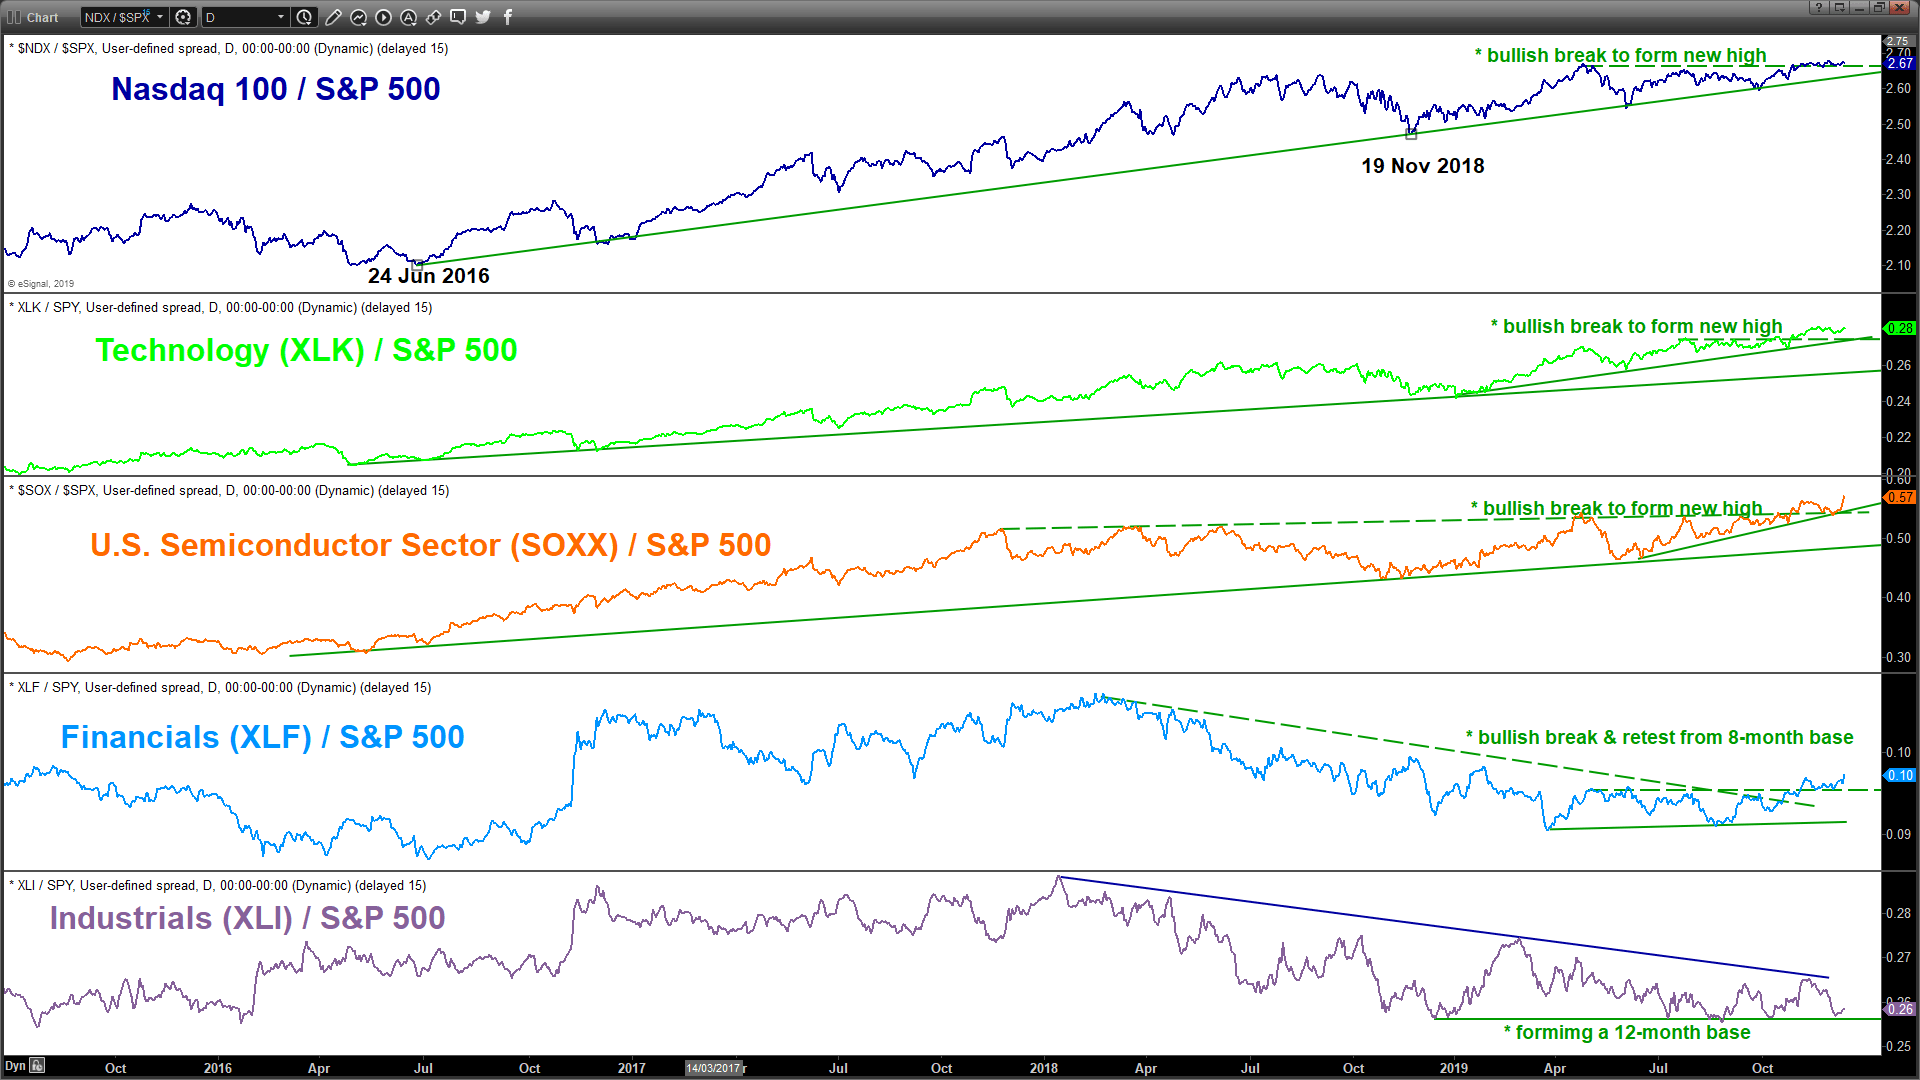
In a nutshell, risk assets are being supported by these “events” at least in the medium-term. We have covered much ground on the major stock indices and explained from a technical analysis perspective why the bulls are still in control plus highlighting the continuation of the outperformance of the high beta Nasdaq 100, Technology and Semiconductor sectors that are leading the “bull convoy”.
Right now, we will be highlighting some laggard stocks that can see potential rotation into the coming weeks given their respective upside momentum has just started from a “lower base”.
Relative Strength/Ratio charts
- The ratio chart of the laggards; Financial and Industrials have started to see signs of outperformance of against the market (S&P 500).
- The Financials / S&P 500 ratio has staged a bullish breakout after it has formed a base since Mar 2019.
- The Industrials / S&P 500 ratio has started to form and rebound from the support of its major 12-momth basing formation in place since Dec 2018.
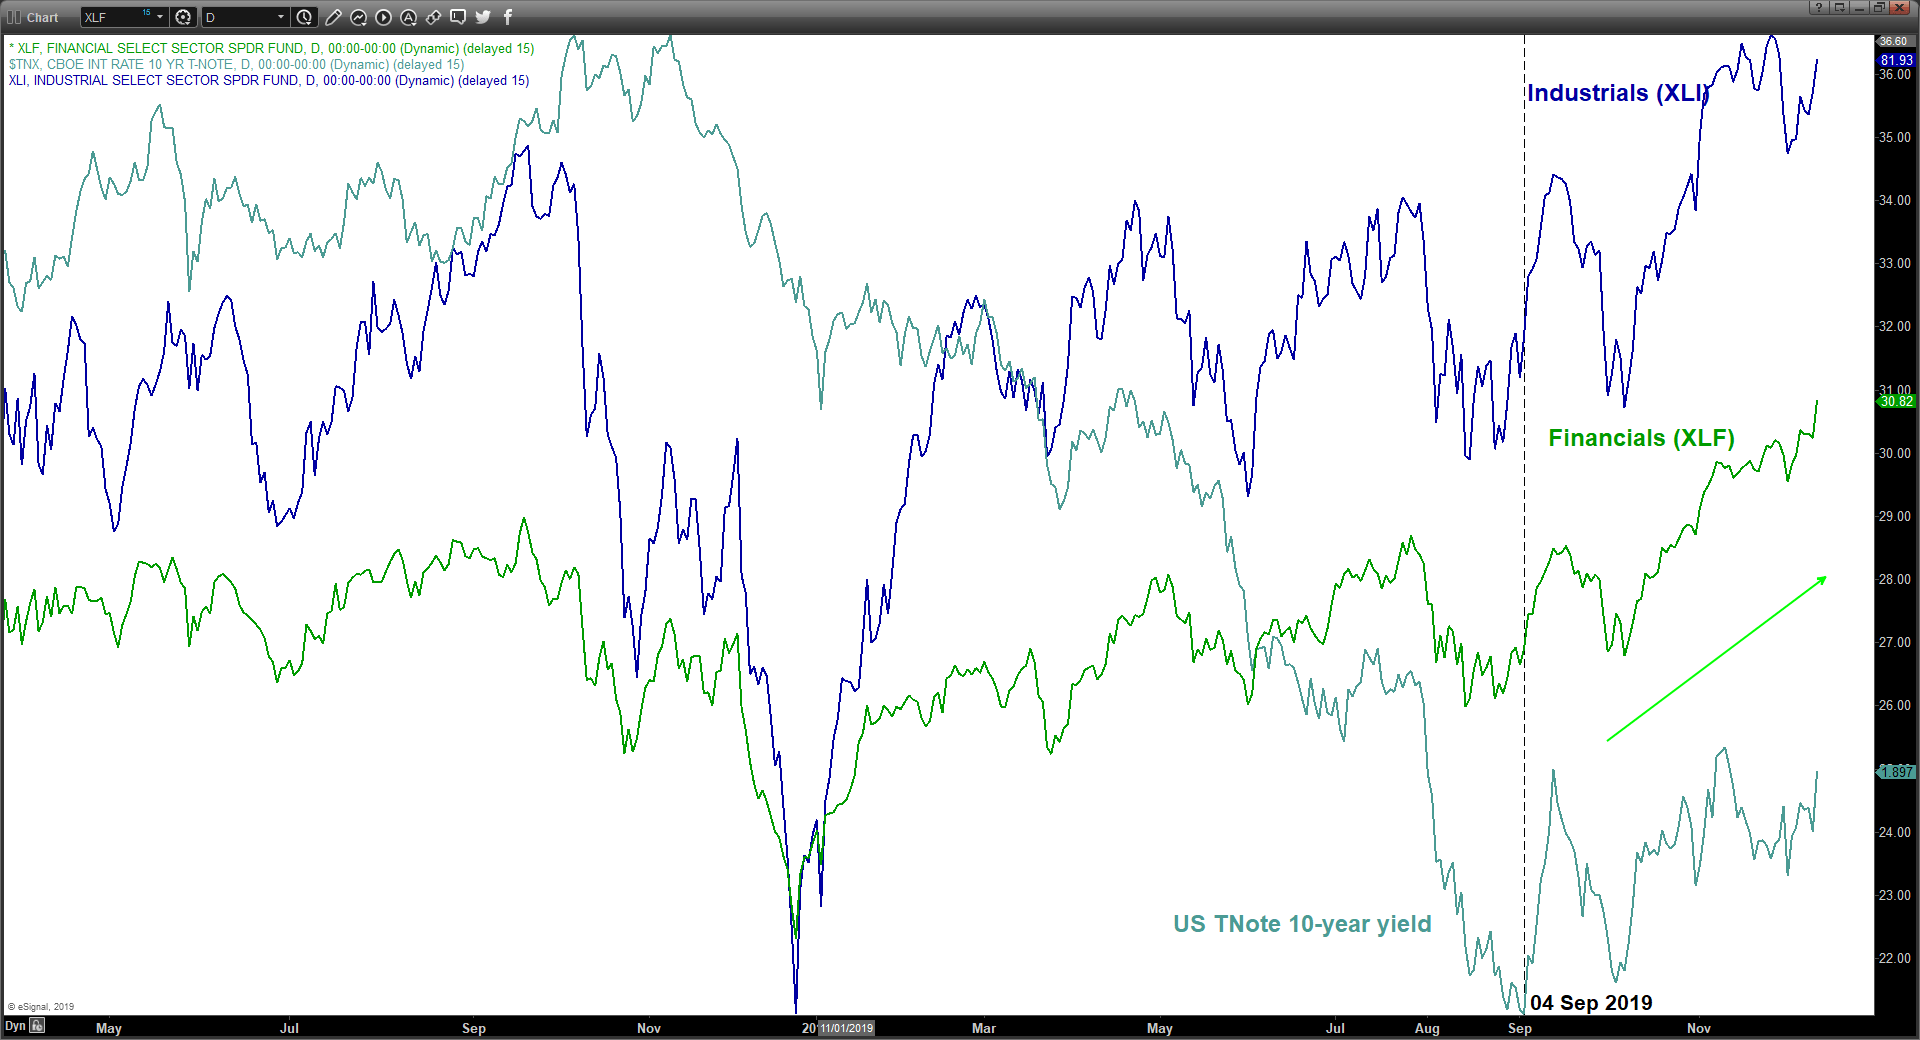
Movement of US Treasury 10-year yield with Industrials & Financials
- The continuation of an upswing of “higher lows” seen in the U.S. Treasure (TNote) 10-year yield since 04 Sep 2019 is also supporting the on-going upside movement seen in the Industrials and Financial sectors
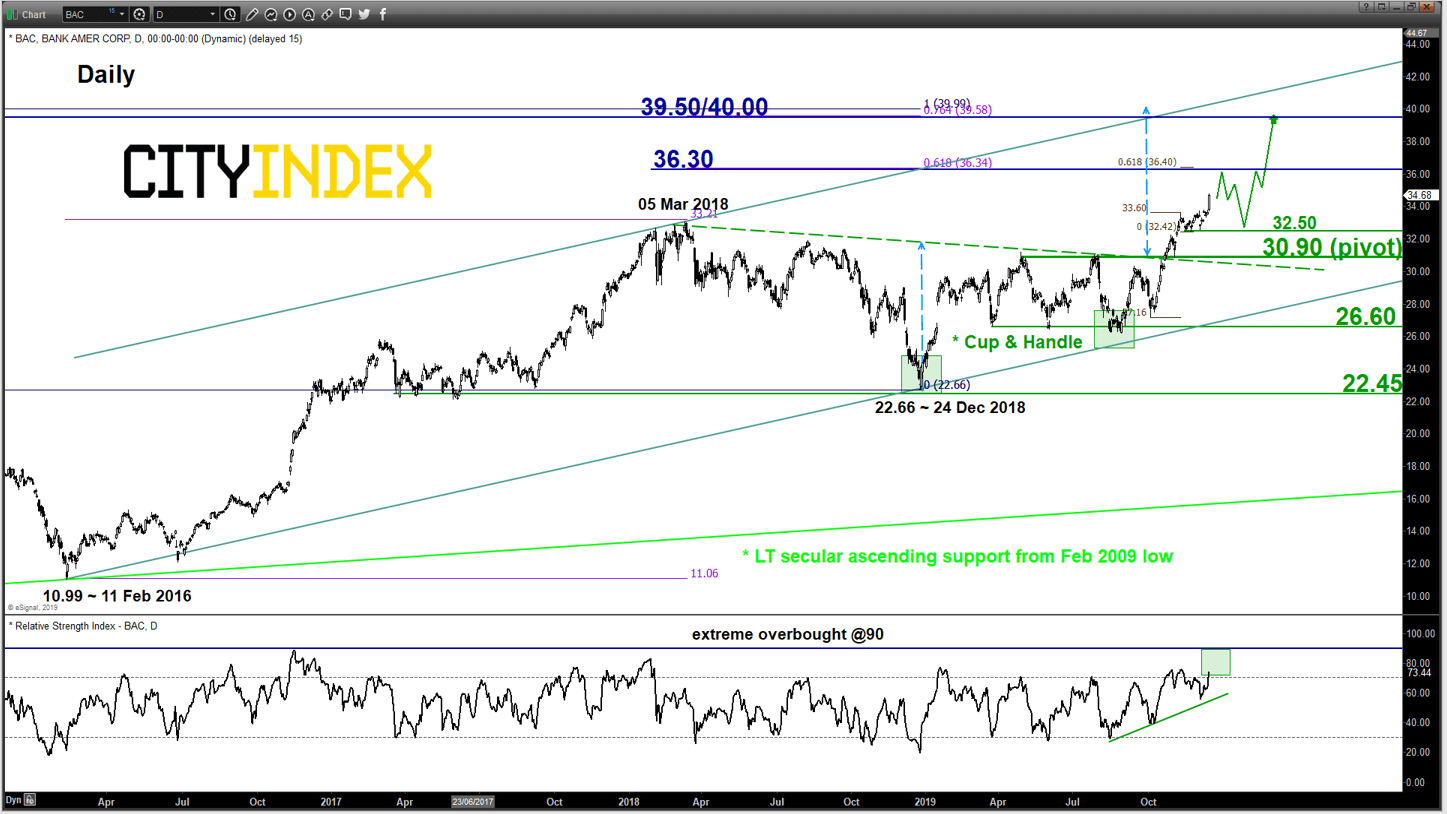
Bank of America (BAC) – Impulsive up move remains in progress
click to enlarge chart
- We had highlighted BAC in our earlier report dated on 22 Oct 2019 (click here for a recap).
- Key technical elements remain positive, we have adjusted the key medium-term pivotal support higher to 30.90 from 30.30 for a further potential up move to target the next resistances at 36.30 and 39.50/40.00.
- On the other hand, a daily close below 30.90 invalidates the bullish bias for a corrective decline to test the major support at 26.60 (also the lower boundary of an ascending channel from 11 Feb 2016 low).
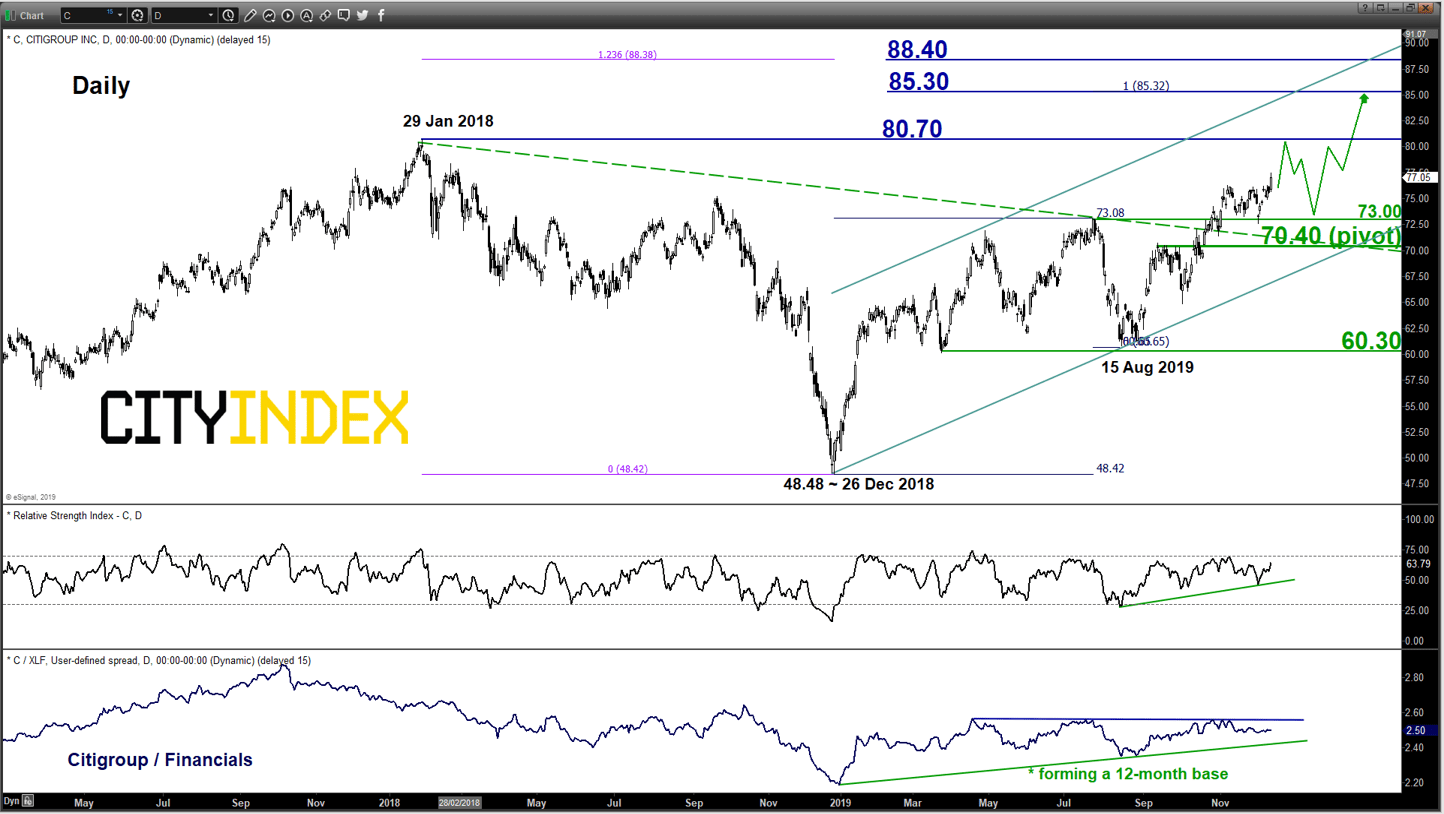
Citigroup (C) – Continues to inch higher after bullish breakout from major descending resistance
click to enlarge chart
- C has started to evolve within an ascending channel in place since 26 Dec 2018 low. Bullish bias in any dips above 70.40 key medium-term pivotal support for a further potential up move to target 80.70 and 85.30 next.
- On the other hand, a daily close below 70.40 invalidates the bullish breakout scenario for a corrective decline towards the next support at 60.30.
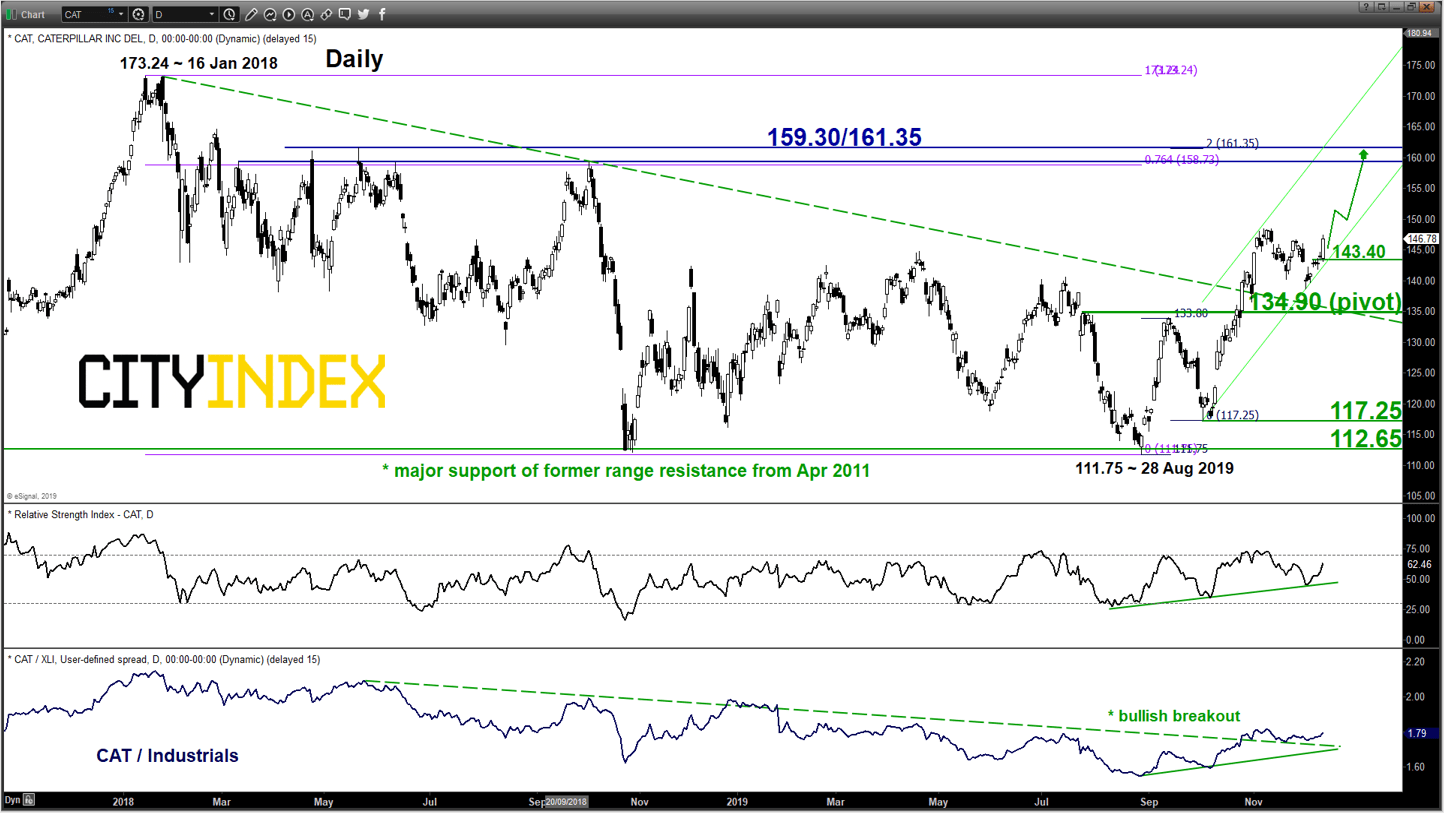
Caterpillar Inc (CAT) – Moving higher after bullish breakout from 10-month descending resistance
click to enlarge chart
- Bullish bias in any dips above 134.90 key medium-term pivotal support for a further potential push up to target the next resistance at 159.30/161.35 (also a Fibonacci expansion/retracement cluster).
- On the other hand, a daily close below 134.90 invalidates the bullish breakout for corrective decline back to retest the major range support at 117.25/112.65.
Charts are from eSignal
Related analysis:
Stock Indices Weekly Technical Outlook: Mix bag while S&P 500 remains in an uptrend phase
Nasdaq 100: Impulsive up move likely resuming supported by Fed
StoneX Financial Ltd (trading as “City Index”) is an execution-only service provider. This material, whether or not it states any opinions, is for general information purposes only and it does not take into account your personal circumstances or objectives. This material has been prepared using the thoughts and opinions of the author and these may change. However, City Index does not plan to provide further updates to any material once published and it is not under any obligation to keep this material up to date. This material is short term in nature and may only relate to facts and circumstances existing at a specific time or day. Nothing in this material is (or should be considered to be) financial, investment, legal, tax or other advice and no reliance should be placed on it.
No opinion given in this material constitutes a recommendation by City Index or the author that any particular investment, security, transaction or investment strategy is suitable for any specific person. The material has not been prepared in accordance with legal requirements designed to promote the independence of investment research. Although City Index is not specifically prevented from dealing before providing this material, City Index does not seek to take advantage of the material prior to its dissemination. This material is not intended for distribution to, or use by, any person in any country or jurisdiction where such distribution or use would be contrary to local law or regulation.
For further details see our full non-independent research disclaimer and quarterly summary.
CFDs are complex instruments and come with a high risk of losing money rapidly due to leverage. 69% of retail investor accounts lose money when trading CFDs with this provider. You should consider whether you understand how CFDs work and whether you can afford to take the high risk of losing your money. CFD and Forex Trading are leveraged products and your capital is at risk. They may not be suitable for everyone. Please ensure you fully understand the risks involved by reading our full risk warning.
City Index is a trading name of StoneX Financial Ltd. Head and Registered Office: 1st Floor, Moor House, 120 London Wall, London, EC2Y 5ET. StoneX Financial Ltd is a company registered in England and Wales, number: 05616586. Authorised and regulated by the Financial Conduct Authority. FCA Register Number: 446717.
City Index is a trademark of StoneX Financial Ltd.
The information on this website is not targeted at the general public of any particular country. It is not intended for distribution to residents in any country where such distribution or use would contravene any local law or regulatory requirement.
© City Index 2024