US Stock Selection NVIDIA at risk of another downleg as G20 looms
NVIDIA (NVDA)
click to enlarge charts
In our previous report dated 02 May 2019, the share price of NVIDIA (NVDA) had tumbled as expected and hit the downside target/support of 153.40 on 20 May 20019, click here for a recap.
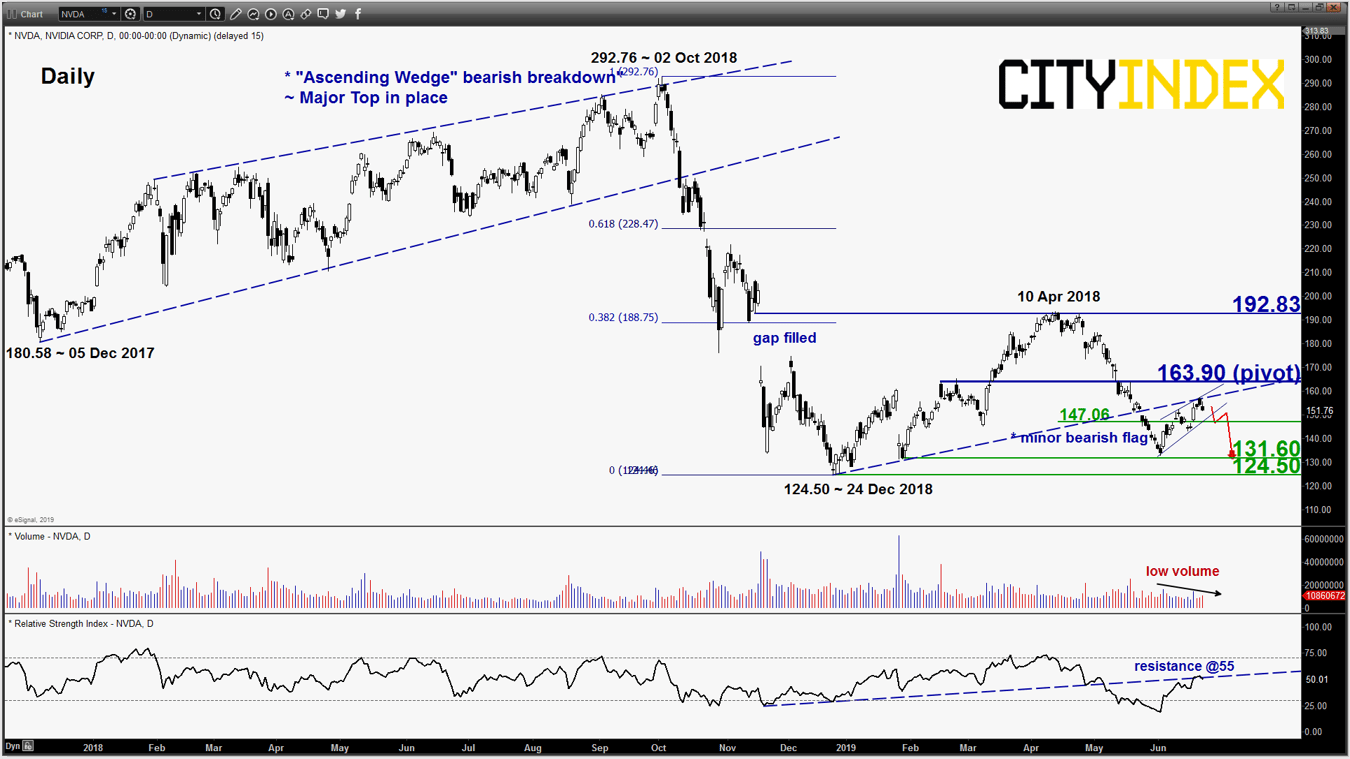
It has continued to inch downwards and printed a low of 132.60 on 03 Jun 2019 before it staged a recovery of 18% to print a recent high of 157.33 on 20 Jun 2019 assisted by an increasing dovish monetary policy stance adopted by the Fed. In the coming few weeks, the focus will shift back to the progress on the on-going trade tensions between U.S. and China as NVDA is one of the U.S. key semiconductors firms that its operations will be affected significantly if the trade tensions continue to escalate. Paramount will be this week G20 summit on 28 to 29 Jun where U.S President Trump will meet with China President Xi on the side-lines to discuss about matters related to the U.S-Sino trade relations.
Key technical elements
- The recovery 18% seen in NVDA from its 03 Jun 2019 low of 132.60 has taken on the form of a “bearish flag” configuration coupled with a lower average volume seen in the past 15 days. These observations suggest the recovery is a potential “dead cat bounce” within its medium-term downtrend in place since 10 Apr 2019.
- The daily RSI oscillator has tested and retreated from a significant corresponding resistance at the 55 level.
- The key medium-term resistance stands at 163.90 which is defined by the former ascending support from 24 Dec 2018 low and the 50% Fibonacci retracement of the previous decline from 10 Apr high to 03 Jun 2019 low.
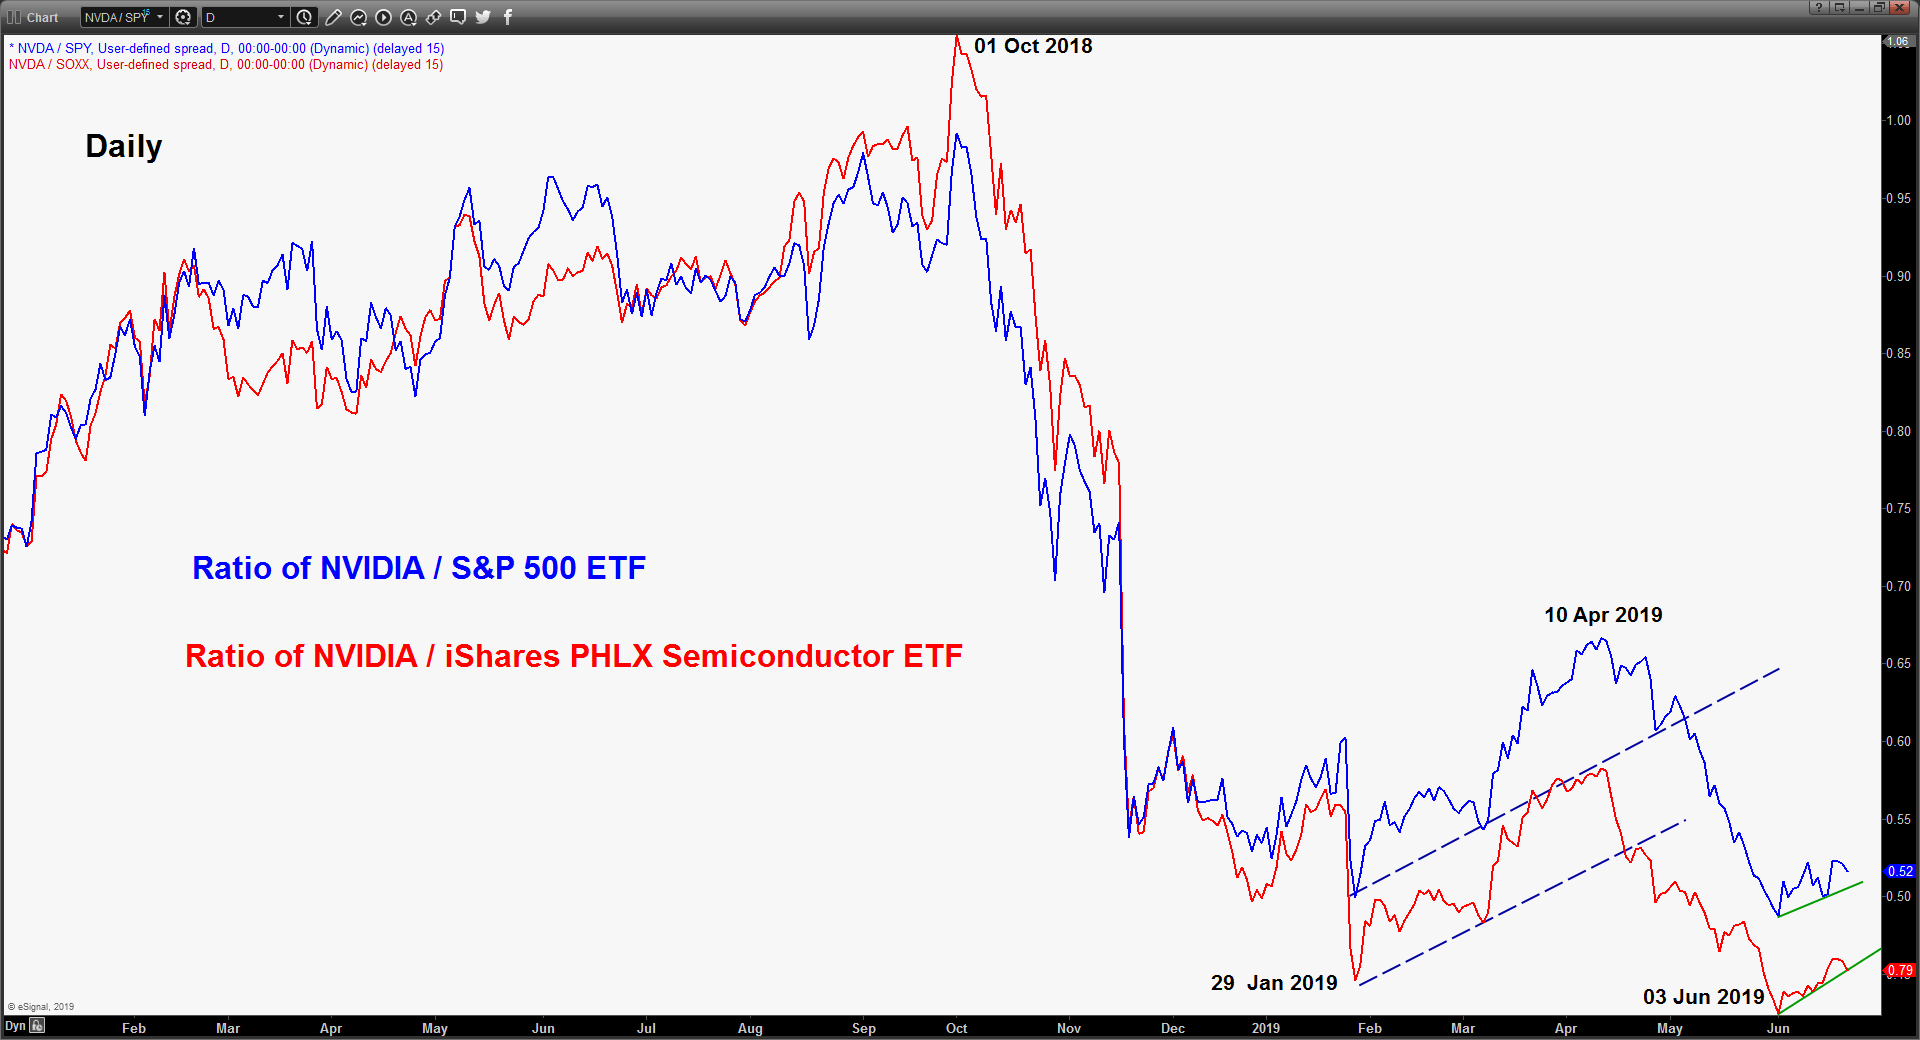
- Relative strength analysis from the ratios of NVDA against its industry sector (PHLX Semiconductor SOXX) and the U.S. benchmark stock index (S&P 500) have continued to exhibit medium-term weakness/underperformance.
Key Levels (1 to 3 weeks)
Intermediate resistance: 157.33
Pivot (key resistance): 163.90
Supports: 147.06, 131.60 & 124.50
Next resistance: 192.83
Conclusion
If the 163.90 key medium-term pivotal resistance is not surpassed and a break below 147.06 (the lower boundary of the “bearish flag”) is likely to reinforce the start of another potential downleg to target 131.60 support with a maximum limit set at 124.50 (the 24 Dec 2018 major swing low).
On the other hand, a clearance with a daily close above 163.90 invalidates the bearish scenario for an extension of the corrective rebound towards the next resistance at 192.83.
Charts are from eSignal
StoneX Financial Ltd (trading as “City Index”) is an execution-only service provider. This material, whether or not it states any opinions, is for general information purposes only and it does not take into account your personal circumstances or objectives. This material has been prepared using the thoughts and opinions of the author and these may change. However, City Index does not plan to provide further updates to any material once published and it is not under any obligation to keep this material up to date. This material is short term in nature and may only relate to facts and circumstances existing at a specific time or day. Nothing in this material is (or should be considered to be) financial, investment, legal, tax or other advice and no reliance should be placed on it.
No opinion given in this material constitutes a recommendation by City Index or the author that any particular investment, security, transaction or investment strategy is suitable for any specific person. The material has not been prepared in accordance with legal requirements designed to promote the independence of investment research. Although City Index is not specifically prevented from dealing before providing this material, City Index does not seek to take advantage of the material prior to its dissemination. This material is not intended for distribution to, or use by, any person in any country or jurisdiction where such distribution or use would be contrary to local law or regulation.
For further details see our full non-independent research disclaimer and quarterly summary.
CFDs are complex instruments and come with a high risk of losing money rapidly due to leverage. 69% of retail investor accounts lose money when trading CFDs with this provider. You should consider whether you understand how CFDs work and whether you can afford to take the high risk of losing your money. CFD and Forex Trading are leveraged products and your capital is at risk. They may not be suitable for everyone. Please ensure you fully understand the risks involved by reading our full risk warning.
City Index is a trading name of StoneX Financial Ltd. Head and Registered Office: 1st Floor, Moor House, 120 London Wall, London, EC2Y 5ET. StoneX Financial Ltd is a company registered in England and Wales, number: 05616586. Authorised and regulated by the Financial Conduct Authority. FCA Register Number: 446717.
City Index is a trademark of StoneX Financial Ltd.
The information on this website is not targeted at the general public of any particular country. It is not intended for distribution to residents in any country where such distribution or use would contravene any local law or regulatory requirement.
© City Index 2024