


Nvidia (NVDA)
click to enlarge charts
Key technical elements
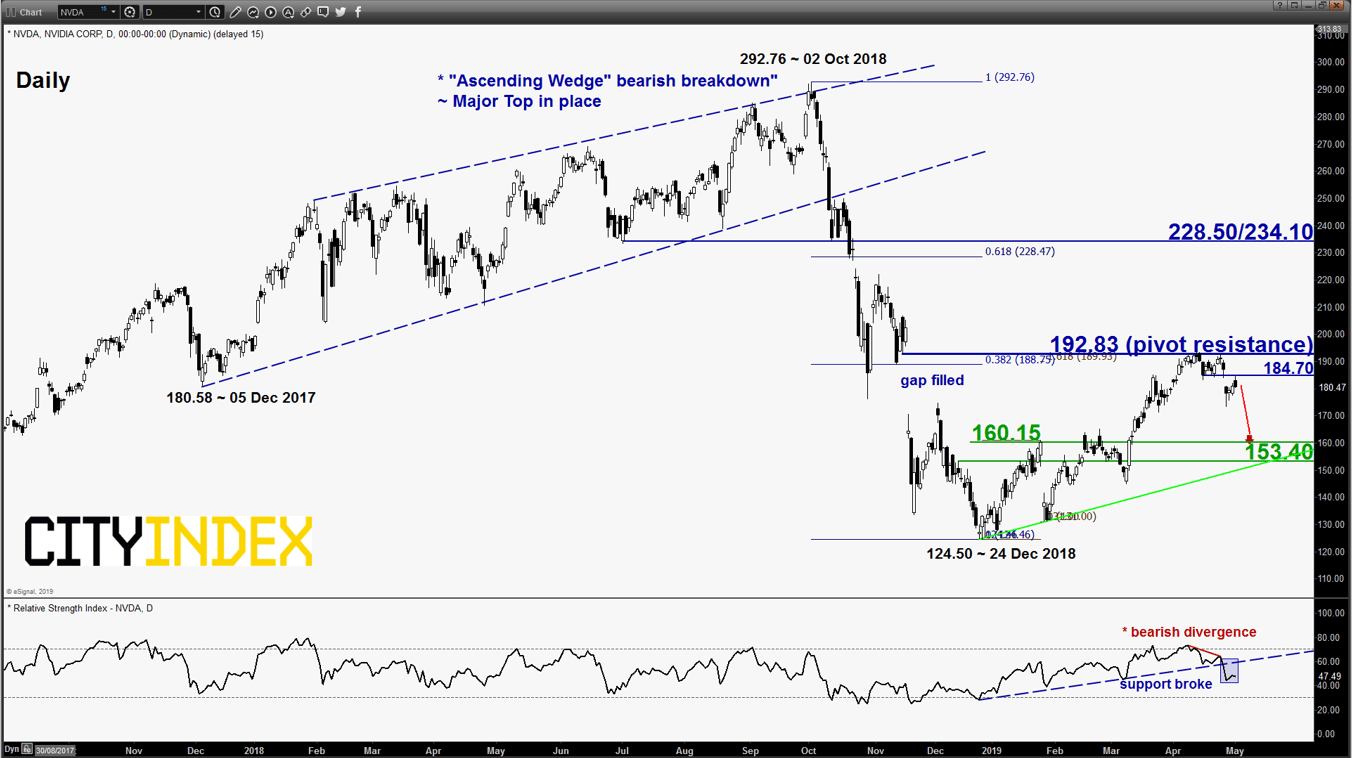
- The 5-month rally of 55% seen the share price of NVIDIA (NVDA), a major graphics processing maker for games and chip maker for mobile computing has stalled at key medium-term resistance of 192.83 on 10 Apr 2019 and reversed down by 10% to print a low of 173.30 on 26 Apr 2019.
- The 192.83 key medium-term resistance is defined b y a Fibonacci retracement/expansion cluster and the gapped down seen on 15/16 Nov 2018 which has been “filled”.
- Medium-term momentum has turned negative as the daily RSI oscillator has broken down below a significant corresponding ascending support in place since 24 Dec 2018 (similar price action swing low that led to the 55% rally) after a prior bearish divergence signal seen at its overbought region.
- The next significant medium-term support to watch rests at the 160.15/153.40 zone which is defined by 50% Fibonacci retracement of the entire up move from 24 Dec 2018 low to 10 Apr 2019 high and the ascending trendline from 24 Dec 2018 low.
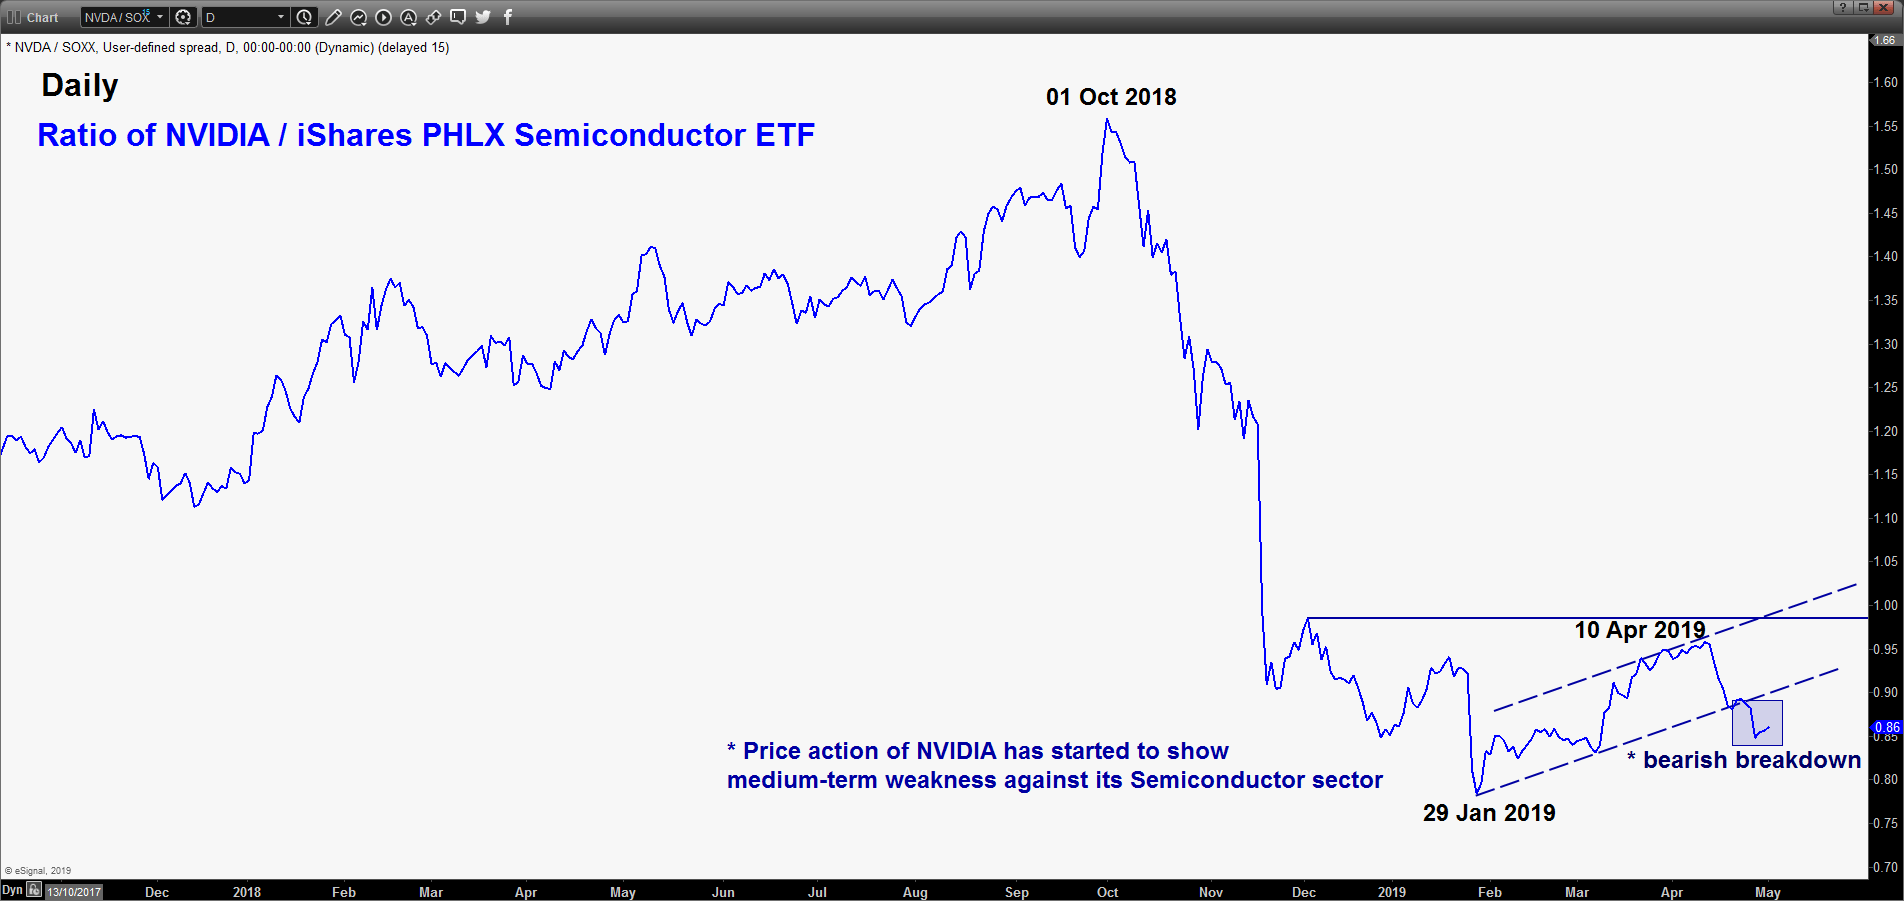
- Relative strength analysis from the ratio of NVDA against its PHLX Semiconductor sector ETF (SOXX) has started to exhibit medium-term weakness/underperformance.
Key Levels (1 to 3 weeks)
Intermediate resistance: 184.70
Pivot (key resistance): 192.83
Support: 160.15/153.40
Next resistance: 228.50/234.10
Conclusion
If the 184.70 key medium-term pivotal resistance is not surpassed, NVDA is likely to see a further potential decline towards the 160.15/153.40 support zone in the first step.
On the other hand, a daily close above 192.83 invalidates the bearish scenario for a further corrective rally to towards the next resistance at 228.50/234.10 (also the 61.8% Fibonacci retracement of the entire down move from 02 Oct 2018 high to 26 Dec 2018 low).
Charts are from eSignal
Latest market news
Today 04:00 PM
Today 01:15 PM
Today 11:30 AM
Today 08:18 AM
Latest Shares market articles
November 2, 2023 01:41 PM
November 1, 2023 01:33 PM
October 31, 2023 01:15 PM
October 31, 2023 10:24 AM