Update Weekly Technical Outlook on Stock Indices At risk of mean reversion rebound
All the stock indices that we have covered have either reached their respective downside targets/supports or trading close to these supports at this juncture as per highlighted in our report published yesterday (click here for a recap).
The updated medium-term outlook (1-3 weeks) of these stock indices are presented below;
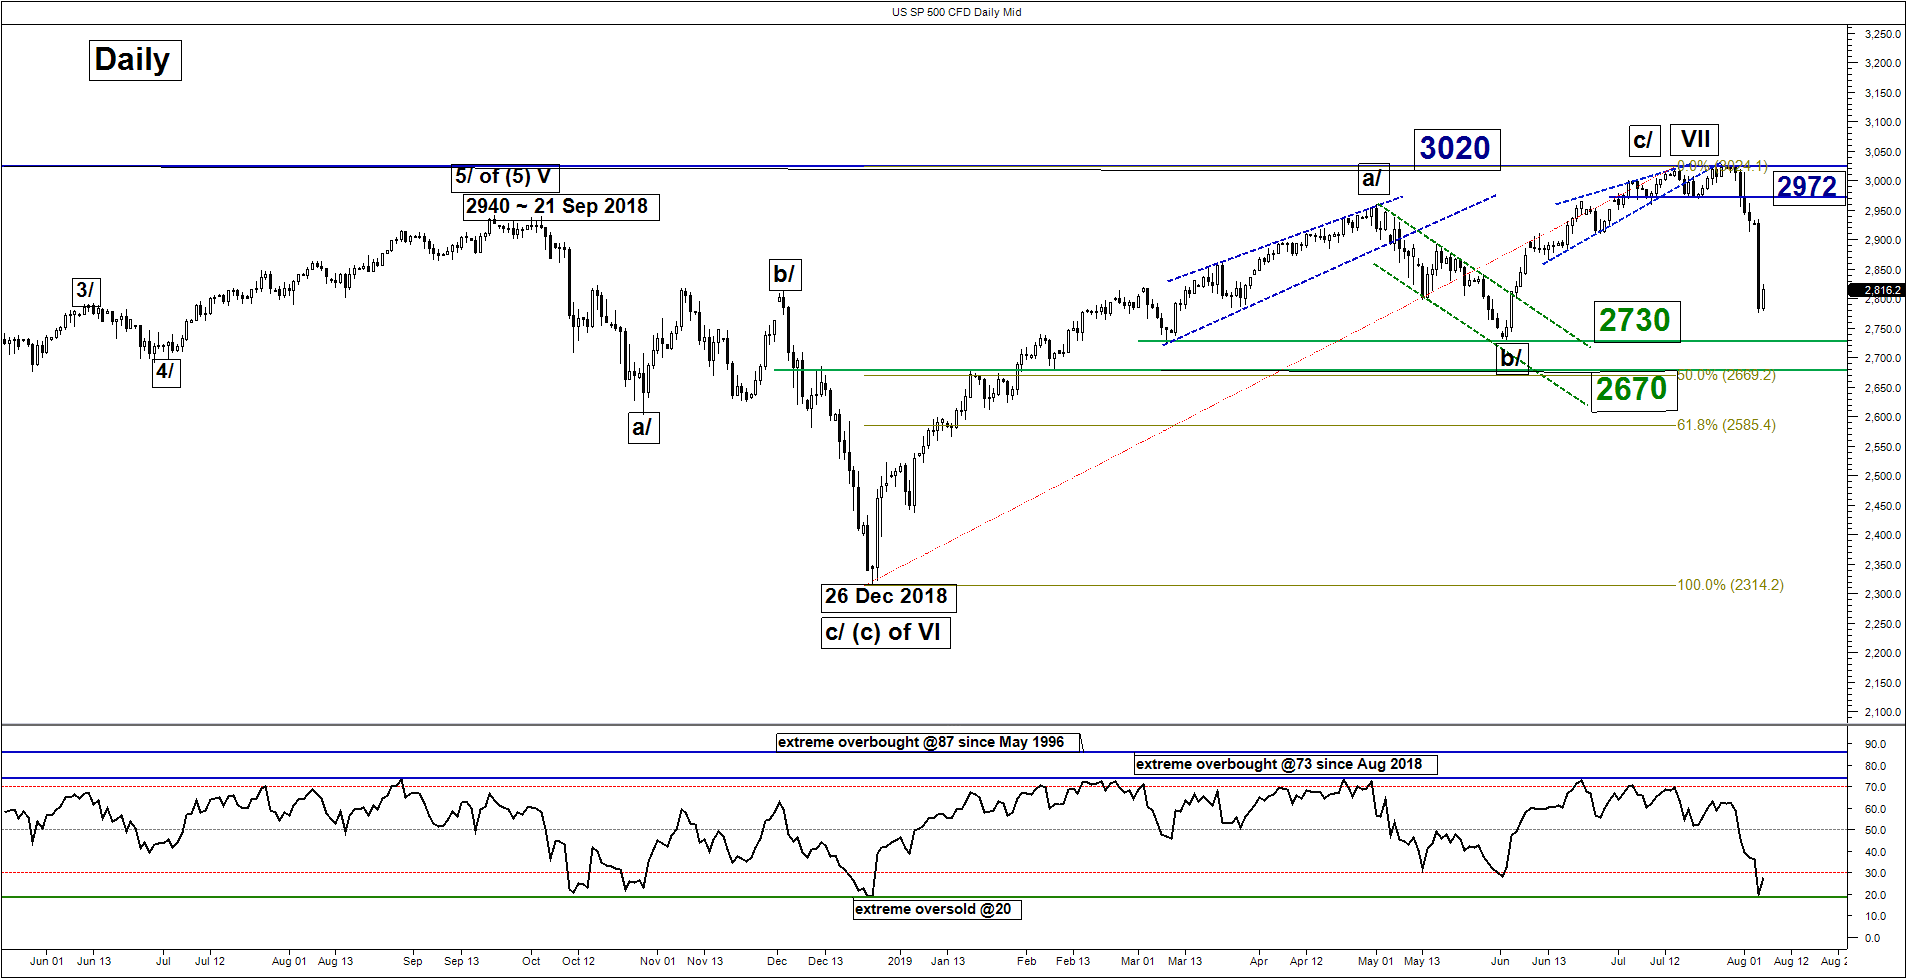
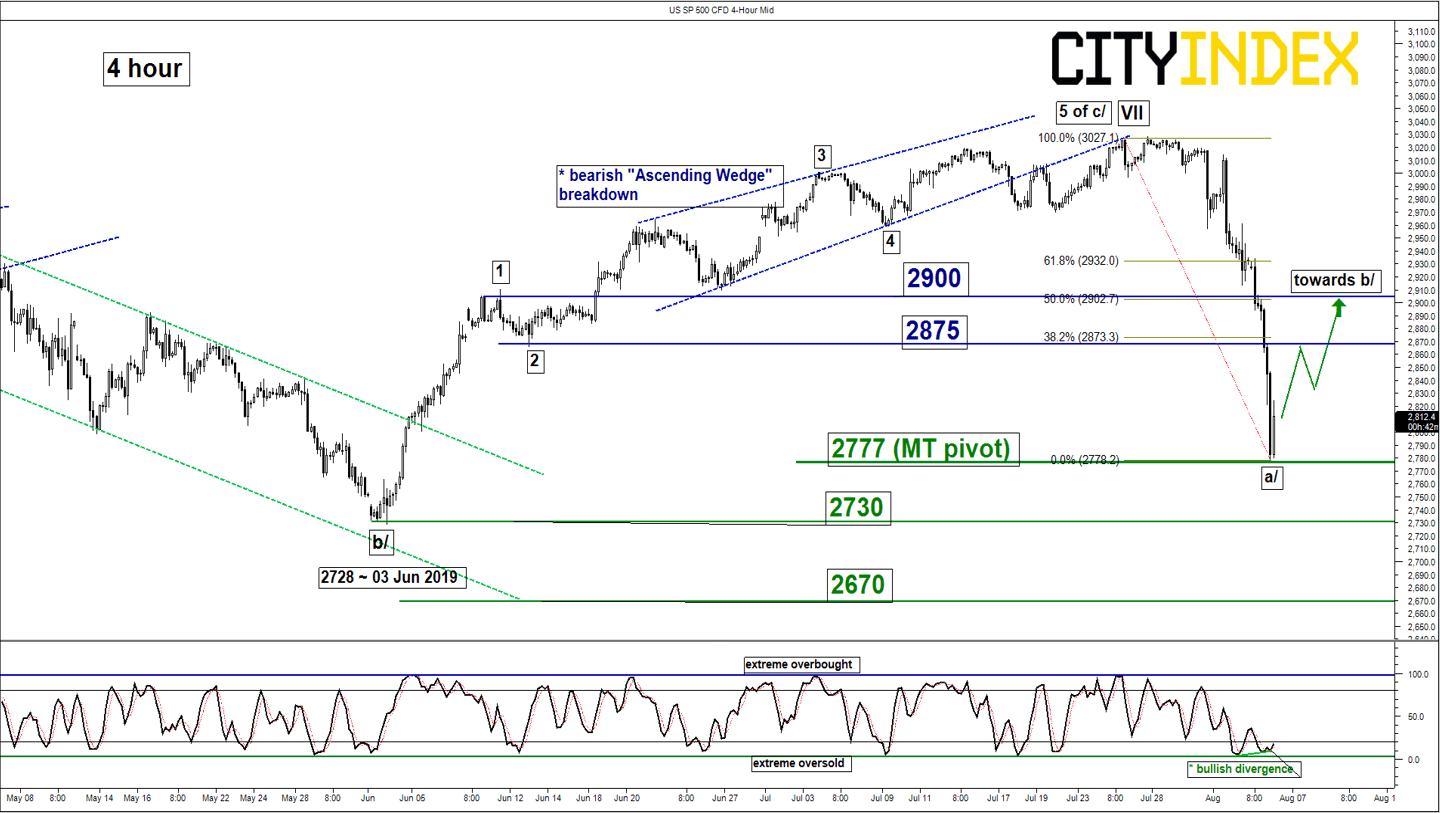
S&P 500 – Mean reversion rebound in progress
click to enlarge charts
Key Levels (1 to 3 weeks)
Pivot (key support): 2777
Resistances: 2875 & 2900
Next supports: 2730 & 2670
Directional Bias
Downside target/support met at 2845 on the SP 500 Index (proxy for the S&P 500 futures). In addition, downside momentum of price action has been overtreated as indicated by the extreme oversold readings seen in the daily RSI and 4-hour Stochastic oscillators. Flip to a bullish bias above 2777 key medium-term pivotal support for a mean reversion rebound to target the intermediate resistances of 2875 & 2900 within a corrective down move sequence still in motion since 25 Jul 2019 all-time high.
On the other hand, a break with a daily close below 2777 invalidates the mean reversion rebound scenario for the continuation of the down move towards 2730 and even 2670 next.
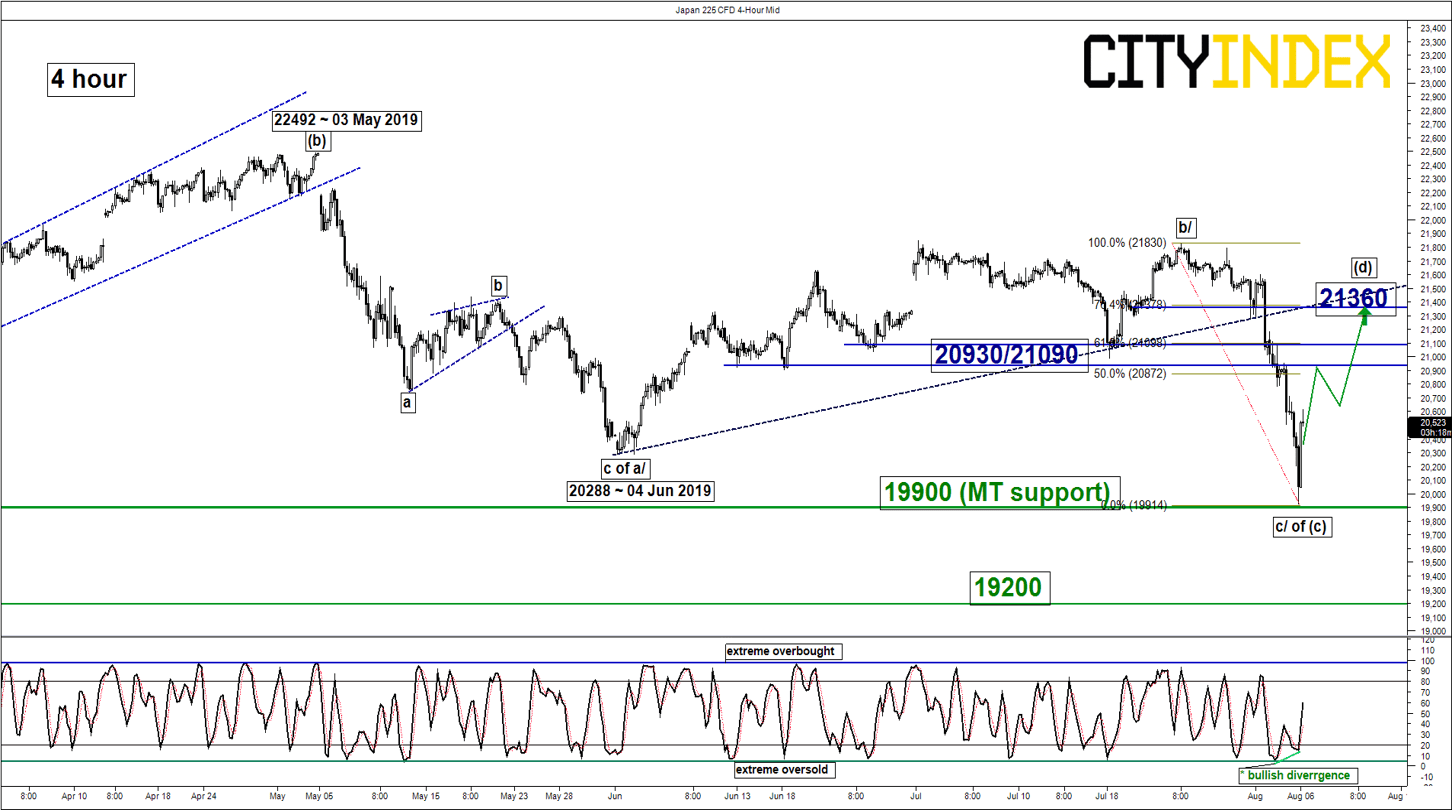
Nikkei 225 – 19900 key support to watch
click to enlarge chart
Key Levels (1 to 3 weeks)
Pivot (key support): 19900
Resistances: 20930/21090 & 21360
Next support: 19200
Directional Bias
Downside target/support almost met at 19655 on the Japan 225 Index (proxy for the Nikkei 225 futures). Flip to a bullish bias above 19900 key medium-term pivotal support for a potential corrective rebound to target the intermediate resistances at 20930/21090 and 21360.
On the other hand, a break with a daily close below 19900 invalidates the corrective rebound scenario for the continuation of the down move towards 19200.
Hang Seng – Rebounding from descending channel support
click to enlarge chart
Key Levels (1 to 3 weeks)
Pivot (key support): 25300
Resistances: 27055 & 27500
Next support: 24500
Directional Bias
Downside target/support met at 25350 on the Hong Kong 50 Index (proxy for Hang Seng Index futures). Flip to a bullish bias above 25300 key medium-term pivotal support for a potential corrective rebound to target the intermediate resistance at 27055 with a maximum limit set at 27500 (61.8% Fibonacci retracement of the steep decline from 19 Jul high to 06 Aug 2019 low).
On the other hand, a break with a daily close below 25300 invalidates the corrective rebound scenario for the continuation of the down move towards 24500 (26 Oct 2018 swing low area).
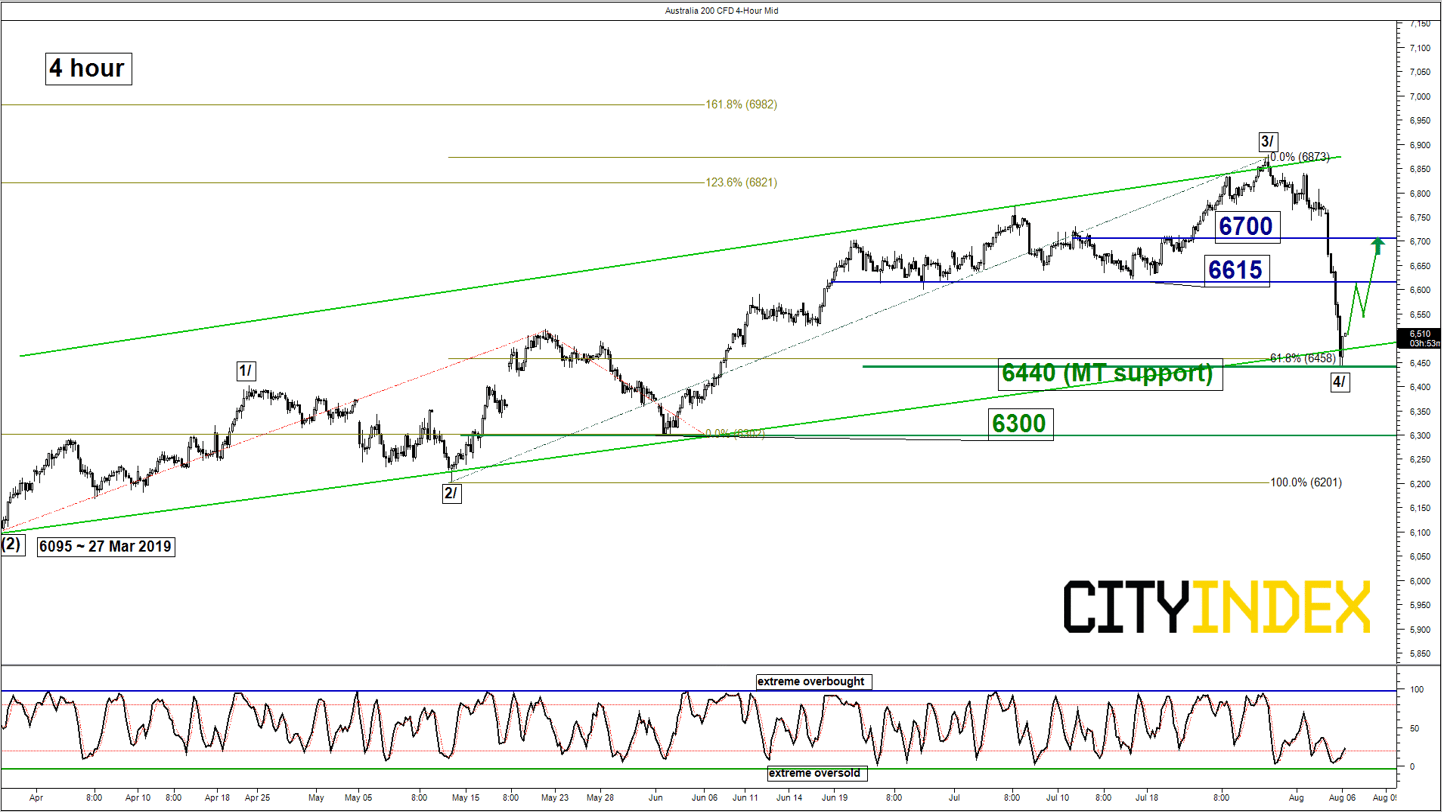
ASX 200 – Rebounding from ascending channel support
click to enlarge chart
Key Levels (1 to 3 weeks)
Pivot (key support): 6440
Resistances: 6615 & 6700
Next support: 6300
Directional Bias
Downside target/support met at 6540 on the Australia 200 Index (proxy for the ASX 200 futures). Flip to a bullish bias above 6440 key medium-term pivotal support for a potential recovery to target the intermediate resistances at 6615 and 6700.
On the other hand, a break with a daily close below 6440 invalidates the recovery scenario for the continuation of the down move towards 6300 in the first step.
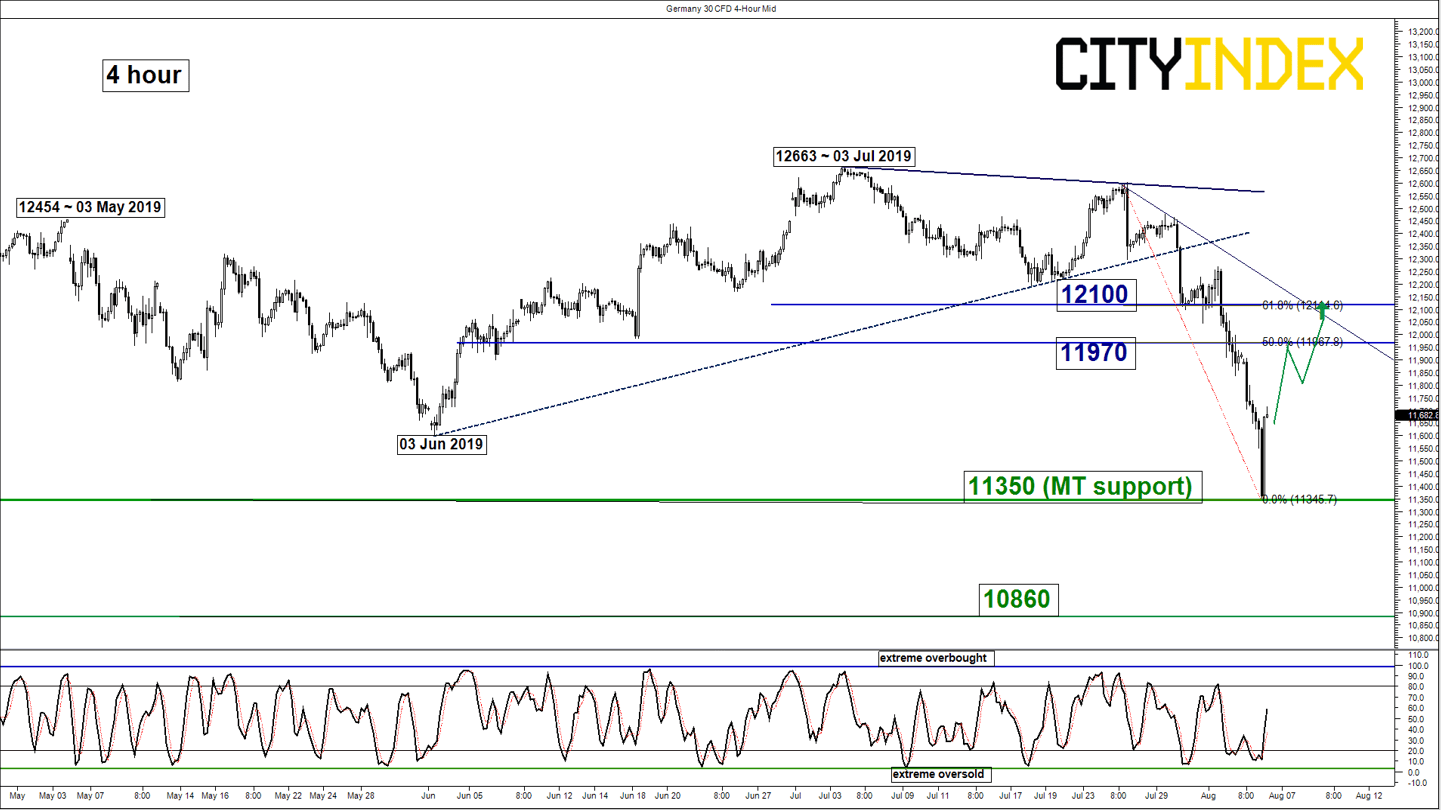
DAX – 11350 key support to watch
click to enlarge chart
Key Levels (1 to 3 weeks)
Pivot (key support): 11350
Resistances: 11970 & 12100
Next support: 10860
Directional Bias
Downside target/support met at 11300 on the Germany 30 Index (proxy for the DAX futures). Flip to a bullish bias above 11350 key medium-term pivotal support for a potential mean reversion rebound towards the intermediate resistances at 11970 and 12100 (also 61.8% Fibonacci retracement of the steep decline from 25 Jul high to 06 Aug 2019 low).
On the other hand, a break with a daily close below 11350 invalidates the recovery scenario for the continuation of the down move towards 10860 (08 Feb 2019 swing low & close to 76.4% Fibonacci retracement of the previous multi-month up move from 26 Dec 2018 low to 03 Jul 2019 high).
Charts are from City Index Advantage TraderPro
StoneX Financial Ltd (trading as “City Index”) is an execution-only service provider. This material, whether or not it states any opinions, is for general information purposes only and it does not take into account your personal circumstances or objectives. This material has been prepared using the thoughts and opinions of the author and these may change. However, City Index does not plan to provide further updates to any material once published and it is not under any obligation to keep this material up to date. This material is short term in nature and may only relate to facts and circumstances existing at a specific time or day. Nothing in this material is (or should be considered to be) financial, investment, legal, tax or other advice and no reliance should be placed on it.
No opinion given in this material constitutes a recommendation by City Index or the author that any particular investment, security, transaction or investment strategy is suitable for any specific person. The material has not been prepared in accordance with legal requirements designed to promote the independence of investment research. Although City Index is not specifically prevented from dealing before providing this material, City Index does not seek to take advantage of the material prior to its dissemination. This material is not intended for distribution to, or use by, any person in any country or jurisdiction where such distribution or use would be contrary to local law or regulation.
For further details see our full non-independent research disclaimer and quarterly summary.
CFDs are complex instruments and come with a high risk of losing money rapidly due to leverage. 69% of retail investor accounts lose money when trading CFDs with this provider. You should consider whether you understand how CFDs work and whether you can afford to take the high risk of losing your money. CFD and Forex Trading are leveraged products and your capital is at risk. They may not be suitable for everyone. Please ensure you fully understand the risks involved by reading our full risk warning.
City Index is a trading name of StoneX Financial Ltd. Head and Registered Office: 1st Floor, Moor House, 120 London Wall, London, EC2Y 5ET. StoneX Financial Ltd is a company registered in England and Wales, number: 05616586. Authorised and regulated by the Financial Conduct Authority. FCA Register Number: 446717.
City Index is a trademark of StoneX Financial Ltd.
The information on this website is not targeted at the general public of any particular country. It is not intended for distribution to residents in any country where such distribution or use would contravene any local law or regulatory requirement.
© City Index 2024