SP500 The Long And Short Of It Cisco Welltower Applied Material
Welltower Inc CFD/DFT: The stock remains in a strong uptrend and is now consolidating just beneath record highs. The 20-day eMA is holding as support and we’re now watching to see it can break out of compression to new highs. Given the strong trend and that it's also had time to consolidate, this could be of interest to momentum traders on the daily and intraday timeframes.
- A break above 92.50 assumes bullish trend continuation. Ideally a break will be seen on higher volume, or traders could wait to see if we see a daily close, or 92.50 is respected as support before committing.
- An open target could be used as a breakout would be new record highs.
- A break below 90.35 signals mean reversion, although the bullish trendline is also nearby to provide potential support.
- A break of the trendline could be taken as a sign a deeper correction could be underway.
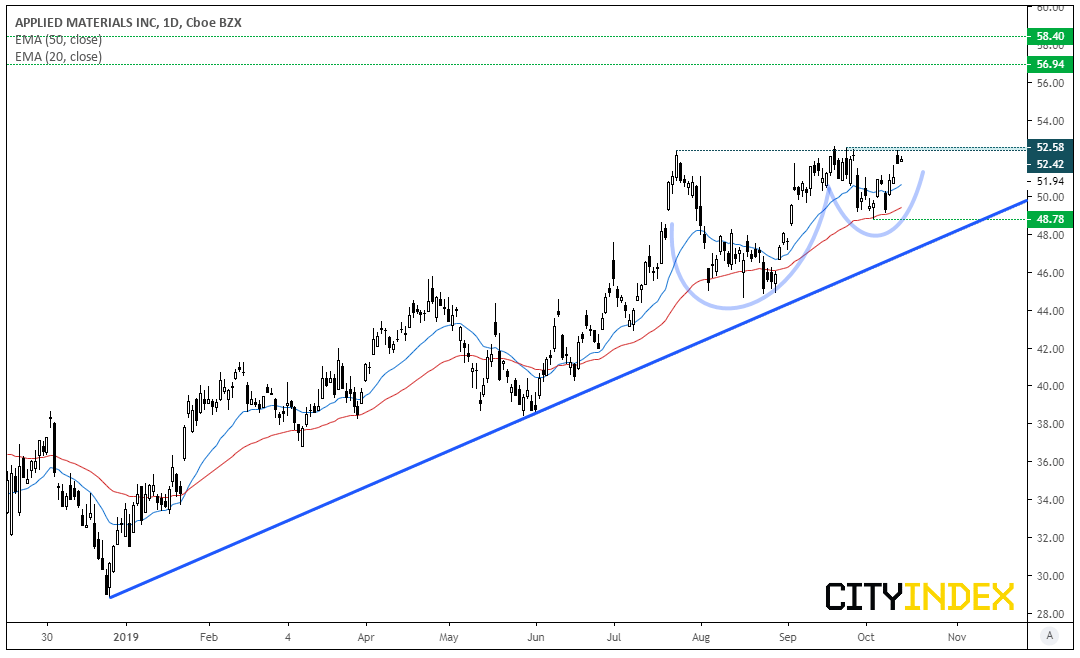
Applied Materials CFD/DFT: The bullish trend is less established than Welltower’s, yet a cup and handle continuation pattern has caught our eye. Prices have found resistance just below 52.60 and the two recent higher lows are what form the cup and handle components. Moreover, the 50-day eMA acted as support ahead of the latest leg higher. Of course, it’s possible resistance could hold for a while long, in which case look for the pattern to morph into a continuation pattern such as an ascending triangle. But ultimately, we’re looking for a breakout above resistance.
- A break above 52.60 assumes bullish trend continuation. If it breaks higher without a retracement prior, then it confirms the cup and handle pattern.
- The bias remains bullish above 48.78. If we see a pullback from the highs, we’d seek a higher low above 48.78 to show bullish pressure continues to build.
- Whilst the pattern projects an initial target around 60, swing highs around 56.94 and 58.40 make viable interim targets.
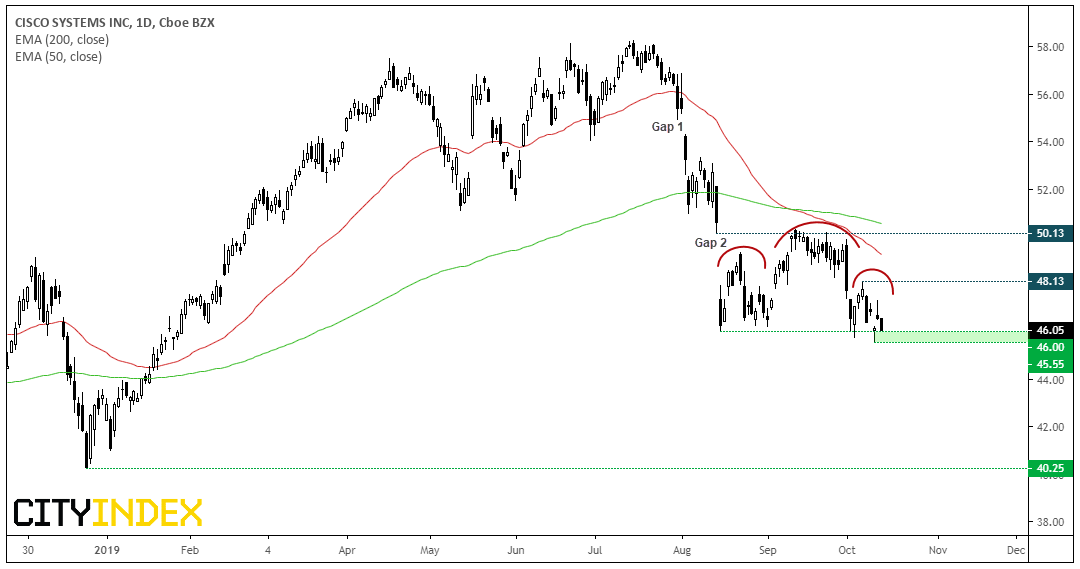
Cisco Systems CFD/DFT: It’s far from perfect as we’re unable to draw an ideal neckline, yet the formation screams head and shoulders top. As the trend is clearly bearish, the H&S is now a continuation pattern which could target the 41-42 area if successful.
The fact we’ve seen two notable gaps lower since the post-Nasdaq bubble highs suggests the downtrend could still be within its infancy. And we especially like how the ‘head’ has closed the gap before turning lower, with the 200 and 50-day eMA’s capping as resistance and providing a death cross (a dramatic name for the faster average closing beneath the longer one).
- The near-term bias remains bearish whilst prices hold below 48.13
- A break below 46 assumes bearish trend continuation
- With the H&S targeting the 41-42 area, traders can use round numbers as interim targets, or simply keep an open target towards the 40.25 low
Price Action Update: It's A Fine Line Between Bullish & Bearish on S&P500 | Apple, Netflix
Apple Inc CFD/DFT: After breaking out of its small correction line, prices reversed yet found support at the lower channel before accelerating high. Going on to close to fresh record highs on Friday, a small bearish hammer has formed to warn of near-term exhaustion. Still, as the trend remains bullish we’ll continue to seek opportunities to buy dips after prices have had a chance to consolidate or correct.
Netflix CFD/DFT: Prices have rebounded a little further than we’d hoped and now closed above the 275.80-282.66 resistance zone. However, the trend structure remains bearish and yesterday’s bearish hammer remains below the 50-day eMA. With earnings due for release tomorrow, we’re keen to see if it can roll over once more in line with the bearish bias or threaten the trend with a break above 305.
Related analysis:
Big U.S. banks fight Fed cuts to grow earnings
Earnings Guidance will be Watched Closely
FTSE Pauses At Resistance | CWK, CTEC, IMB
Stock Indices Weekly Technical Outlook: Bulls Rescued By Verbal Mini Trade Deal
S&P 500 Earnings Season Preview: Risks Abound!
StoneX Financial Ltd (trading as “City Index”) is an execution-only service provider. This material, whether or not it states any opinions, is for general information purposes only and it does not take into account your personal circumstances or objectives. This material has been prepared using the thoughts and opinions of the author and these may change. However, City Index does not plan to provide further updates to any material once published and it is not under any obligation to keep this material up to date. This material is short term in nature and may only relate to facts and circumstances existing at a specific time or day. Nothing in this material is (or should be considered to be) financial, investment, legal, tax or other advice and no reliance should be placed on it.
No opinion given in this material constitutes a recommendation by City Index or the author that any particular investment, security, transaction or investment strategy is suitable for any specific person. The material has not been prepared in accordance with legal requirements designed to promote the independence of investment research. Although City Index is not specifically prevented from dealing before providing this material, City Index does not seek to take advantage of the material prior to its dissemination. This material is not intended for distribution to, or use by, any person in any country or jurisdiction where such distribution or use would be contrary to local law or regulation.
For further details see our full non-independent research disclaimer and quarterly summary.
CFDs are complex instruments and come with a high risk of losing money rapidly due to leverage. 69% of retail investor accounts lose money when trading CFDs with this provider. You should consider whether you understand how CFDs work and whether you can afford to take the high risk of losing your money. CFD and Forex Trading are leveraged products and your capital is at risk. They may not be suitable for everyone. Please ensure you fully understand the risks involved by reading our full risk warning.
City Index is a trading name of StoneX Financial Ltd. Head and Registered Office: 1st Floor, Moor House, 120 London Wall, London, EC2Y 5ET. StoneX Financial Ltd is a company registered in England and Wales, number: 05616586. Authorised and regulated by the Financial Conduct Authority. FCA Register Number: 446717.
City Index is a trademark of StoneX Financial Ltd.
The information on this website is not targeted at the general public of any particular country. It is not intended for distribution to residents in any country where such distribution or use would contravene any local law or regulatory requirement.
© City Index 2024