SP500 Long And Short Of It AMD Apache UTX
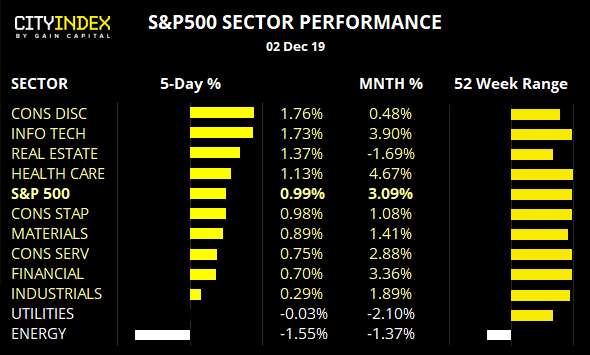
- As my colleague Kelvin Wong noted, there are no clear signs of exhaustion on the S&P500 which sits just off record highs. Whilst Friday was a bearish close, it warns of a minor pullback at best as there is no evidence of a topping pattern. Moreover, the S&P500 E-mini’s are retesting record highs following strong PMI data from China today.
- Info tech remains the dominant sector in 2019, having rallied +41.8% YTD, whilst Consumer Services and Financial sectors take 2nd and 3rd place as 28.4% and 26% respectively.
- Energy remains in the doldrums, having gained a mere 1.7% YTD.
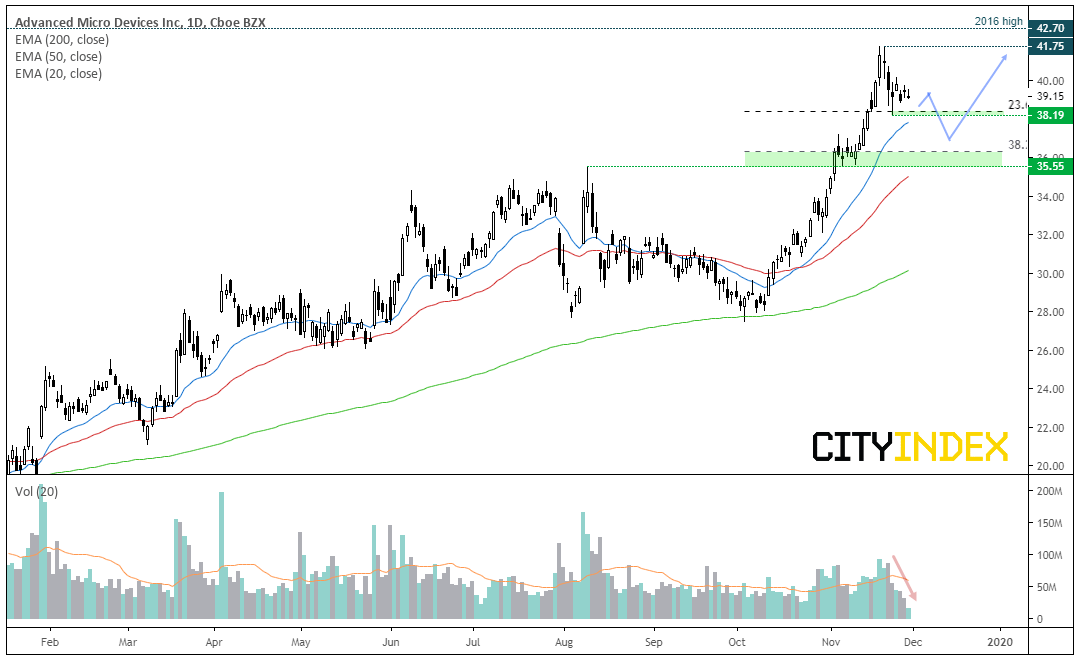
Advanced Micro Device CFD/DFT: A performing stock in a performing sector, AMD has rallied an impressive 112% year to date. Since touching a record high of 41.75 in November, prices have moved lower but on thinner volumes to suggest the move is corrective, so we’re looking out for new level of support to build before it breaks to fresh highs.
- A spinning top doji marks a potential swing low at 38.19, near the 23.6% Fibonacci ratio. If bullish momentum returns above this level, it can be assumed the correction has ended.
- The 35.55 – 36.00 zone may provide better support upon a deeper retracement. If a higher low forms near or above this zone and bullish momentum returns, bulls could look to target the 2019 and 2016 highs.
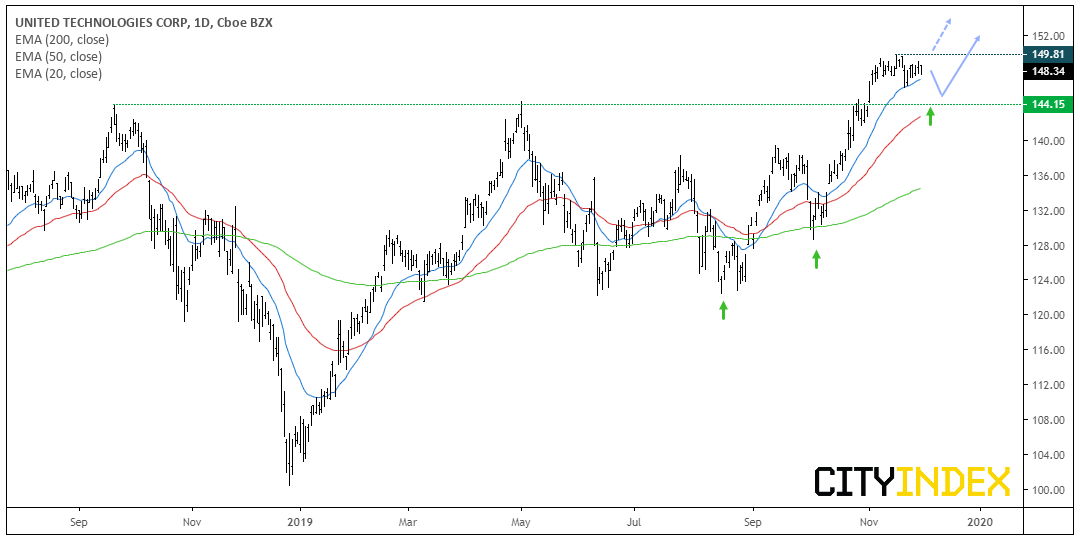
United Technologies CFD/DFT: Prices are consolidating just below record high, and the 20-day eMA is providing support. At the beginning of November we saw a break of key resistance around 144, and the bullish trend from the September low appears to be an impulsive wave. Due to strength of momentum leading into the current consolidation, we expect prices to eventually break higher.
- Bias remains bullish above 144, which means bulls can see dips above this level in case momentum takes it lower initially.
- If momentum takes it higher out of the current consolidation zone, bulls can use an open upside target as we’re back at record highs.
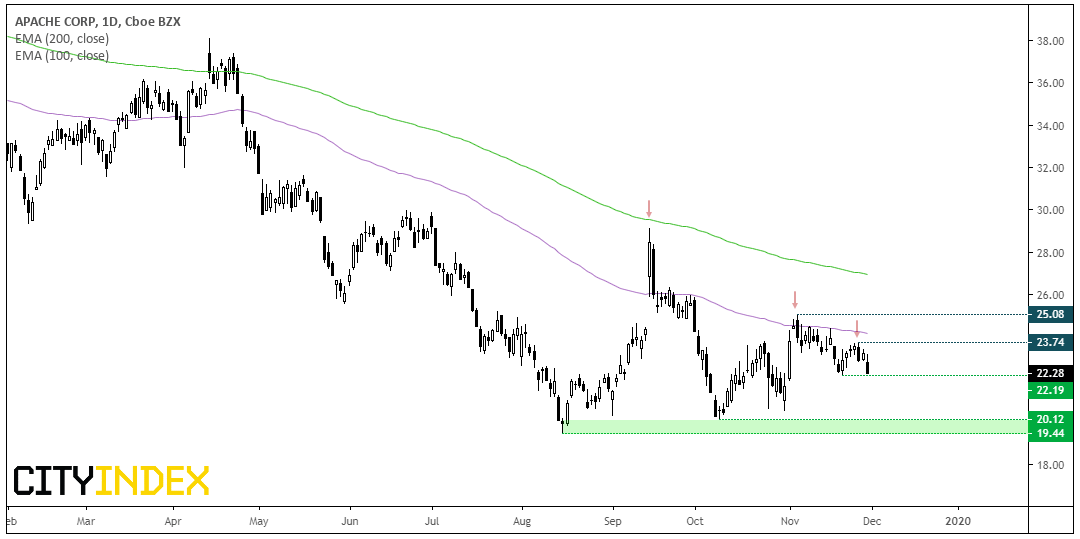
Apache Corp CFD/DFT: The S&P500 Energy index is the worst performing sector over the last 12 months (and the only one to trade lower over this period). At -15.1% YTD, Apache is not the weakest is underperforming relative to the sector although no oversold to the point it could not go lower from here.
A series of lower highs below 38 shows bearish momentum is building and Friday’s bearish candle suggests prices could be headed lower.
- Near-term bias remains bearish below 23.14.
- Bears can wait for a break of 22.00 – 22.19 to confirm a resumption of the downtrend.
- The lows around 20 make viable downside targets. A break beneath here would take prices to their lowest levels since 2001.
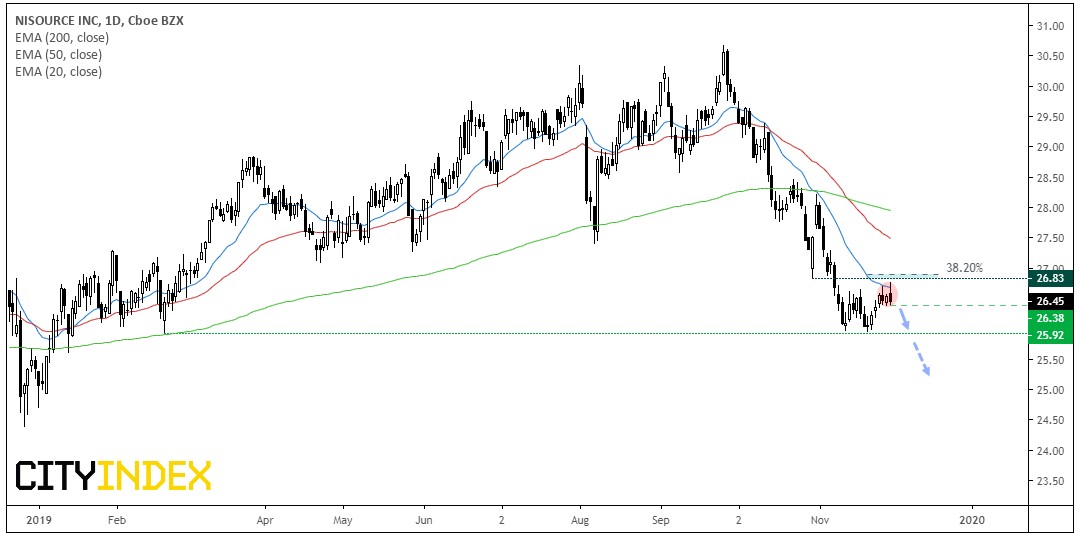
Nisource CFD/DFT: Momentum since the 2019 high has been predominantly bearish, with losses coming quite hard and fast. Support was recently found at the February low around 26, and prices have retraced higher although Friday’s bearish hammer suggests the corrective. That the bearish hammer stalled beneath the 26.38 resistance and 38.2% Fibonacci levels adds further weight to the corrective move nearing its completion.
- Bias remains bearish below 27.
- Bears can either look to ‘pick at the highs’ (fade into minor rallies) below 27 and assumes prices will revisit support around 26.
- Alternatively, wait for a break below 26.38 support before assuming a return to the 26 area.
Price Action Update
- J.P. Morgan Chase CFD/DFT: Trading just off record highs, there are signs of exhaustion with a series of doji’s, hammers and a pinbar. Still, the trend remains bullish 127.42 so bulls could look for potential dips above this key support level to consider longs.
- Cabot Oil & Gas Corp CFD/DFT: T1 was reached around $16 and prices are consolidating near multi-year lows. The bias remains bearish below $17 and for prices to move towards the 14.67 double-top target, although $15 also makes a viable target.
- Autozone CFD/DFT: Resistance around 1190 remains in place and Friday produced a bearish engulfing candle / dark cloud cover reversal at these highs. Ultimately it could either be in a wide, oscillating channel which could be confirmed with a break below 1150 but, if 1150 holds as support and it breaks higher, it can be assumed momentum has realigned with the longer-term bullish trend.
- Verisk Analytics CFD/DFT: It blow past the resistance zone, so has been removed from the short watchlist.
StoneX Financial Ltd (trading as “City Index”) is an execution-only service provider. This material, whether or not it states any opinions, is for general information purposes only and it does not take into account your personal circumstances or objectives. This material has been prepared using the thoughts and opinions of the author and these may change. However, City Index does not plan to provide further updates to any material once published and it is not under any obligation to keep this material up to date. This material is short term in nature and may only relate to facts and circumstances existing at a specific time or day. Nothing in this material is (or should be considered to be) financial, investment, legal, tax or other advice and no reliance should be placed on it.
No opinion given in this material constitutes a recommendation by City Index or the author that any particular investment, security, transaction or investment strategy is suitable for any specific person. The material has not been prepared in accordance with legal requirements designed to promote the independence of investment research. Although City Index is not specifically prevented from dealing before providing this material, City Index does not seek to take advantage of the material prior to its dissemination. This material is not intended for distribution to, or use by, any person in any country or jurisdiction where such distribution or use would be contrary to local law or regulation.
For further details see our full non-independent research disclaimer and quarterly summary.
CFDs are complex instruments and come with a high risk of losing money rapidly due to leverage. 69% of retail investor accounts lose money when trading CFDs with this provider. You should consider whether you understand how CFDs work and whether you can afford to take the high risk of losing your money. CFD and Forex Trading are leveraged products and your capital is at risk. They may not be suitable for everyone. Please ensure you fully understand the risks involved by reading our full risk warning.
City Index is a trading name of StoneX Financial Ltd. Head and Registered Office: 1st Floor, Moor House, 120 London Wall, London, EC2Y 5ET. StoneX Financial Ltd is a company registered in England and Wales, number: 05616586. Authorised and regulated by the Financial Conduct Authority. FCA Register Number: 446717.
City Index is a trademark of StoneX Financial Ltd.
The information on this website is not targeted at the general public of any particular country. It is not intended for distribution to residents in any country where such distribution or use would contravene any local law or regulatory requirement.
© City Index 2024