Market Brief AUD Best Performer With RBA On Hold
View our guide on how to interpret the FX Dashboard
FX Brief:
- RBA held rates at 0.75% as widely expected, although they could still b eon track to cut rates as early as Q1 2020.
- Trump took to Twitter to again tell the Fed they need to lower rates to fend off low inflation, and combat yesterday’s weak ISM manufacturing print. Oh, and the “dollar is very strong relative to others”. Basically, cut the rates.
- Japan’s government are preparing a $120 billion stimulus package to help kick start their lacklustre economy. Whilst it’s expected to be around $120 billion initially, it could rise to $230 billion when private-sector spending is included.
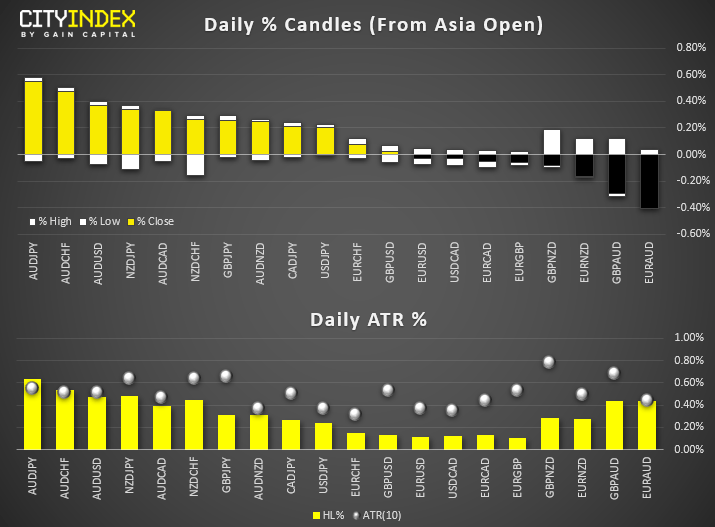
Price Action:
- The Australian dollar is the strongest major after the RBA held rates, and AUD/JPY is the largest gainer of the session. Take note that AUD/CHF and AUD/JPY have exceeded their ATR’s so further upside could become limited in later sessions.
- The USD dollar has pared some of yesterday’s losses but, due to depth of the original declines, suspect these moves to be corrective and pave the way for further new lows this week.
- EUR/USD is eyeing up a break of 1.1093 resistance, although we may not have the data to see it today unless ECB members speaking between 8-9am GMT feel compelled to strengthen the Euro…
- USD/JPY has pulled back towards 109 but bears could look to fade into the 109 – 109.30 area. A break beneath 108.90 assumes further downside.
- AUD/CAD continues to carve out a potential inverted head and shoulders pattern on the daily chart, although we’d need to see a break above 0.9145 to confirm.
- EUR/AUD has broken support around 1.6200 and favours further downside over the near-term (again, keep ECM members on the radar.)
Equity Brief:
- The performances of most key Asian stock markets have fared better versus the U.S. benchmark stock indices where they have recorded losses between -0.90% to -1.10% except for Australia’s ASX 200.
- U.S. President Trump has upped the ante again on U.S. “hostile” global trade policy where the U.S. administration has reinstated steel tariffs on Brazil and Argentina imports and proposed new levies on France.
- The closure of the Phase One U.S-China trade deal has become more complicated with the recent support from U.S. towards the Hong Kong’s anti-government protesters. China has hinted more retaliation measures via state media that the Chinese government will soon publish a list of “unreliable entities” that can lead to sanctions against U.S. companies from disputes over human rights in Hong Kong and Xinjiang.
- Australia’s ASX 200 is the worst performer so far with a decline of -2.20%, the worst intraday loss in 9 days since 20 Nov 2019 after a fresh all-time high of 6893 printed on 29 Nov 2019. Leading the loss are Technology and Consumer Non-Cyclicals sectors where both have tumbled by -3.49% and -3.40% respectively.
- The S&P 500 E-Mini futures has staged a modest recovery of 0.20% in today’s Asian session to trade close to its current intraday high of 3121.
Price Acton (derived from CFD indices):
- Japan 225: Yesterday’s slide from 02 Dec Asian session high of 23596 has managed to find support at 23070 which is the lower boundary of the ascending channel in place since 26 Aug 2019 low. In today’s Asian session, the Index has staged a push up, backed above 23300; the former minor swing low of 26 Nov/29 Nov 2019. Overall, no clear signs of a bearish breakdown yet.
- Hong Kong 50: The Index has dropped and reached the 26200 support; the lower boundary of the ascending range configuration in place since 15 Aug 2019 low. Right now, as long as there is no hourly close below 26200, the Index may see a minor rebound towards the 26600/740 intermediate resistance in first step.
- Australia 200: Reintegrated below the 6780; the former range resistance from 20 Sep 2019 high which indicates the last week’s up move was a failure bullish breakout. Right now, at risk of further potential downside to retest the range support of 6630.
- Germany 30: Declined by -1.9%, the worst daily loss since 02 Oct 2019 and broke below the recent 21 Nov swing low of 13050. At risk of further downside towards the next near-term support at 12800 (31 Oct 2019 minor swing low & 38.2% Fibonacci retracement of the up move from 03 Oct low to 19 Nov 2019 low).
- US SP 500: The sell-off of 1.5% from yesterday’s Asia session all-time high of 3158 has managed to find support at 3110 (the gapped up from 22/25 Nov 2019 & the lower boundary of the ascending channel from 03 Oct 2019 low). Bulls need to clear above 3140 (former minor swing low of 30 Nov & 61.8% Fibonacci retracement of yesterday’s slide) to increase the odds for a continuation of the impulsive up move sequence.
Economic Calendar
Matt Simpson and Kelvin Wong both contributed to this article
Data from Refinitiv. Index names may not reflect tradable instruments and not all markets are available in all regions.StoneX Financial Ltd (trading as “City Index”) is an execution-only service provider. This material, whether or not it states any opinions, is for general information purposes only and it does not take into account your personal circumstances or objectives. This material has been prepared using the thoughts and opinions of the author and these may change. However, City Index does not plan to provide further updates to any material once published and it is not under any obligation to keep this material up to date. This material is short term in nature and may only relate to facts and circumstances existing at a specific time or day. Nothing in this material is (or should be considered to be) financial, investment, legal, tax or other advice and no reliance should be placed on it.
No opinion given in this material constitutes a recommendation by City Index or the author that any particular investment, security, transaction or investment strategy is suitable for any specific person. The material has not been prepared in accordance with legal requirements designed to promote the independence of investment research. Although City Index is not specifically prevented from dealing before providing this material, City Index does not seek to take advantage of the material prior to its dissemination. This material is not intended for distribution to, or use by, any person in any country or jurisdiction where such distribution or use would be contrary to local law or regulation.
For further details see our full non-independent research disclaimer and quarterly summary.
CFDs are complex instruments and come with a high risk of losing money rapidly due to leverage. 69% of retail investor accounts lose money when trading CFDs with this provider. You should consider whether you understand how CFDs work and whether you can afford to take the high risk of losing your money. CFD and Forex Trading are leveraged products and your capital is at risk. They may not be suitable for everyone. Please ensure you fully understand the risks involved by reading our full risk warning.
City Index is a trading name of StoneX Financial Ltd. Head and Registered Office: 1st Floor, Moor House, 120 London Wall, London, EC2Y 5ET. StoneX Financial Ltd is a company registered in England and Wales, number: 05616586. Authorised and regulated by the Financial Conduct Authority. FCA Register Number: 446717.
City Index is a trademark of StoneX Financial Ltd.
The information on this website is not targeted at the general public of any particular country. It is not intended for distribution to residents in any country where such distribution or use would contravene any local law or regulatory requirement.
© City Index 2024