Market Brief A Relief Rally Takes Shape
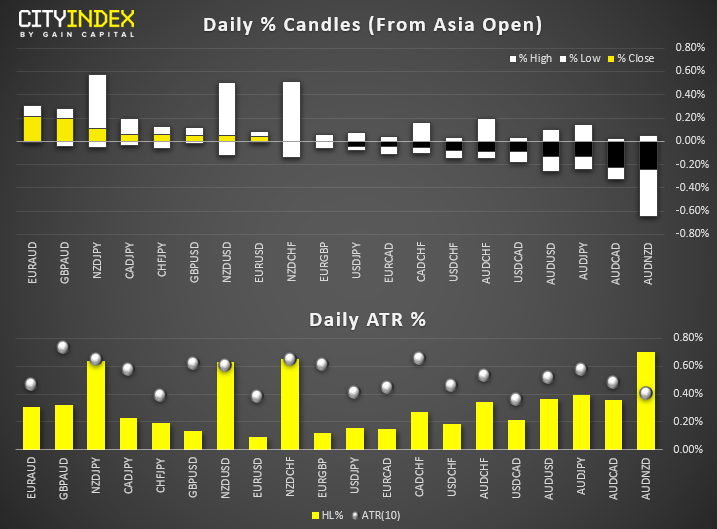
View our guide on how to interpret the FX Dashboard
FX Brief:
- Australian retail sales went nowhere in October. A big fat 0%. Nil. Exports also slumped to -5% versus +3% expected and private house approvals also fell -7%. Considering yesterday’s weak GDP, it’s not a great end to the year data-wise after RBA held a relatively optimistic view in Tuesday’s statement.
- Japan officially launched their economic stimulus package, which is expected to boost GDP by 1.4% according to ‘sources’ from the government. If growth is to remain as elusive as CPI, which has missed target for several years now, let’s not hold our breath. Chances are BOJ will go further into negative rates net year.
- RBNZ Governor Orr signalled that rates are on hold in February. Given the slew of better-than expected economic data and fiscal stimulus unveiled by the government, upside potential for NZD pairs remains favourable as we enter 2020.
Price Action:
- DXY remains under pressure, although yesterday’s low found support at the monthly S1 pivot yesterday, and today’s action is finding support around the 200-day eMA. So perhaps the downside pressure are easing off, ahead of tomorrow’s NFP report. (Unless today’s OPEC meeting says otherwise).
- EUR/USD printed a prominent bearish pinbar and closed below 1.1100 to warn of a bull-trap. Near-term bias remains bearish below 1.1100.
- USD/CAD sits precariously on 1.3215 support ahead of today’s OPEC meeting. Judging from the bearish momentum which slammed prices down here, path of least resistance appears to be lower.
- GBP/USD is sitting pretty at its 7-month high, after breaking out of its inverted head and shoulders pattern yesterday. Whilst the pattern projects a target around 1.3200, we’d prefer to see at least a minor pullback and target 1.3177 resistance first. Bias remains bullish above 1.3000.
Equity Brief:
- A relief rebound has taken shaped in key Asian stock markets today after two session of consecutive losses. The catalyst for the rebound has been another “optimistic” trade related headline as per reported by Bloomberg in yesterday’s European session that stated U.S and China are getting closer to a deal that would avoid additional tariffs to be implemented on 15 Dec. In addition, U.S. President has been quoted saying that trade discussions with China are going very well.
- In the short-term, trade related headlines will be the main driver that determine the intraday swings until more clarity can be determine on the details of the Phase One trade deal.
- One of the best performers is from Japan’s Nikkei 255 which has recorded a gain of 0.68% so far that has been reinforced by the Japanese government’s latest fiscal stimulus plan amounting to 13 trillion yen to support stalling growth.
Price Acton (derived from CFD indices):
- Japan 225: Broke above the minor descending trendline from 02 Dec 2019 high and transited back into a minor churning phase within a medium-term sideways range configuration in place since 07 Nov 2019 with its range resistance at 23650. Short-term supports now rest at 23150 follow by 22980 next (yesterday’s swing low area).
- Hong Kong 50: Minor downtrend remains intact with key short-term resistance at 26300. A broke below 25950 (yesterday’s low) reinforces a further down move to test the next near-term support at 25660/500 (28 Sep/10 Oct 2019 swing low.
- Australia 200: Minor mean reversion rebound in progress with key short-term support now at 6630 (former 21 Nov 2019 minor swing low) that has been broken to the upside. Next intermediate resistance stands at6740/6780 (50%/61.8% retracement of the recent decline from 29 Nov high to 03 Dec 2019 low).
- Germany 30: Continued to churn within a medium-term sideways range configuration in place since 19 Nov 2019 with its range resistance at 13350. Near-term supports to watch will be at 13070 and 12980 (02/03 Nov 2019 swing low areas).
- US SP 500: Yesterday’s rebound from the 3070 low of 03 Dec has stalled at the 61.8% Fibonacci retracement of the recent decline from 02 Dec high to 03 Dec 2019 low and the 3122 minor swing high area of 02 Dec, European session. A break below 3090 reinserts the bearish tone while a clearance above 3122 see a further push up to retest the all-time high area at 3155.
Matt Simpson and Kelvin Wong both contributed to this article
Data from Refinitiv. Index names may not reflect tradable instruments and not all markets are available in all regions.StoneX Financial Ltd (trading as “City Index”) is an execution-only service provider. This material, whether or not it states any opinions, is for general information purposes only and it does not take into account your personal circumstances or objectives. This material has been prepared using the thoughts and opinions of the author and these may change. However, City Index does not plan to provide further updates to any material once published and it is not under any obligation to keep this material up to date. This material is short term in nature and may only relate to facts and circumstances existing at a specific time or day. Nothing in this material is (or should be considered to be) financial, investment, legal, tax or other advice and no reliance should be placed on it.
No opinion given in this material constitutes a recommendation by City Index or the author that any particular investment, security, transaction or investment strategy is suitable for any specific person. The material has not been prepared in accordance with legal requirements designed to promote the independence of investment research. Although City Index is not specifically prevented from dealing before providing this material, City Index does not seek to take advantage of the material prior to its dissemination. This material is not intended for distribution to, or use by, any person in any country or jurisdiction where such distribution or use would be contrary to local law or regulation.
For further details see our full non-independent research disclaimer and quarterly summary.
CFDs are complex instruments and come with a high risk of losing money rapidly due to leverage. 69% of retail investor accounts lose money when trading CFDs with this provider. You should consider whether you understand how CFDs work and whether you can afford to take the high risk of losing your money. CFD and Forex Trading are leveraged products and your capital is at risk. They may not be suitable for everyone. Please ensure you fully understand the risks involved by reading our full risk warning.
City Index is a trading name of StoneX Financial Ltd. Head and Registered Office: 1st Floor, Moor House, 120 London Wall, London, EC2Y 5ET. StoneX Financial Ltd is a company registered in England and Wales, number: 05616586. Authorised and regulated by the Financial Conduct Authority. FCA Register Number: 446717.
City Index is a trademark of StoneX Financial Ltd.
The information on this website is not targeted at the general public of any particular country. It is not intended for distribution to residents in any country where such distribution or use would contravene any local law or regulatory requirement.
© City Index 2024