Index Pairs Matrix Ratio Performance At A Glance
Risk appetite has made a comeback just as we head into the end of Q3. With indices, yields and copper rallying, the oppressive forces Trump’s trade war has held over markets has been lifted, allowing markets to rebound like a jack in the box. There’s still no guarantee these talks will lead to anything, and there’s certainly a case to be made that China has tactically pushed talks into October to help markets rally through to China’s 70th anniversary on October 1st. But right now, who cares? It has lifted a bad spell and allows markets to cover shorts, regroup and refocus their energies.
With Indices having broken out of their ranges, we’re looking at the relative performance of popular indices via ratio analysis. Whilst it can be used as an intermarket tool (and help sort out the strong from the weak) it can also be used for a pairs trade (where a trader goes long on one market and short another, in order to profit from the ratio and hedge out market risk).
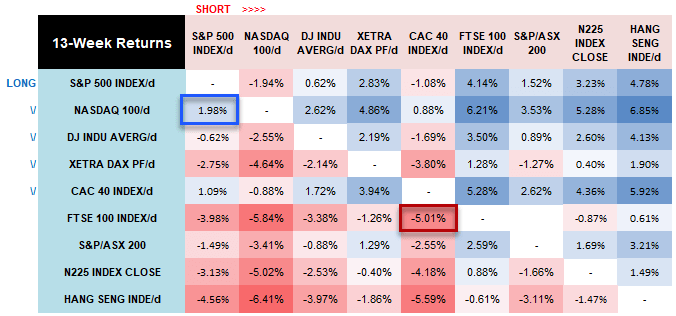
Here we have a matrix*, which shows 13-week % returns of index ratios. For example, we can see that Nasdaq/S&P500 ratio has increased by around 1.9% over the past 13 weeks and the FTSE/CAC ratio has fallen by 5%. Whilst raw percentage returns don’t account for what has happened in between the 13-week points, the matrix quickly shows the relative performance of 64 tradable ‘pairs’ and makes a good starting point before opening a chart.
We can see the Nasdaq has been a strong contender against its peers the past rolling quarter, so this will remain on the bullish watchlist. Conversely, the Hang Seng has underperformed against its peers, so Nasdaq/Hang Seng could be a ratio to watch. Here are a couple of ideas generated from the table.
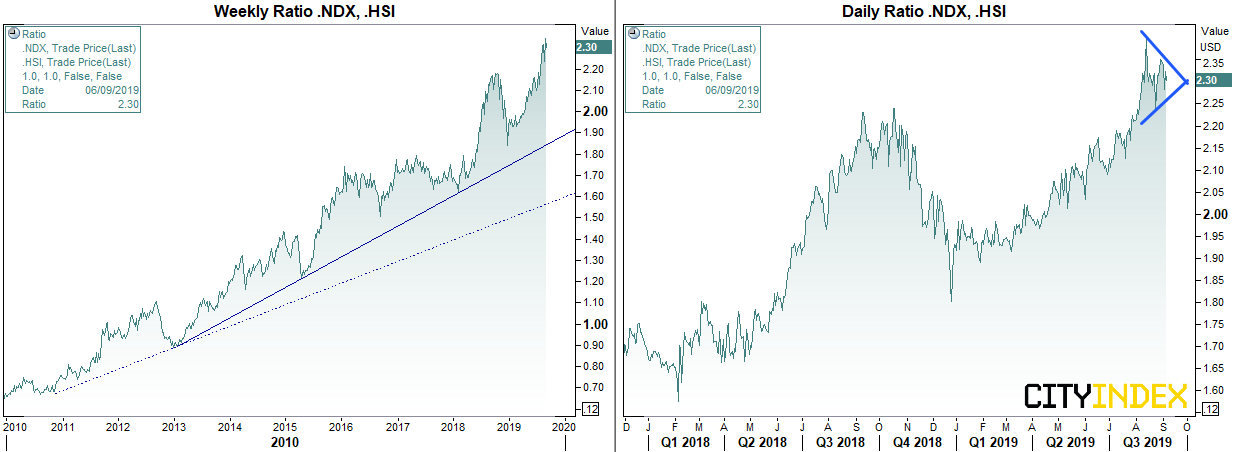
Long Nasdaq / Short Hang Seng
The Nasdaq/Hang Seng ratio is in a multi-year uptrend and accelerating away from its bullish trendline. Whilst it may be approaching a level of over-extension on the weekly chart, there’s no obvious signs of the top just yet. The daily chart is also in a strong uptrend and prices are coiling around their highs in a potential symmetrical triangle pattern. If prices are to break higher, bullish continuation is assumed. Whereas a notable break lower could suggest a correction is underway, or perhaps the beginning of a top. For now, the bias is for a bullish breakout.
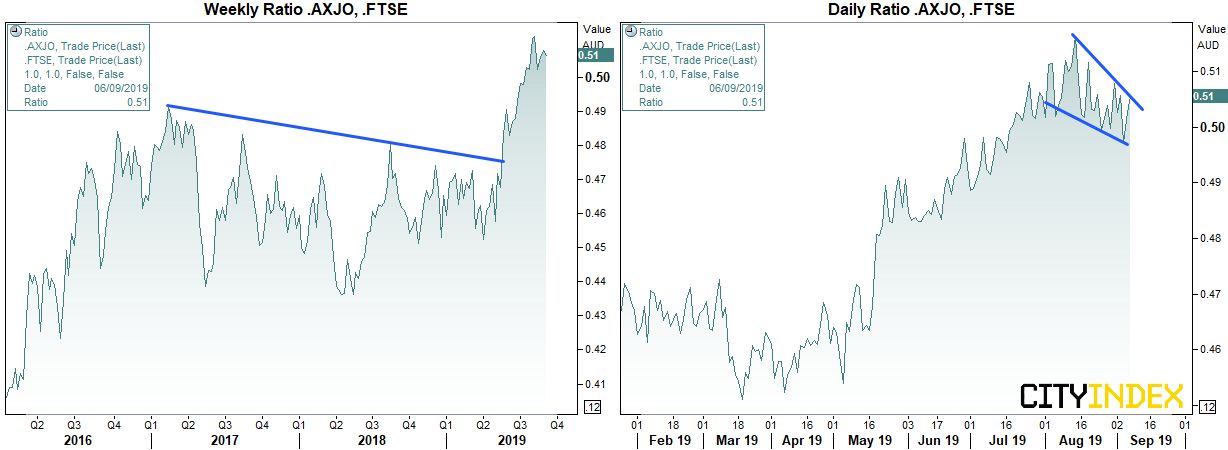
Long ASX200 / Short FTSE100
The weekly chart is in a strong upwards move, after breaking above its correction line in May. On the daily chart, there’s a potential bull-flag (also reminiscent of a bullish wedge, but a potential continuation pattern none the less). A break of the retracement line could signal the ratio is ready to continue its strong uptrend.
* Please note, the individual markets within the ratio charts are in their base currency. This is something to consider if trading them via CFD’s, as currency risk could be introduced. Under this scenario, one may want to consider hedging with an FX position, depending on which pair they trade and what currency their account is denominated in.
Related analysis:
Bulls run free as the Four Horsemen retreat
Trade Talks Are Back, Indices Rise To The Occasion | SPX, DAX
StoneX Financial Ltd (trading as “City Index”) is an execution-only service provider. This material, whether or not it states any opinions, is for general information purposes only and it does not take into account your personal circumstances or objectives. This material has been prepared using the thoughts and opinions of the author and these may change. However, City Index does not plan to provide further updates to any material once published and it is not under any obligation to keep this material up to date. This material is short term in nature and may only relate to facts and circumstances existing at a specific time or day. Nothing in this material is (or should be considered to be) financial, investment, legal, tax or other advice and no reliance should be placed on it.
No opinion given in this material constitutes a recommendation by City Index or the author that any particular investment, security, transaction or investment strategy is suitable for any specific person. The material has not been prepared in accordance with legal requirements designed to promote the independence of investment research. Although City Index is not specifically prevented from dealing before providing this material, City Index does not seek to take advantage of the material prior to its dissemination. This material is not intended for distribution to, or use by, any person in any country or jurisdiction where such distribution or use would be contrary to local law or regulation.
For further details see our full non-independent research disclaimer and quarterly summary.
CFDs are complex instruments and come with a high risk of losing money rapidly due to leverage. 69% of retail investor accounts lose money when trading CFDs with this provider. You should consider whether you understand how CFDs work and whether you can afford to take the high risk of losing your money. CFD and Forex Trading are leveraged products and your capital is at risk. They may not be suitable for everyone. Please ensure you fully understand the risks involved by reading our full risk warning.
City Index is a trading name of StoneX Financial Ltd. Head and Registered Office: 1st Floor, Moor House, 120 London Wall, London, EC2Y 5ET. StoneX Financial Ltd is a company registered in England and Wales, number: 05616586. Authorised and regulated by the Financial Conduct Authority. FCA Register Number: 446717.
City Index is a trademark of StoneX Financial Ltd.
The information on this website is not targeted at the general public of any particular country. It is not intended for distribution to residents in any country where such distribution or use would contravene any local law or regulatory requirement.
© City Index 2024