Hang Seng Index underperformance sets sight on a mean reversion rebound
Short-term technical outlook on Hang Seng Index/Hong Kong 50
click to enlarge charts
Key Levels (1 to 3 days)
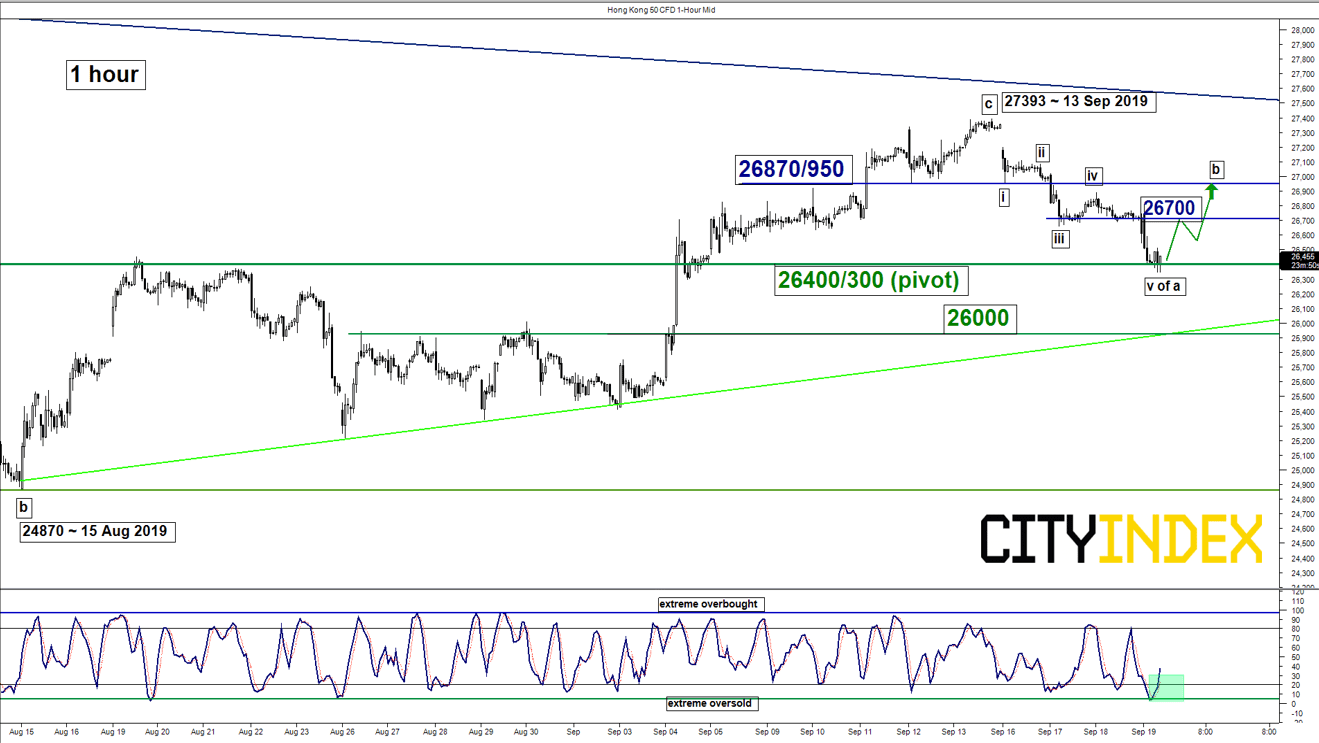
Pivot (key support): 26400/300
Resistances: 26700 & 26870/950
Next support: 26000
Directional Bias (1 to 3 weeks)
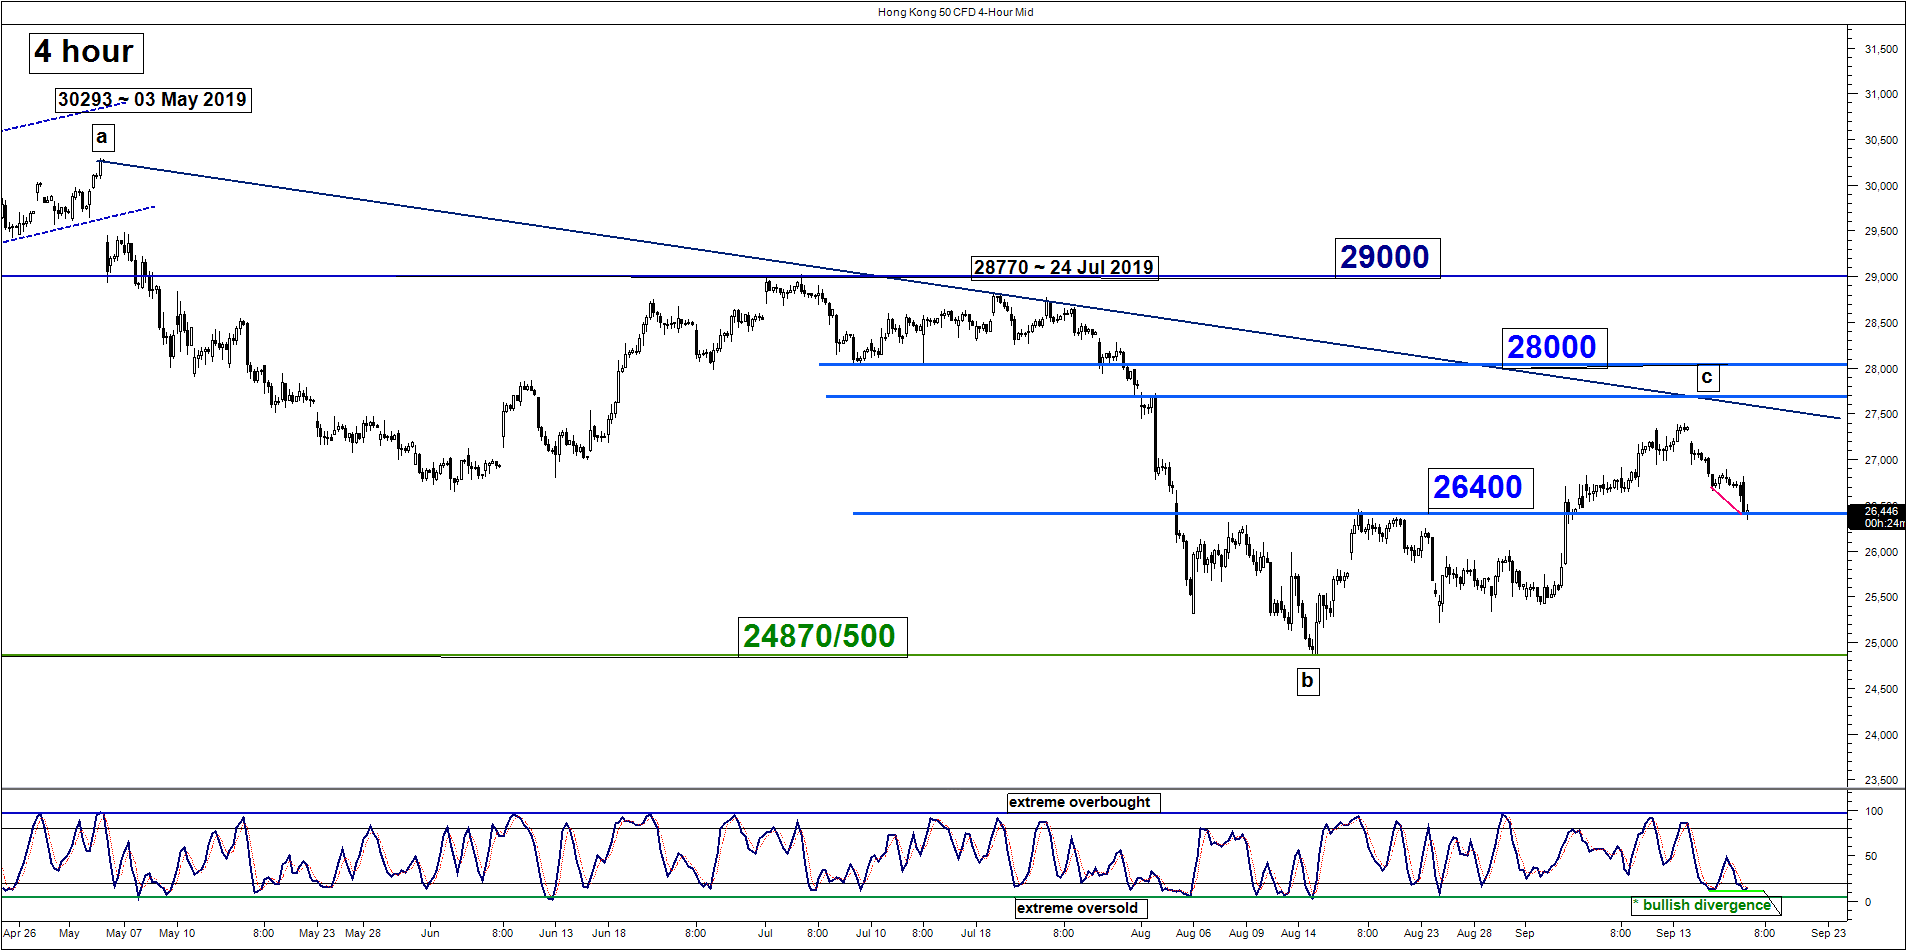
Since the start of this week, the Hong Kong 50 Index (proxy for Hang Seng Index futures) has underperformed the rest of its peers (S&P 500, Nikkei 225, ASX 200 & DAX), it has staged a decline of -3.8% from its 13 Sep 2019 swing high to print a current intraday low of 26348 as seen in today, 19 Sep Asian.
Interestingly, today’s current intraday low of 26348 confluences with the predefined medium-term neutrality range support of 26400 as per highlighted in our weekly technical outlook earlier on this Mon (click here for a recap).
Short-term elements have turned positive where the Index is likely to stage a minor reversion rebound (1-3 days) towards the next intermediate resistances at 26700 and 26870/950.
On the other hand, failure to hold at 26400/300 pivotal support invalidates the mean reversion rebound scenario for an extension of the slide towards the next support at 26000 (the former swing high areas of 26 Aug/30 Aug 2019 & the ascending support from 15 Aug 2019 low).
Key elements
- Elliot Wave/fractal analysis suggests that the Index has traced out a minor degree 5-wave downleg sequence (i, ii, iii, iv & v) from 13 Sep 2019 high of 27393 with the ending 5th wave target at 26300 (0.764 Fibonacci projection of the recent decline from 13 Sep high to 17 Sep low; length of wave iii projected to 19 Sep 2019 high, the high of wave iv). The projected 5th wave target of 26300 confluences with the medium-term range support of 26400 which increases the probability of a rebound at this juncture.
- Momentum analysis also advocates for a rebound scenario where the 4-hour Stochastic oscillator has traced out a bullish divergence signal at its oversold region and the 1-hour Stochastic oscillator has just exited from its oversold region. These observations suggest that the recent downside momentum has been “overstretched”.
- The significant intermediate resistance stands at 26870/950 with is defined by the former minor congestion area of 12 Sep/16 Sep 2019 and the 50% Fibonacci retracement of the recent decline from 13 Sep to today, 19 Sep 2019 intraday low.
Charts are from City Index Advantage TraderPro
StoneX Financial Ltd (trading as “City Index”) is an execution-only service provider. This material, whether or not it states any opinions, is for general information purposes only and it does not take into account your personal circumstances or objectives. This material has been prepared using the thoughts and opinions of the author and these may change. However, City Index does not plan to provide further updates to any material once published and it is not under any obligation to keep this material up to date. This material is short term in nature and may only relate to facts and circumstances existing at a specific time or day. Nothing in this material is (or should be considered to be) financial, investment, legal, tax or other advice and no reliance should be placed on it.
No opinion given in this material constitutes a recommendation by City Index or the author that any particular investment, security, transaction or investment strategy is suitable for any specific person. The material has not been prepared in accordance with legal requirements designed to promote the independence of investment research. Although City Index is not specifically prevented from dealing before providing this material, City Index does not seek to take advantage of the material prior to its dissemination. This material is not intended for distribution to, or use by, any person in any country or jurisdiction where such distribution or use would be contrary to local law or regulation.
For further details see our full non-independent research disclaimer and quarterly summary.
CFDs are complex instruments and come with a high risk of losing money rapidly due to leverage. 69% of retail investor accounts lose money when trading CFDs with this provider. You should consider whether you understand how CFDs work and whether you can afford to take the high risk of losing your money. CFD and Forex Trading are leveraged products and your capital is at risk. They may not be suitable for everyone. Please ensure you fully understand the risks involved by reading our full risk warning.
City Index is a trading name of StoneX Financial Ltd. Head and Registered Office: 1st Floor, Moor House, 120 London Wall, London, EC2Y 5ET. StoneX Financial Ltd is a company registered in England and Wales, number: 05616586. Authorised and regulated by the Financial Conduct Authority. FCA Register Number: 446717.
City Index is a trademark of StoneX Financial Ltd.
The information on this website is not targeted at the general public of any particular country. It is not intended for distribution to residents in any country where such distribution or use would contravene any local law or regulatory requirement.
© City Index 2024