


S&P 500 – Potential residual push up towards key resistance
click to enlarge charts
Key Levels (1 to 3 weeks)
Intermediate support: 2980
Pivot (key support): 2940
Resistances: 3028 (all-time high) & 3055/70
Next support: 2820
Directional Bias (1 to 3 weeks)
Last week, the SP 500 Index (proxy for the S&P 500 futures) has staged the expected push up and almost hit the first upside target of 3028 (current all-time high); printed a high of 3023 on 13 Sep (click here for a recap on our previous report).
Despite a drop of -0.80% seen so far on the SP 500 Index in today, 16 Sep Asian session due to rising geopolitical risk in the Middle East over the weekend drones’ attacks on Saudi Arabia’s oil pipelines that triggered a 10% spike up in oil price, the medium-term (1-3 weeks) uptrend remains intact for the Index.
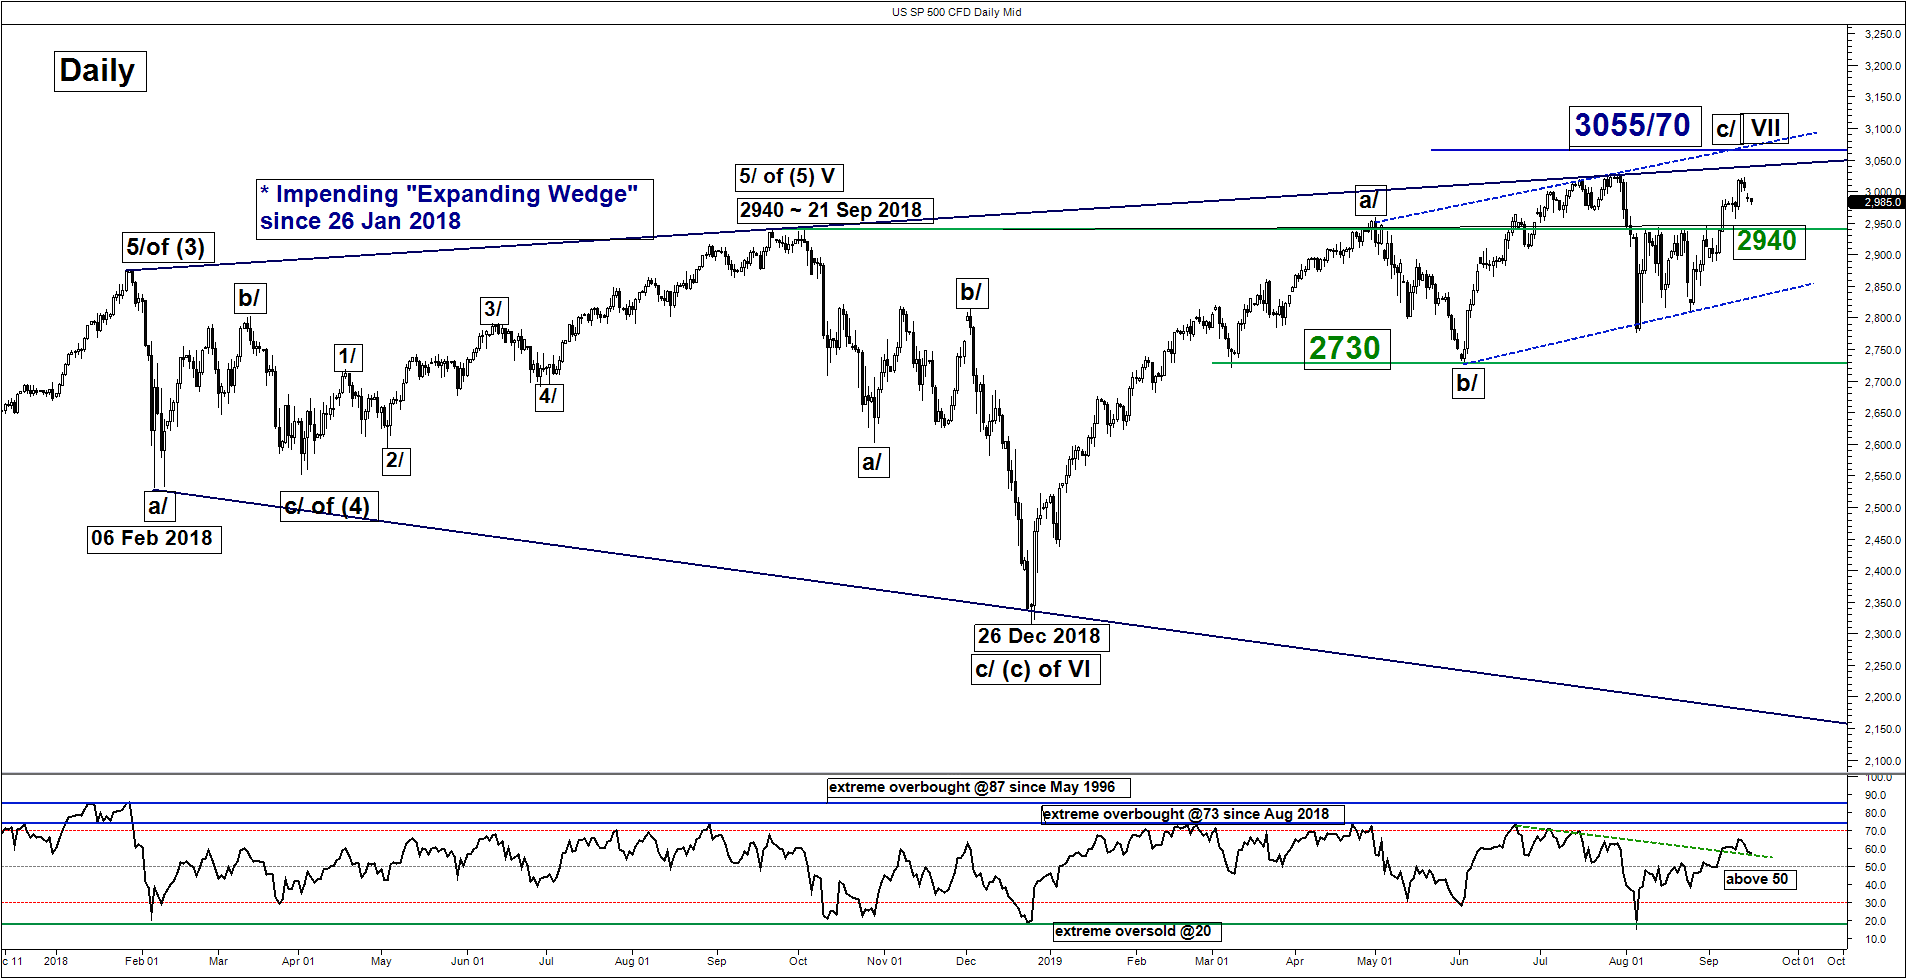
Maintain bullish bias with 2940 remains as the key medium-term pivotal support for a potential residual push up to retest 3028 before target the significant key resistance/risk zone of 3055/70 before the Index faces the risk of a 7% to 10% decline.
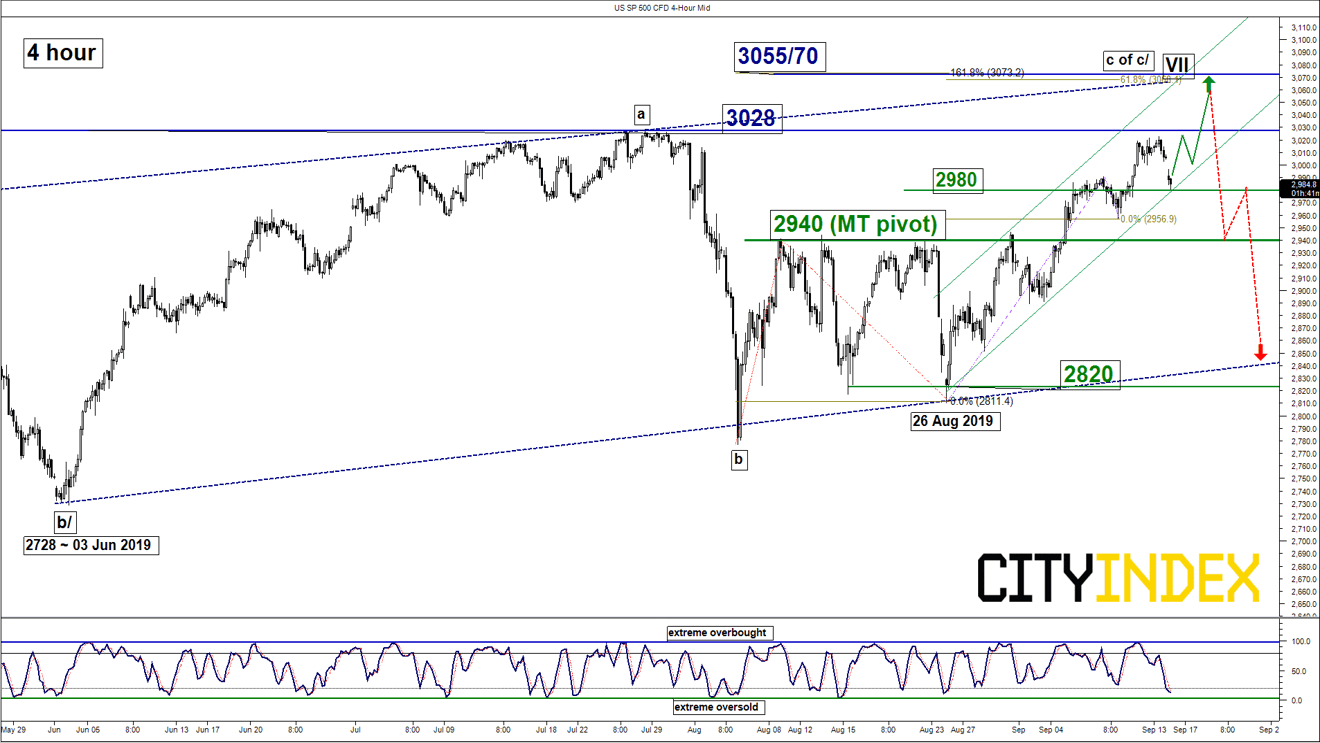
However, a daily close below 2940 indicates a failure bullish breakout to see another round of choppy decline towards the 2820 support (lower boundary of an ascending range since 03 Jan 2019).
Key elements
- The -0.80% drop seen in today’s Asian session has managed to reach the lower boundary of a minor ascending channel in place since 26 Aug 2019 coupled with the 4-hour Stochastic oscillator that has reached an extreme oversold level. These observations suggest price action has the potential to shape a bullish reversal at this juncture.
- The lower boundary of the minor ascending channel is acting as a support at 2980 which confluences with the 61.8% Fibonacci retracement of the most recent up move from 10 Sep low to 13 Sep 2019 high.
- Elliot Wave/fractal analysis suggests that Index may be shaping is residual push up to complete the intermediate wave c/ of a primary degree impulsive wave VII of an “Expanding Wedge” configuration in place since 26 Jan 2018.
- The risk zone of 3055/70 which is defined by the intersection of the upper boundaries of the “Expanding Wedge” from 26 Jan 2018 & ascending range from 03 Jan 2019, the upper boundary of a minor ascending channel from 26 Aug 2019 and a Fibonacci expansion cluster.
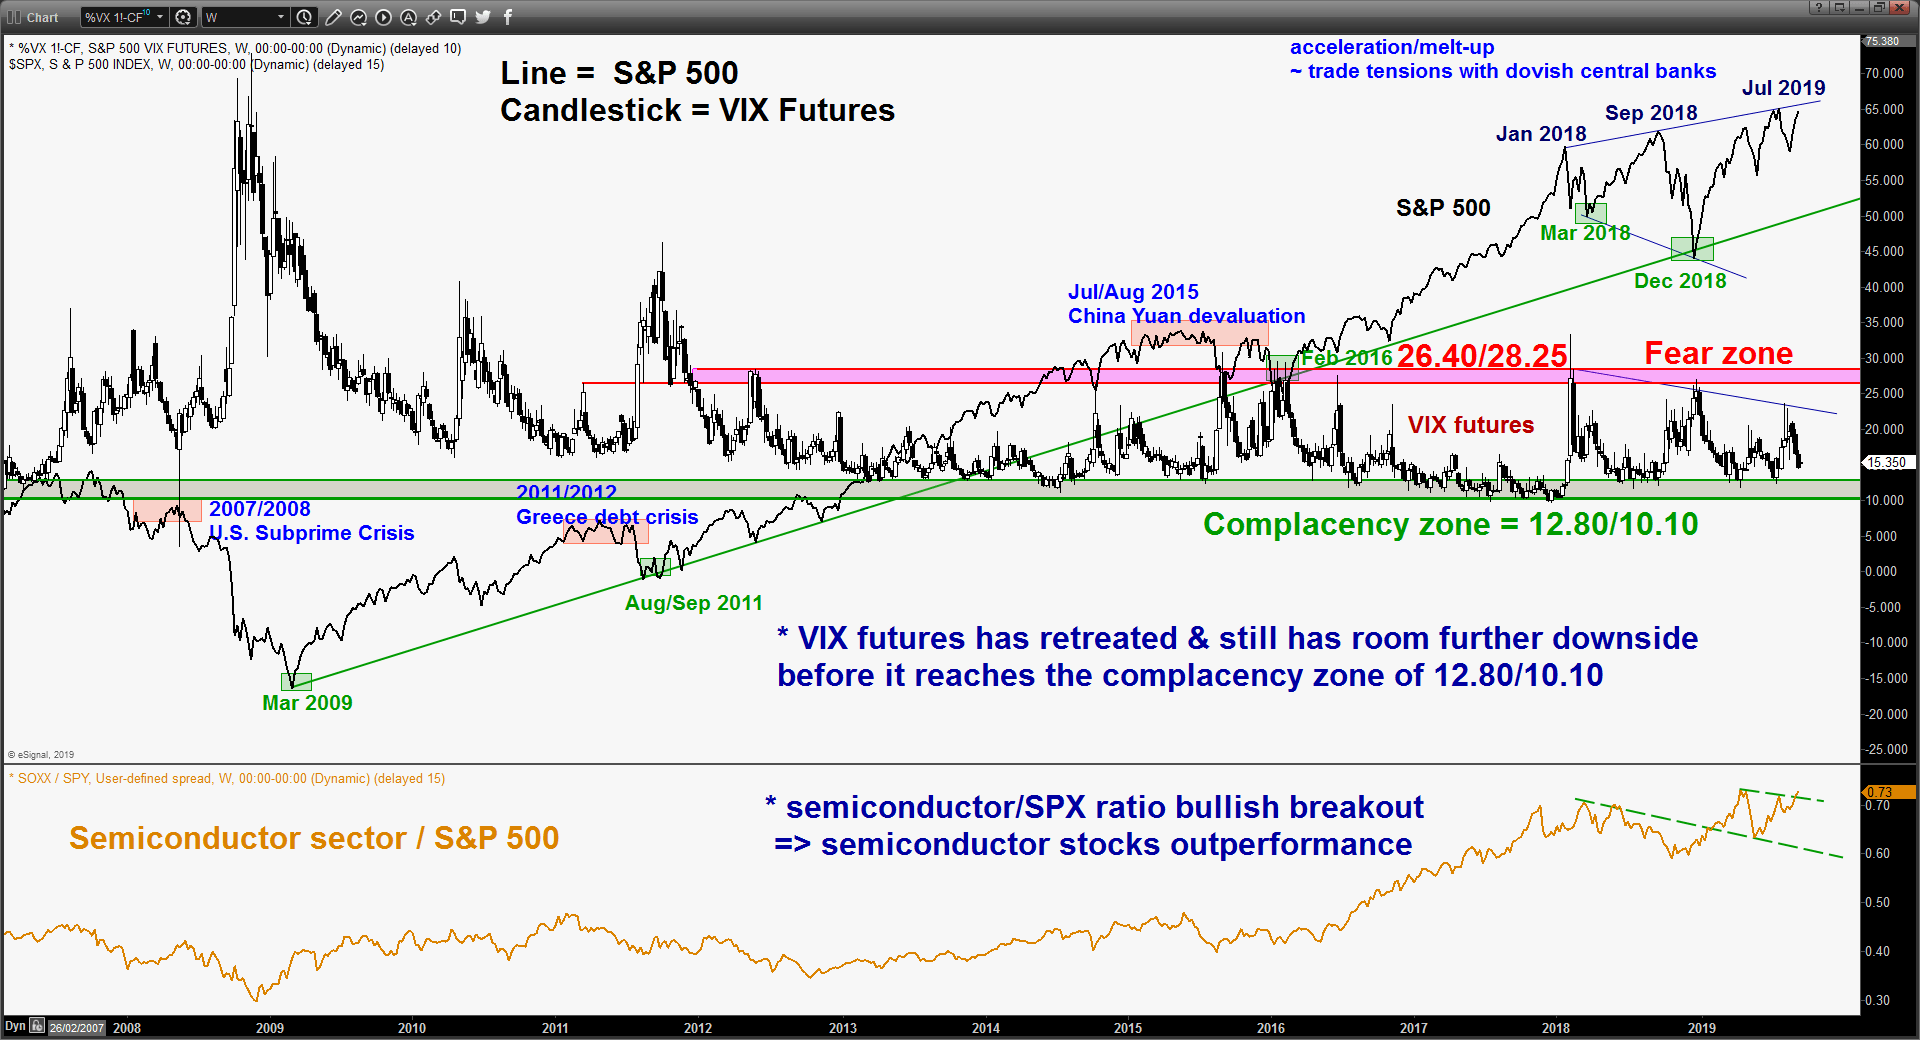
- Contrary opinion study from the current price action of the VIX futures are supporting a further up move in the S&P 500. In addition, relative strength analysis on the higher-beta Semiconductor sector against the S&P 500 is also advocating a positive signal (refer to the 3rd chart).
Hang Seng – Mix elements
click to enlarge charts
Key Levels (1 to 3 weeks)
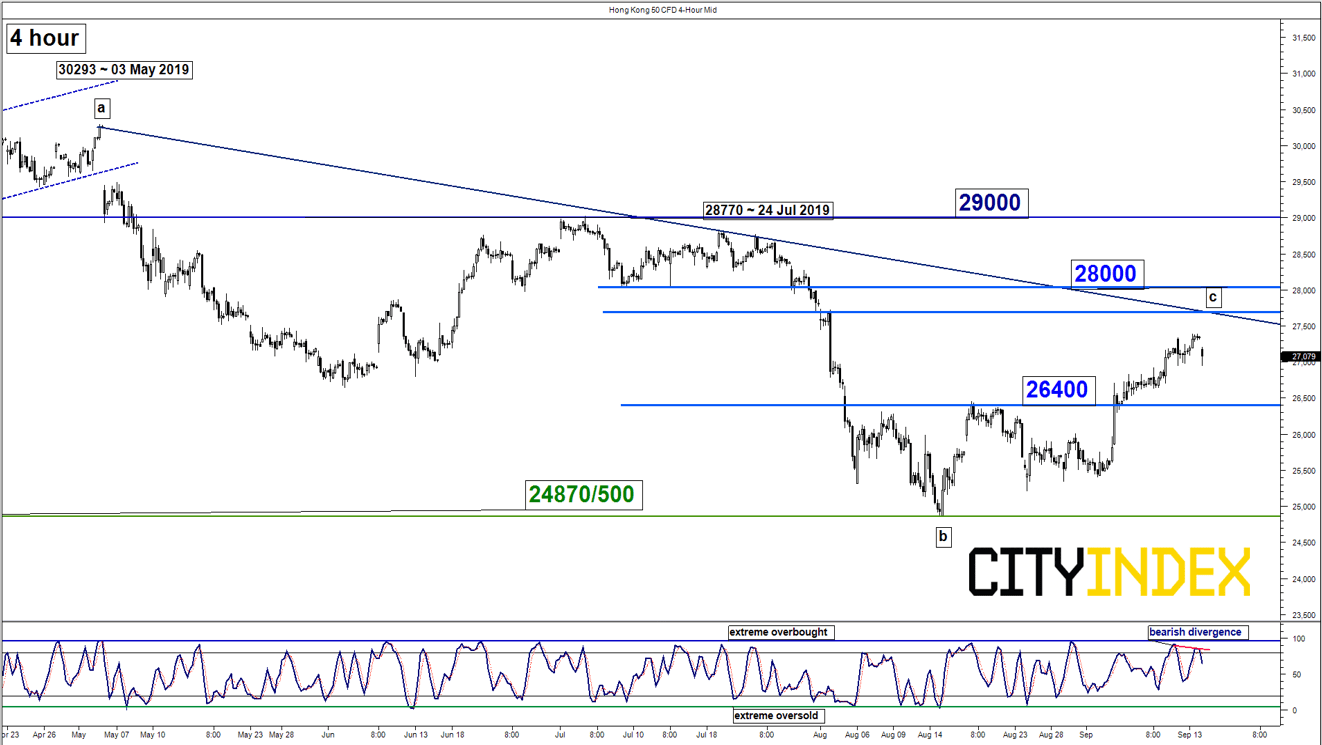
Resistances: 28000 & 29000
Supports: 26400 & 24870/500
Directional Bias (1 to 3 weeks)
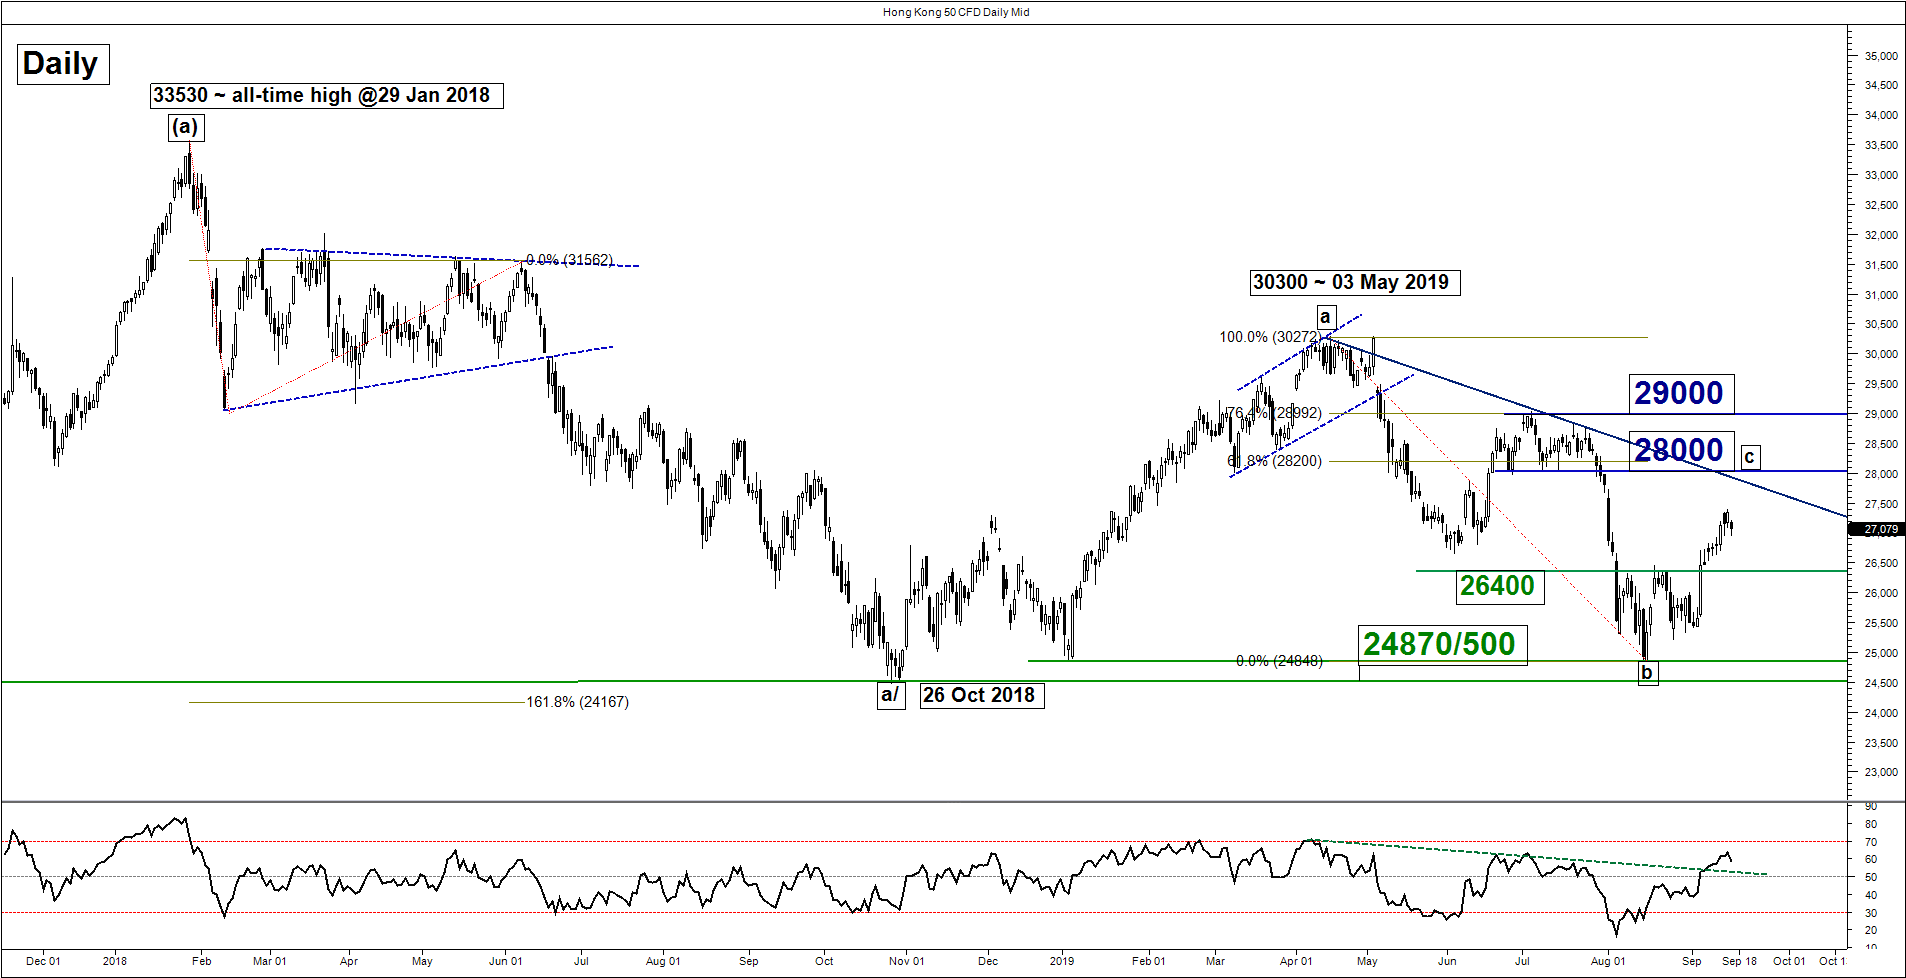
Last week, the Hong Kong 50 Index (proxy for Hang Seng Index futures) has staged the expected push up to print a high of 27387 on 13 Sep; 2.2% away from the 28000 upside target/resistance as per highlighted in our previous report.
Right now, key elements have turned mix where the price action of the Index is now coming close a descending trendline from 03 May 2019 high with a bearish divergence signal seen in the 4-hour Stochastic oscillator at its overbought region. Thus, we prefer to adopt a neutral bias now where only a clear break with a daily close above 28000 opens up scope for a further push up to target the next resistance at 29000 (also the 76.4% retracement of the 4-month decline from 03 May high to 15 Aug 2019 low).
On the flipside, a break with a daily close below 26400 triggers a further slide towards the major range support of 24870/500.
Nikkei 225 – Further potential push up towards key resistance zone
click to enlarge charts
Key Levels (1 to 3 weeks)
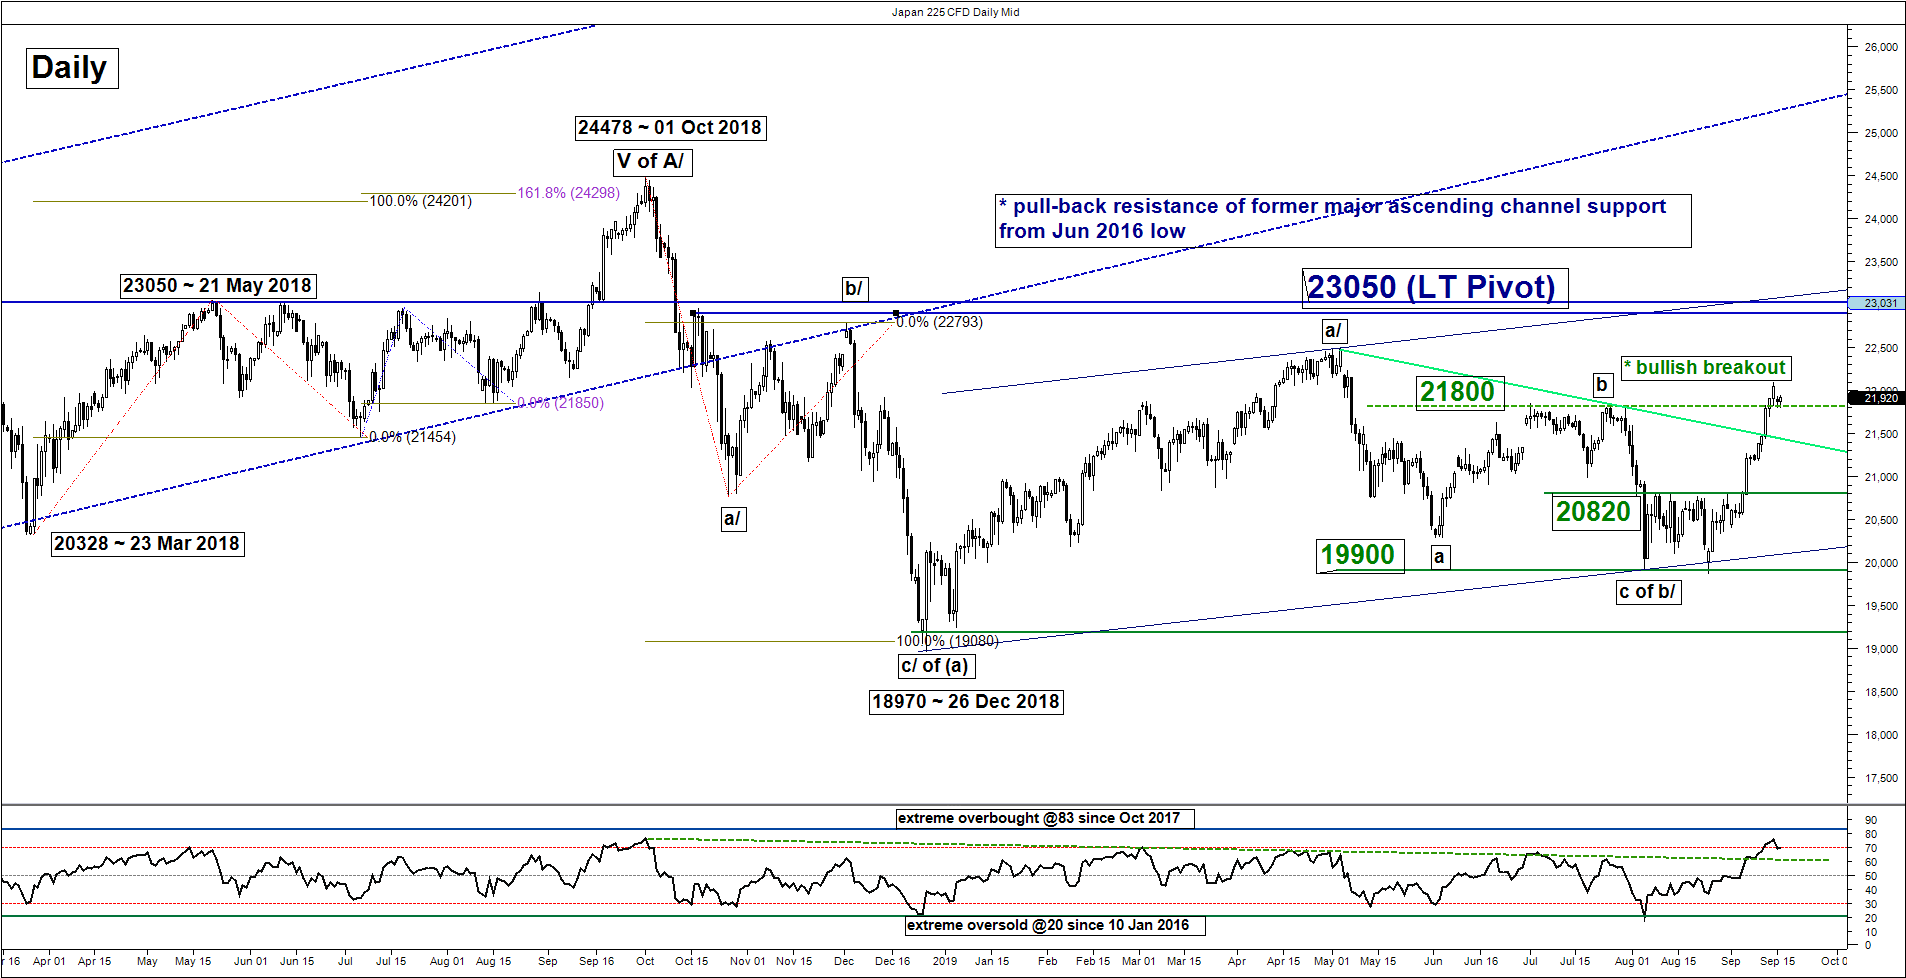
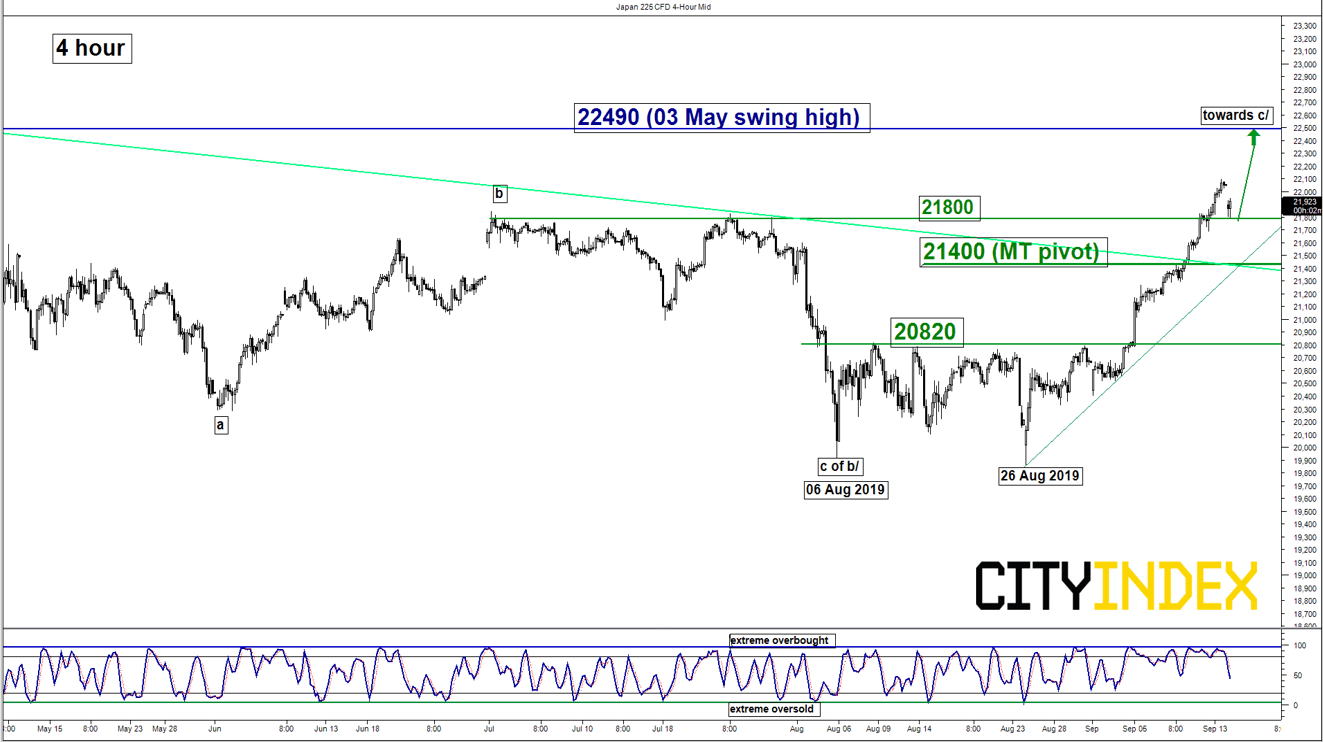
Intermediate support: 21800
Pivot (key support): 21400
Resistance: 22490
Next support: 20820
Directional Bias (1 to 3 weeks)
Last week, Japan 225 Index (proxy for the Nikkei 225 futures) has staged the expected push up and hit the upside target/resistance of 21850. It printed a high of 22093 on 13 Sep and recorded a daily close above 21850 (last week’s upside target/resistance; the swing high area of 01/25 Jul 2019).
Key elements remain positive, we maintain the bullish bias with a tightened key medium-term pivotal support at 21400 (the pull-back support of the former descending resistance from 03 May 2019) for a further potential push up towards the next resistance at 22490.
However, a daily close below 21400 negates the bullish tone for a slide to retest the 20820 pull-back support of the former neckline resistance of a minor “Double Bottom” configuration from 06/26 Aug 2019.
ASX 200 – Uptrend remains intact
click to enlarge charts
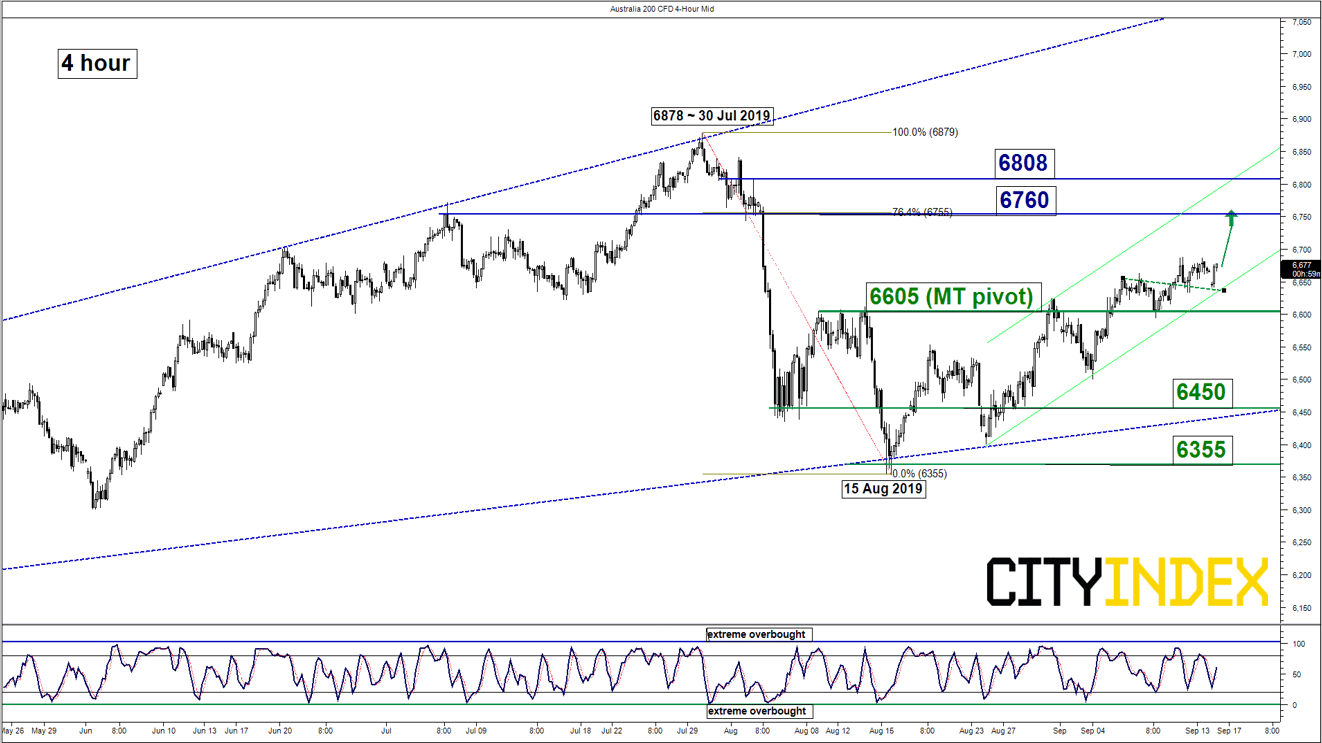
Key Levels (1 to 3 weeks)
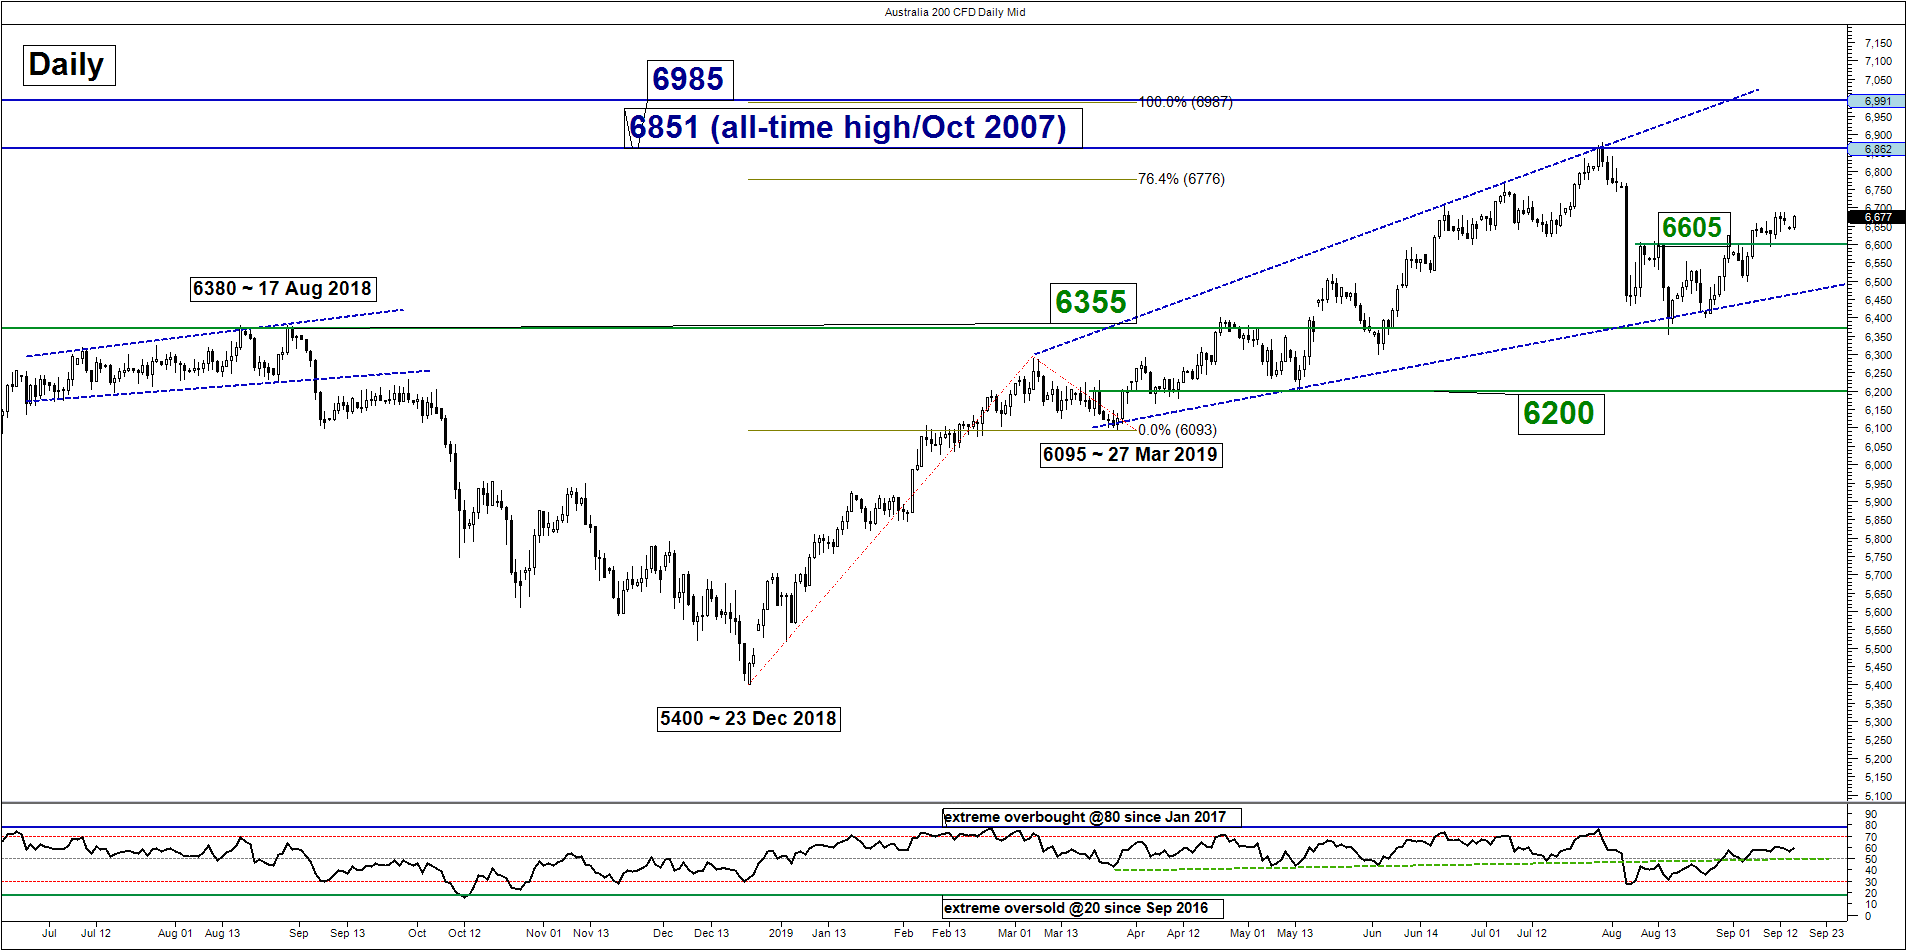
Intermediate support: 6645
Pivot (key support): 6605
Resistances: 6760 & 6808
Next support: 6450/355
Directional Bias (1 to 3 weeks)
The Australia 200 Index (proxy for the ASX 200 futures) has continued to push higher as expected with medium-term upside momentum of price action remains intact as indicted by the daily RSI oscillator (holding above 50 level with further room to manoeuvre towards its extreme overbought level of 80).
Maintain bullish bias with a tightened key medium-term pivotal support now at 6605 for a further potential up move to target 6760 resistance in the first step follow by 6808 next (upper boundary of the minor ascending channel from 26 Aug 2019 low). However, a daily close below 6605 invalidates the preferred bullish scenario for a choppy decline back towards 6450/355 zone (also the lower boundary of the “Expanding Wedge” configuration in place since 27 Mar 2019 low).
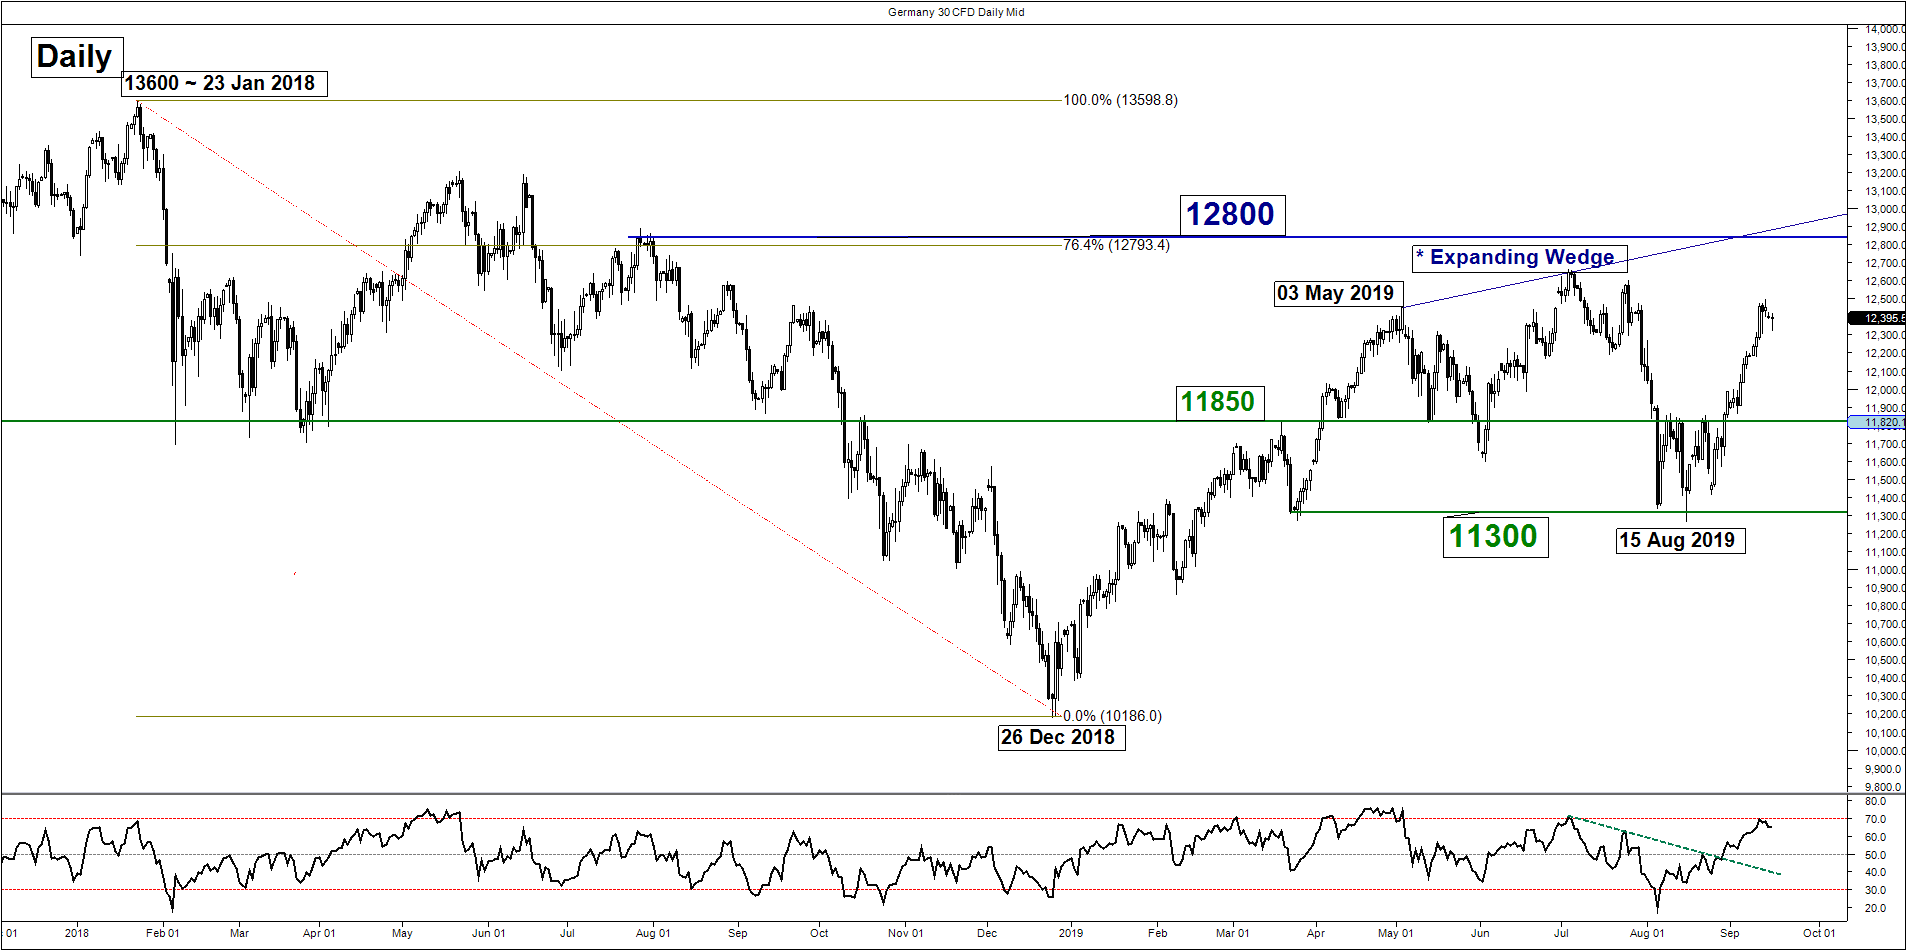
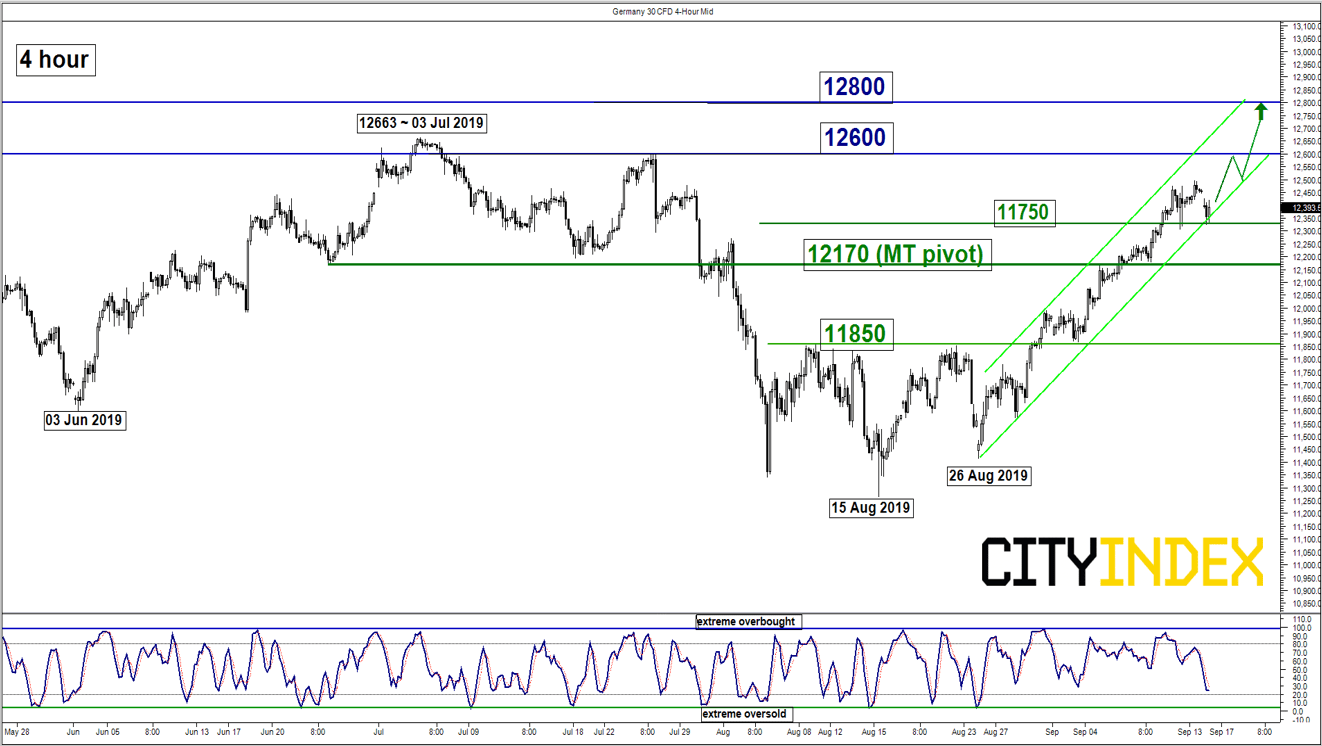
DAX – Further potential push up to target key resistance
click to enlarge charts
Key Levels (1 to 3 weeks)
Intermediate support: 11750
Pivot (key support): 12170
Resistances: 12600 & 12800
Next support: 11850
Directional Bias (1 to 3 weeks)
Last week, the Germany 30 Index (proxy for the DAX futures) has continued to push higher as expected and almost hit the first upside target/resistance of 12600 (printed a high of 12496 on 13 Sep).
Maintain bullish bias with a tightened key medium-term pivotal support at 12170 for a further potential up move to target 12600 and the 12800 key resistance (upper limit of the “Expanding Wedge” & 76.4% Fibonacci retracement of the previous down move from 23 Jan high to 26 Dec 2018 low).
However, a daily close below 12170 invalidates the preferred bullish scenario for a choppy decline back to retest the 11850 pull-back support of the former minor “Double Bottom” configuration neckline resistance.
Charts are from City Index Advantage TraderPro & eSignal
Latest market news
Latest Australia 200 articles
February 15, 2024 11:33 PM
February 15, 2024 01:42 AM
February 14, 2024 05:39 AM