Gold set to resume rally amid renewed falls for yields and stocks
Gold has been one the main beneficiaries from Tuesday's publication of a very poor US manufacturing PMI report, which caused havoc in the markets. The news hurt stocks and the US dollar, causing bond yields to fall as investors sought the relative safety of government bonds. Dollar-denominated and safe-haven gold thus found itself in unexpected demand after falling noticeably in the previous days. With yields falling again, this also helped to boost the noninterest-bearing metal’s appeal on a relative basis.
Now, in the event this week’s upcoming US macro pointers disappoint expectations as well, or otherwise fail to sharply reduce the odds of another rate cut at end of this month, then gold stands ready to benefit further, given the current favourable macro conditions with major global central banks being in easing mode. According to the CME Group’s FedWatch tool, the probability of a 25-basis-point rate cut from the Fed is currently almost at 64%, up sharply from about 50-55% last week, following the publication of the manufacturing PMI report and the inevitable tweet from Donald Trump in which the US President once again criticised the Fed and blamed the central bank for the downturn in manufacturing activity.
Sellers getting trapped?
Source: Trading View and City Index.
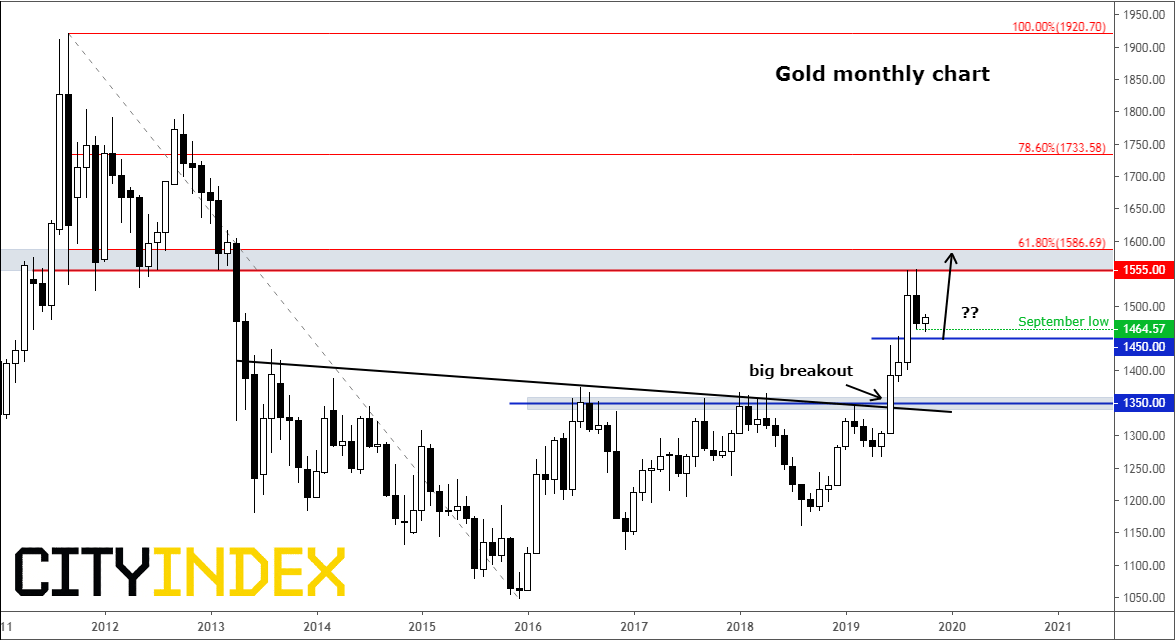
There is no doubt that gold’s long-term technical outlook is positive, even after what was a relatively small retracement that began at the start of September. And we are now expecting the precious metal to potentially resume its long-term rally. Remember, gold had risen sharply for four consecutive months prior to the hiccup in September. So the recent weakness should be put into perspective.
Now some would argue that (1) gold should retrace back to the point of origin of that long-term breakout around $1350 before continuing higher, while (2) others point to the fact prices had created a “Head and Shoulders” reversal formation during its consolidation pullback in September, as can be seen on the daily and lower time frames. In both cases, the metal “should” be falling, they argue, especially with the Dollar Index continually hitting new 2019 highs (until Tuesday's reversal).
Well, my response to the above points are as follows:
First, as far as point (1) is concerned, if gold prices were to go back THAT far to retest the point of origin of the breakout from the 6-year-old resistance range, then why can’t it continue going lower? After such a lengthy period of consolidation and the subsequent breakout, gold ‘shouldn’t’ go back that deep if that was truly a major breakout that we have witnessed. As I believe that was a major breakout, I don’t expect gold to revisit $1350s any time soon – unless something changes fundamentally.
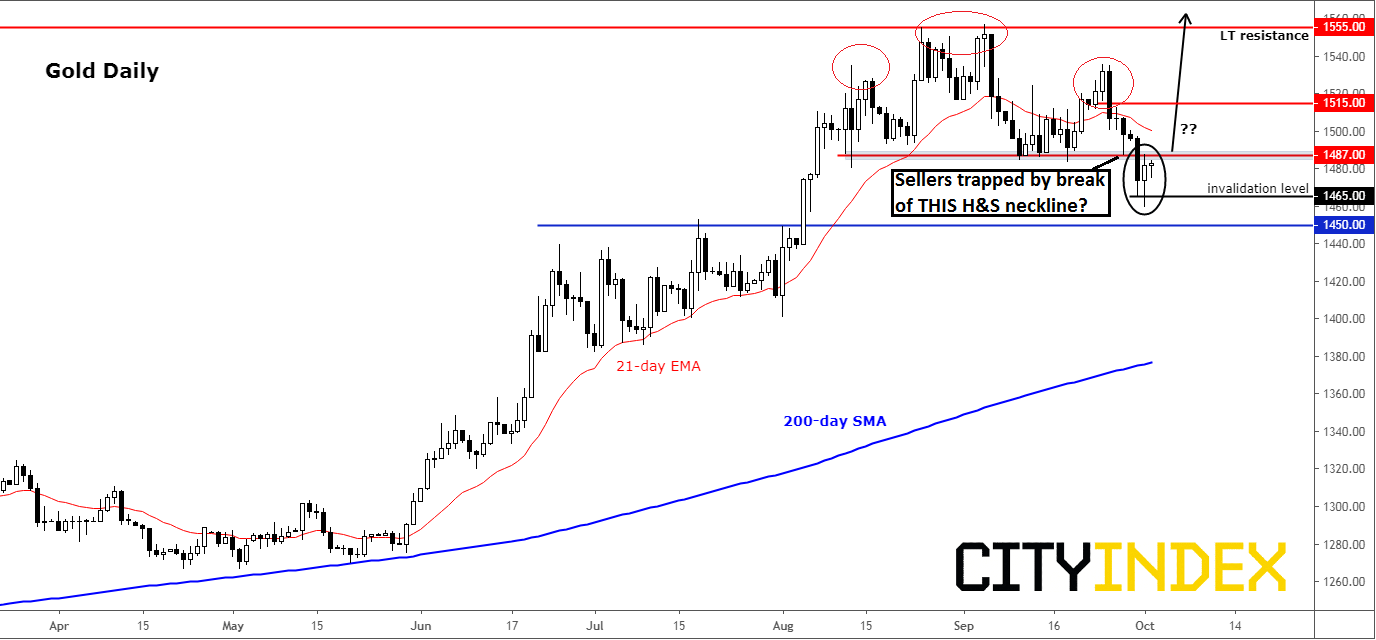
With regards to point (2), it is important to point out that the head and shoulders formation that was formed on the daily only took just over a month to take shape. Now compare this with the breakout from 6 years of major resistance. Which one do you think is more important? If you agree that the latter is, then the breakdown of the neckline of the H&S pattern at around $1485/90 area could turn out to be a major bear trap. So, the bulls should be happy if we go back above it and hold there.
In fact, the bears may have already gotten trapped following Tuesday's rebound when gold formed a piercing candle formation on the daily. Tuesday also marked the first day of the month, when gold prices briefly broke below the low from September. So, was this brief break down and the sequent rebound THE trap? If so, then the next big pool of liquidity that price may gravitate towards would be the area above September’s high at $1555.
But first thing is first: the bulls need gold to show confirmation that it has indeed turned the corner. A break and hold above the daily H&S neckline around $1485/90 is a must. Otherwise, the downside pressure could persist for a while yet.
Source: Trading View and FOREX.com.
StoneX Financial Ltd (trading as “City Index”) is an execution-only service provider. This material, whether or not it states any opinions, is for general information purposes only and it does not take into account your personal circumstances or objectives. This material has been prepared using the thoughts and opinions of the author and these may change. However, City Index does not plan to provide further updates to any material once published and it is not under any obligation to keep this material up to date. This material is short term in nature and may only relate to facts and circumstances existing at a specific time or day. Nothing in this material is (or should be considered to be) financial, investment, legal, tax or other advice and no reliance should be placed on it.
No opinion given in this material constitutes a recommendation by City Index or the author that any particular investment, security, transaction or investment strategy is suitable for any specific person. The material has not been prepared in accordance with legal requirements designed to promote the independence of investment research. Although City Index is not specifically prevented from dealing before providing this material, City Index does not seek to take advantage of the material prior to its dissemination. This material is not intended for distribution to, or use by, any person in any country or jurisdiction where such distribution or use would be contrary to local law or regulation.
For further details see our full non-independent research disclaimer and quarterly summary.
CFDs are complex instruments and come with a high risk of losing money rapidly due to leverage. 69% of retail investor accounts lose money when trading CFDs with this provider. You should consider whether you understand how CFDs work and whether you can afford to take the high risk of losing your money. CFD and Forex Trading are leveraged products and your capital is at risk. They may not be suitable for everyone. Please ensure you fully understand the risks involved by reading our full risk warning.
City Index is a trading name of StoneX Financial Ltd. Head and Registered Office: 1st Floor, Moor House, 120 London Wall, London, EC2Y 5ET. StoneX Financial Ltd is a company registered in England and Wales, number: 05616586. Authorised and regulated by the Financial Conduct Authority. FCA Register Number: 446717.
City Index is a trademark of StoneX Financial Ltd.
The information on this website is not targeted at the general public of any particular country. It is not intended for distribution to residents in any country where such distribution or use would contravene any local law or regulatory requirement.
© City Index 2024