FTSE Looks For A Leg Up
The FTSE 100 has lagged its US and European counterparts this year, but that doesn’t mean it doesn’t try to play catch-up. We noted that US indices have respected key support levels along with USD/JPY, which paints a glimmer of hope we could be headed for a bout of risk-on. If so, it could provide the FTSE100 with a much-needed tailwind and help it break to a new cycle high.
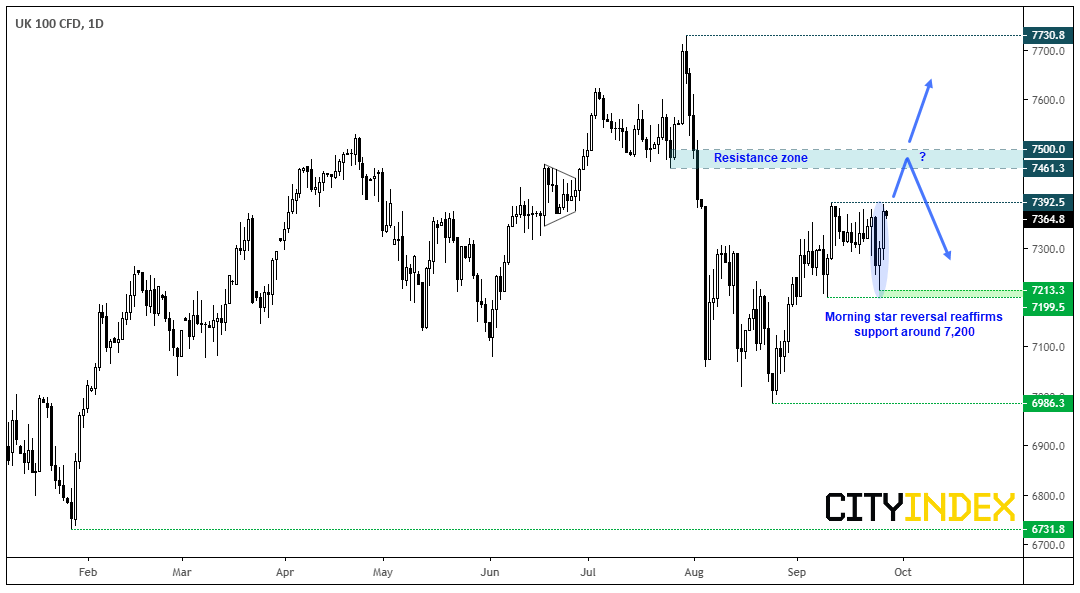
We can see on the daily chart that yesterday’s bullish candle closed just off the highs of a 3-week range. Moreover, Wednesday’s low reaffirmed support around 7,200 before heading higher and is part of a 3-bar bullish reversal pattern at support (the morning star reversal). From here’s we’re looking for a break above 7,392.50 to confirm a breakout, although we’re also mindful that interim resistance awaits around 7,461.30 so this should be taken into account for from a reward/risk perspective.
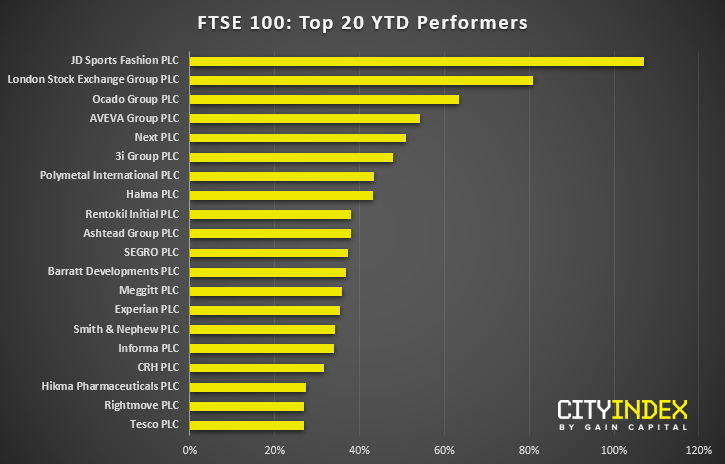
With that said, there’ll still be some stocks within the index which may sustain a better breakout, so we’ve listed the top 20 performers YTD (year to date) and selected three FTSE stocks worth following.
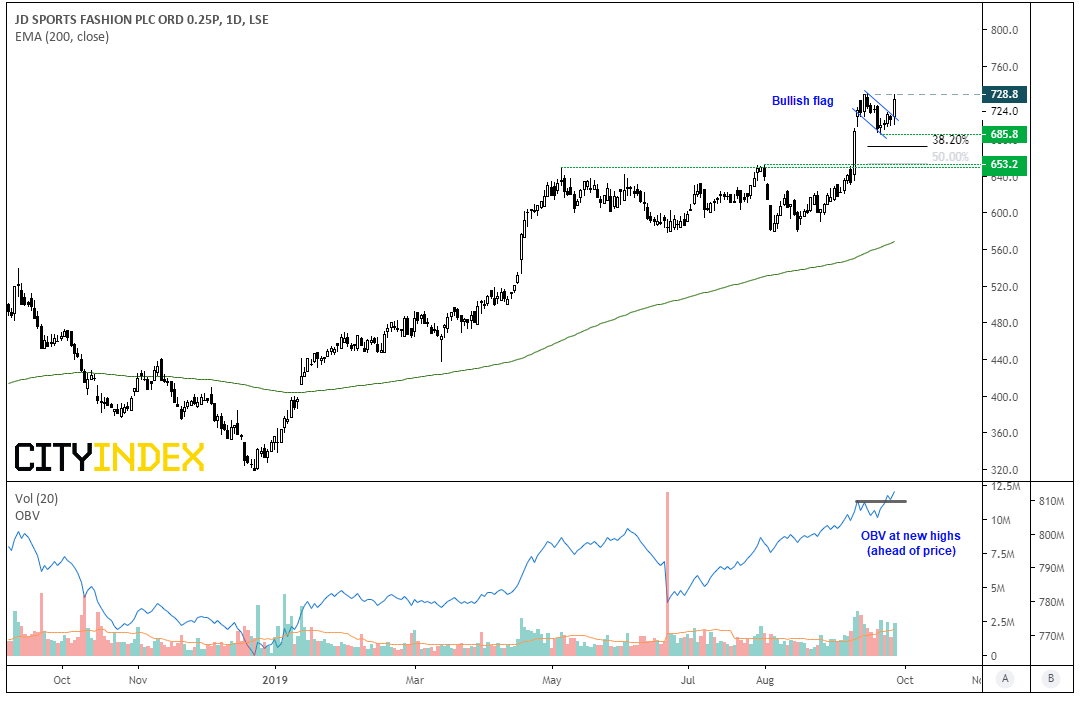
JD Sports (JD) sits just off record highs following yesterday’s range expansion day. That the pullback failed to even test the 38.2% retracement is a testament to the trend’s strength, and momentum has only increased since breaking out of its basing pattern on the 10th September. The retracement took form of a small bullish flag which is a continuation pattern in an uptrend. Furthermore, as daily volumes remain above average and OBV is at fresh highs ahead of price are encouraging signs for a bullish breakout.
- Bulls could take a break above 730 as a sign the trend is set to resume
- Bias remains bullish whilst prices hold above the 653.2 breakout level, which could allows traders to buy dips above support if prices fail to break/hold higher
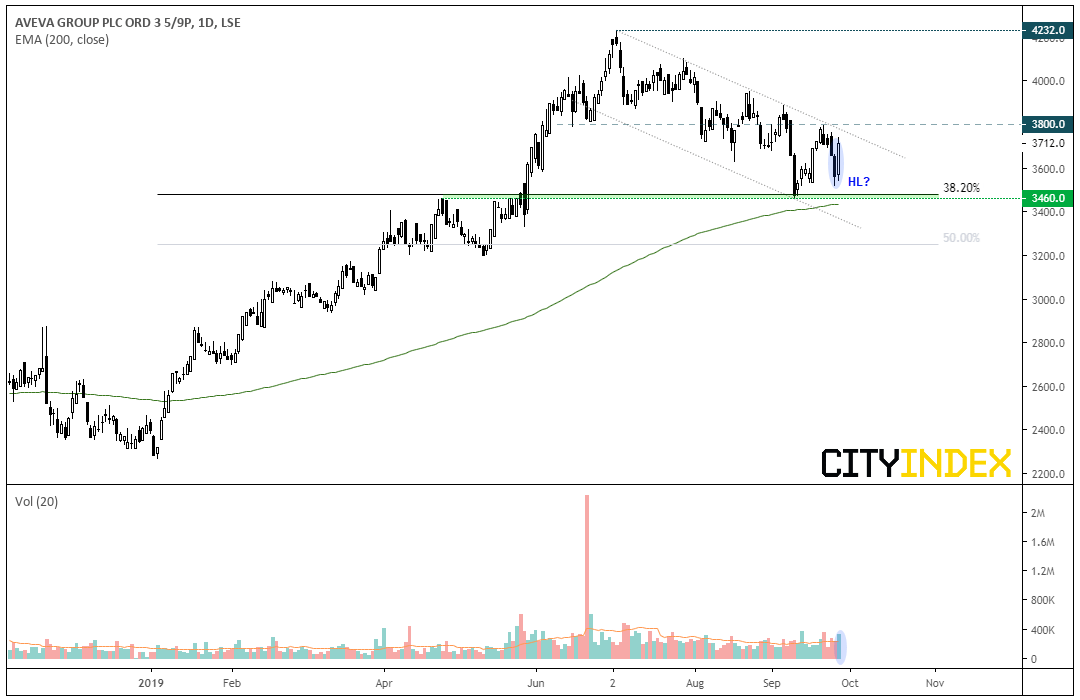
AVEVA Group (AVV) is currently trading within a bearish channel, although there are signs that it could be building up for a break higher to resume its longer-term bullish trend. The September low found support at the April high around 3460, which is near the 38.2% Fibonacci retracement level and above the 200-day eMA.
Yesterday’s 2-bar reversal marks a potential higher low, so a base could now be forming ahead of a bullish breakout. Volume was also above average yesterday which is an encouraging sign for a break higher.
- Bulls could use a break above 3,800 to signal a bullish breakout from the corrective channel. However, we’d prefer to see any breakout be accompanied on higher than average volume and / or OBV breaking a cycle high.
- Bears could seek short setups if the channel caps as resistance on lower timeframes. The 3460 lows become the next target, although a break beneath here and the 200-day eMA suggests we’re in for a deeper correction on the daily timeframe.
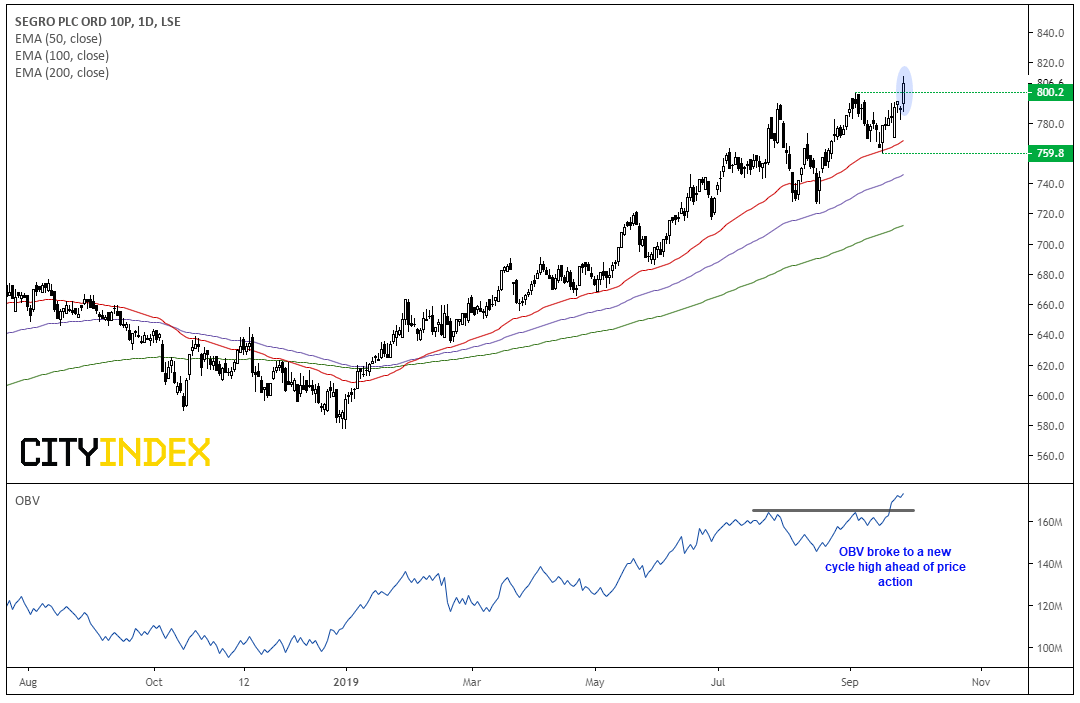
Segro Group (SGRO) trades in a clearly defined uptrend and the moving average are within bullish sequence and all pointing higher, to show momentum across multiple timeframes is bullish. Yesterday the stock broke and closed to a new cycle high above 800. Moreover, OBV (on balance volume) broke higher ahead of the breakout to show bullish demand was picking up.
- The trend remains bullish above 759.8, so bulls could seek to buy dips above this structural level and keep an open, bullish target
- Intraday traders could see of 800 holds as support to consider long positions
- The bullish bias is invalidated with a break beneath the 759.8 low.
Related Analysis:
Whilst FedEx Sounds The Alarm For Global Trade, Can UBS Weather The Storm? | FDX, UPS
Samsung’s Breakaway Gap – The Beginning Of Something Larger?
StoneX Financial Ltd (trading as “City Index”) is an execution-only service provider. This material, whether or not it states any opinions, is for general information purposes only and it does not take into account your personal circumstances or objectives. This material has been prepared using the thoughts and opinions of the author and these may change. However, City Index does not plan to provide further updates to any material once published and it is not under any obligation to keep this material up to date. This material is short term in nature and may only relate to facts and circumstances existing at a specific time or day. Nothing in this material is (or should be considered to be) financial, investment, legal, tax or other advice and no reliance should be placed on it.
No opinion given in this material constitutes a recommendation by City Index or the author that any particular investment, security, transaction or investment strategy is suitable for any specific person. The material has not been prepared in accordance with legal requirements designed to promote the independence of investment research. Although City Index is not specifically prevented from dealing before providing this material, City Index does not seek to take advantage of the material prior to its dissemination. This material is not intended for distribution to, or use by, any person in any country or jurisdiction where such distribution or use would be contrary to local law or regulation.
For further details see our full non-independent research disclaimer and quarterly summary.
CFDs are complex instruments and come with a high risk of losing money rapidly due to leverage. 69% of retail investor accounts lose money when trading CFDs with this provider. You should consider whether you understand how CFDs work and whether you can afford to take the high risk of losing your money. CFD and Forex Trading are leveraged products and your capital is at risk. They may not be suitable for everyone. Please ensure you fully understand the risks involved by reading our full risk warning.
City Index is a trading name of StoneX Financial Ltd. Head and Registered Office: 1st Floor, Moor House, 120 London Wall, London, EC2Y 5ET. StoneX Financial Ltd is a company registered in England and Wales, number: 05616586. Authorised and regulated by the Financial Conduct Authority. FCA Register Number: 446717.
City Index is a trademark of StoneX Financial Ltd.
The information on this website is not targeted at the general public of any particular country. It is not intended for distribution to residents in any country where such distribution or use would contravene any local law or regulatory requirement.
© City Index 2024