Fed Slams The Dollar AUDUSD USDJPY
Fed Slams The Dollar | AUD/USD, USD/JPY
Dovish comments from Fed officials has put a 50bps cut in July back onto the table for markets, and markets were quick to respond.
- Fed’s William’s said current estimates of the US neutral interest rates are around 0.5% and, if inflation gets stuck below goal, people’s expectations may push inflation lower, “reducing the Fed’s ability to be effective”.
- Richard Clarinda, who was mostly ‘centrist’ at the June meeting, said during a live TV interview that “you don’t want to wait until data turns decisively” and “it’s important to act pre-emptively.
That these comments were said on Donald Trump’s favourite Fox News program, ‘Fox and Friends’ is also worth noting, given the Fed have been accused of bowing to the President’s pressure and therefor, not as independent as they claim. Still, what’s said is said and markets reacted accordingly.
- USD index closed to a 2-week low amid its most bearish session in 1-month
- Gold broke to a fresh, 6-year high (nice call Fawad)
- AUD/USD hit a 3-month high
- US2yr fell to 1.76%, a 9-day low and now far from its YTD lows
- OIS markets are now pricing in a 76% chance of a 50bps cut this month, whilst CME’s FedWatch tool suggests a relatively modest 44.2%.
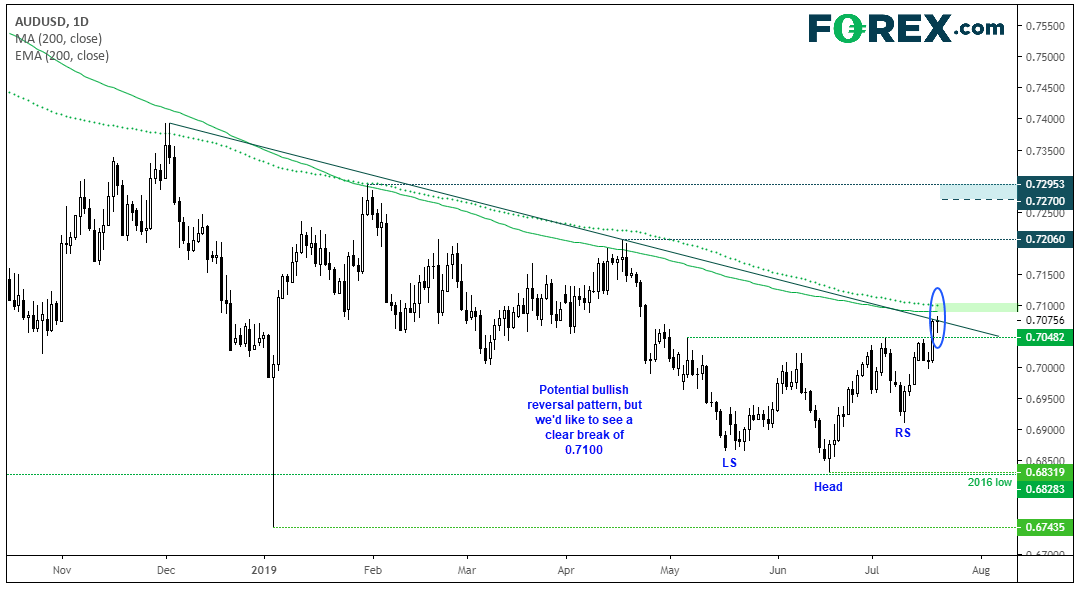
Starting with AUD/USD, it’s most bullish day since late January closed right on the December ’18 bearish trendline.
- A higher high and low has materialised since the 2016 low, which could be part of an inverted head and shoulders pattern.
- If successful, the pattern projects an approximate target around 0.727, although the 0.7200 area makes a logical interim target
- However, the 200-day MA and eMA are nearby, so we’d want to see a clear break above 0.7100 before assuming a bullish reversal
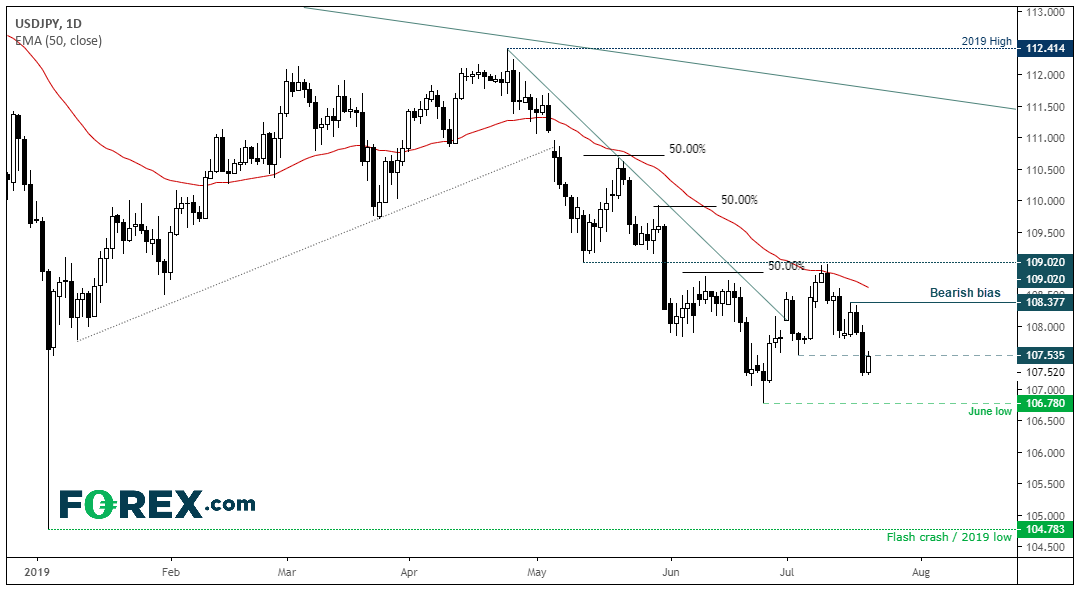
USD/JPY looks set to re-test its lows and potentially extend its bearish trend now bearish momentum has returned.
- The 109.02 resistance level previously highlighted has continued to be a good level to fade into, with the 50-day eMA capping as resistance
- Intraday traders could look for shorts below the 107.54 area (but expect some noise around this level heading into the weekend)
- The daily structure remains bearish below 109.02, but we could consider fading into moves on the daily chart below 108.38
- Next target is 106.78 but the bias is for a break to new lows
StoneX Financial Ltd (trading as “City Index”) is an execution-only service provider. This material, whether or not it states any opinions, is for general information purposes only and it does not take into account your personal circumstances or objectives. This material has been prepared using the thoughts and opinions of the author and these may change. However, City Index does not plan to provide further updates to any material once published and it is not under any obligation to keep this material up to date. This material is short term in nature and may only relate to facts and circumstances existing at a specific time or day. Nothing in this material is (or should be considered to be) financial, investment, legal, tax or other advice and no reliance should be placed on it.
No opinion given in this material constitutes a recommendation by City Index or the author that any particular investment, security, transaction or investment strategy is suitable for any specific person. The material has not been prepared in accordance with legal requirements designed to promote the independence of investment research. Although City Index is not specifically prevented from dealing before providing this material, City Index does not seek to take advantage of the material prior to its dissemination. This material is not intended for distribution to, or use by, any person in any country or jurisdiction where such distribution or use would be contrary to local law or regulation.
For further details see our full non-independent research disclaimer and quarterly summary.
CFDs are complex instruments and come with a high risk of losing money rapidly due to leverage. 69% of retail investor accounts lose money when trading CFDs with this provider. You should consider whether you understand how CFDs work and whether you can afford to take the high risk of losing your money. CFD and Forex Trading are leveraged products and your capital is at risk. They may not be suitable for everyone. Please ensure you fully understand the risks involved by reading our full risk warning.
City Index is a trading name of StoneX Financial Ltd. Head and Registered Office: 1st Floor, Moor House, 120 London Wall, London, EC2Y 5ET. StoneX Financial Ltd is a company registered in England and Wales, number: 05616586. Authorised and regulated by the Financial Conduct Authority. FCA Register Number: 446717.
City Index is a trademark of StoneX Financial Ltd.
The information on this website is not targeted at the general public of any particular country. It is not intended for distribution to residents in any country where such distribution or use would contravene any local law or regulatory requirement.
© City Index 2024