FAANGs Earnings In Focus
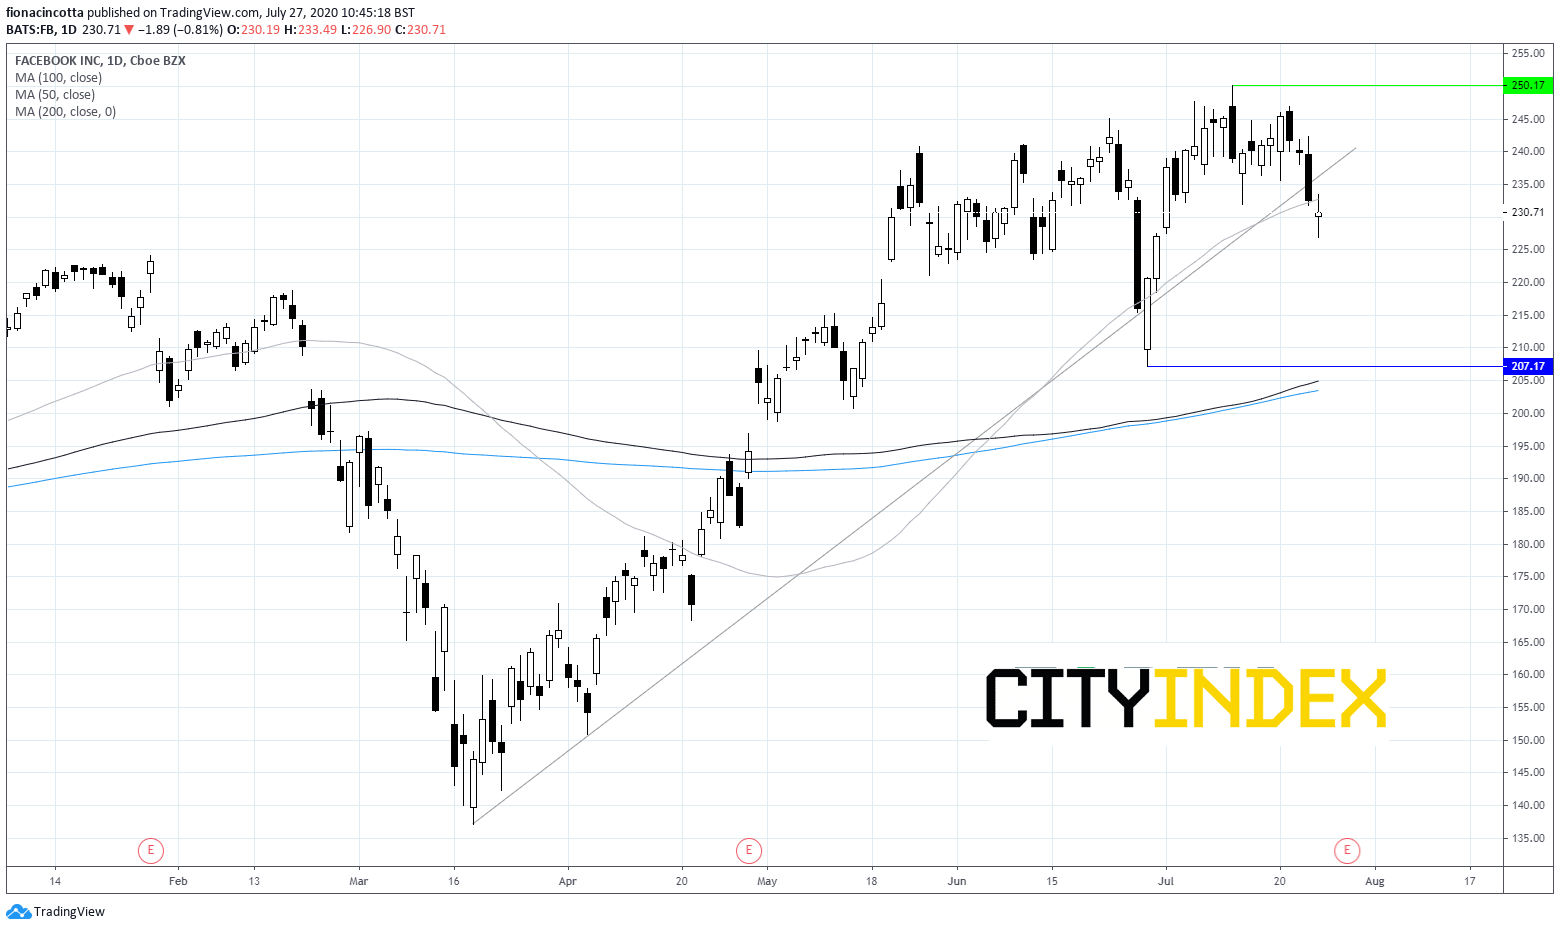
Facebook Q2 – 29th July
All eyes will be on advertising revenue when Facebooks reports Q2 earnings. FB reports as some big brands officially boycott Facebook advertising over its policy on misinformation and hate speech. Recent data shows US online ad spend points to a stronger than forecast recovery. Facebook’s daily active users climbed 11% in Q1 and could perform well again in Q2 amid the stay at home order. FB’s expansion into the booming e-commerce world will also be closely eyed with stores now easily created in Facebook and on Instagram. Broadly speaking analysts are optimistic.
Expectations are for quarterly EPS of $1.44 (+58%) on revenue of $17.31 billion (+2.5%)
Chart Thoughts
After hitting an all time high of $250 two weeks ago FB has fallen lower, slipping below its ascending trendline and 50 daily moving average suggesting that more weakness could be on the cards. If FB fails to retake the ascending trendline at $234, we could see a steeper sell off towards the key support at $205 (low 29th June & 100 & 200 sma)
Alphabet Q2 – 30th July
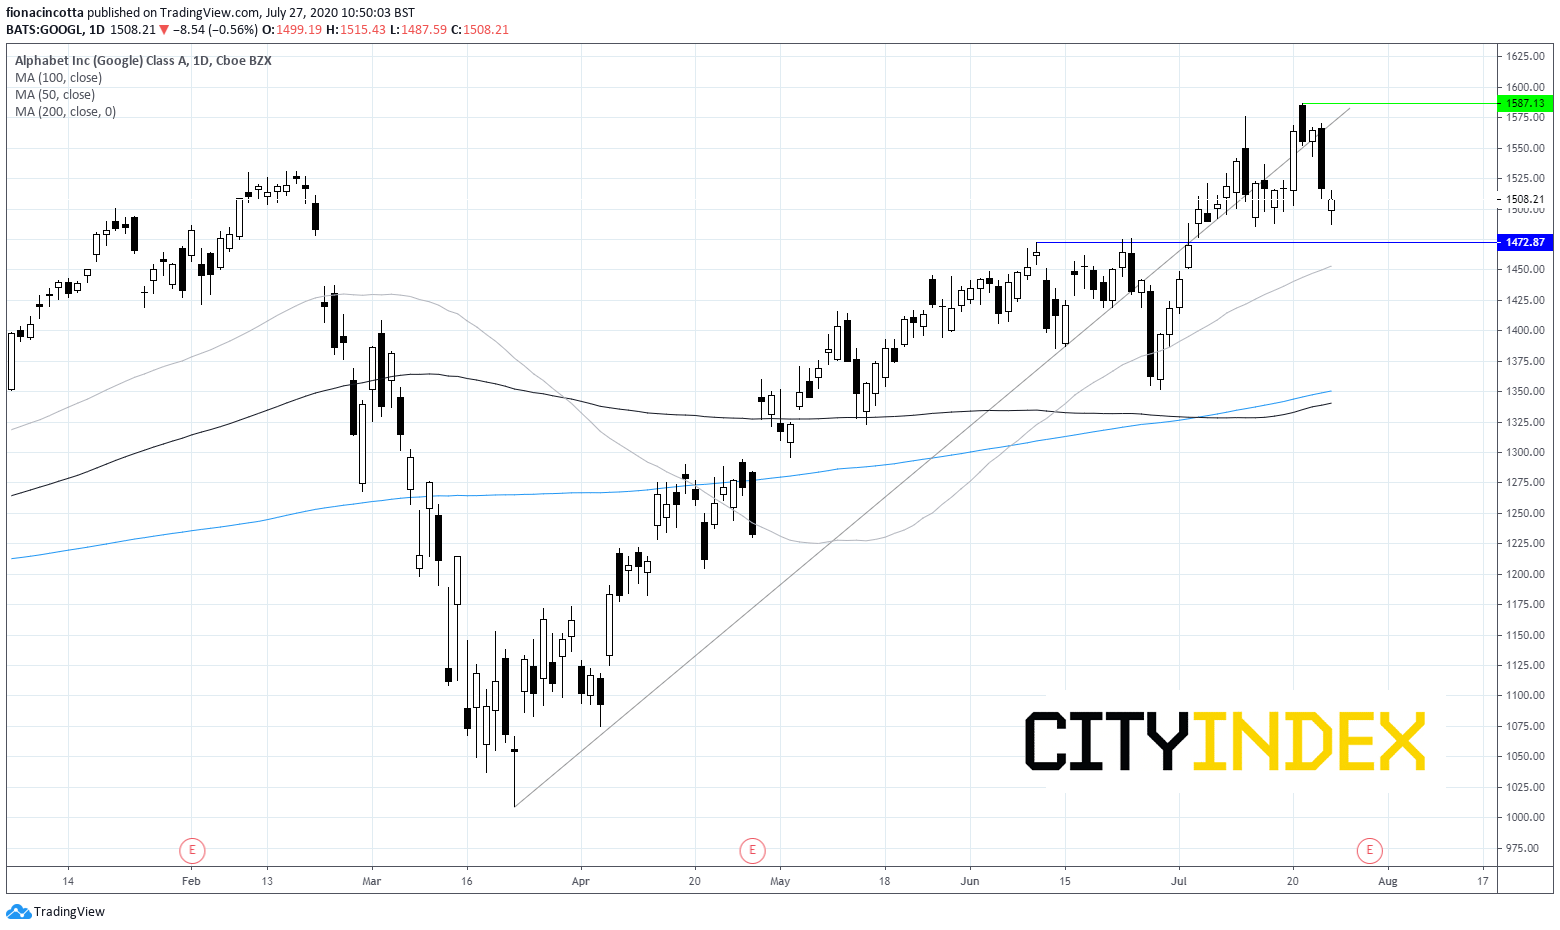
Google parent Alphabet is expected to report year on year decline in earnings on lower revenue. As with Facebook, advertising revenue will be in focus. April – June is expected to be the nadir for ad spend as marketing budgets are cut. Recent data shows that ad spend is starting to pick up. Alphabet has more than one string to its bow and could also benefit from consumers spending more time at home, on YouTube and Google Cloud platform which are now driving more than 50% of total sales. FactSet project that Google Cloud Platform will generate $12.9 billion in 2020 making it a significant factor in Alphabet’s growth but one that is perhaps undervalued by investors.
Expectations for quarterly EPS of $8.43 (-40% yoy) on revenues $30.66 billion (-3.3% yoy)
Chart thoughts
Alphabet has had a phenomenal rally from mid-March lows, soaring 57% to an all-time high of$1587 last week. Since then the stock has looked less certain dropping below its ascending trendline, although it remains firmly above its 50, 100 and 200 sma suggesting that there could be more upside on the cards still. We would be looking for a move back over the ascending trendline around $1560 to confirm a bullish trend. Otherwise a test of support at $1470 (July low) could open the doors to 50 sma at $1450.
Apple Q3 – 30th July
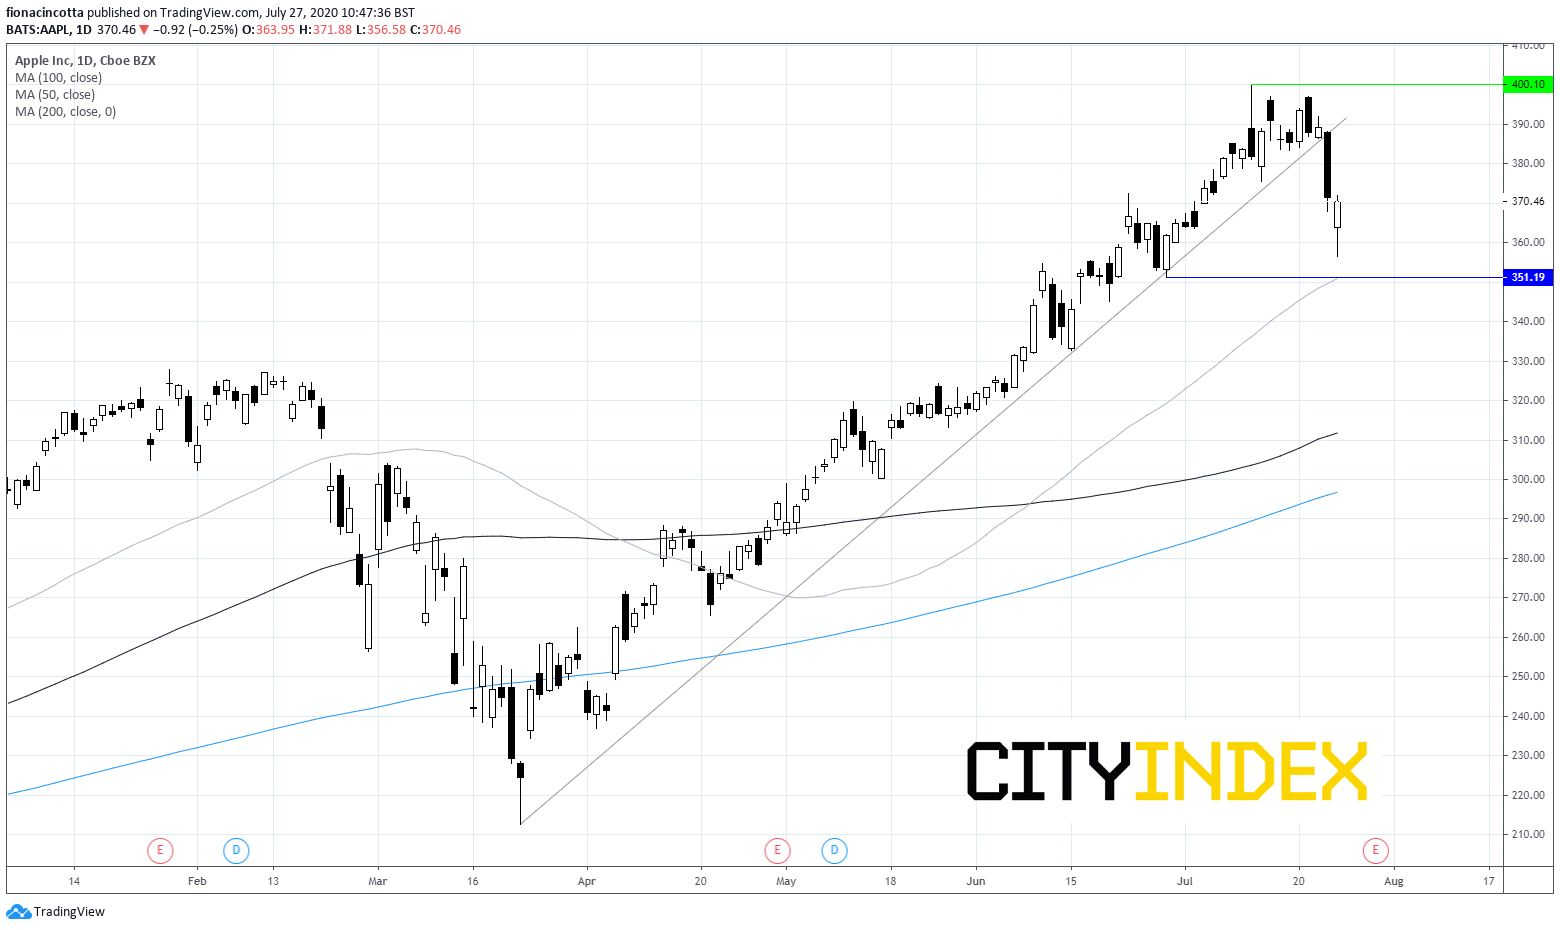
Apple is due to report Q3 earnings. It’s share price has had a phenomenal run since March lows but is showing signs of cracking heading into results. With expectations sky high the risk of disappointment also runs high. iPhone sales are forecast at $22.4 billion down by 13.8%, services and wearables are expected to see revenue grow 15% to $13.2 billion and 5% $5.97 billion respectively. If the service business segment does grow by 15% this would be the slowest rate of growth since Q3 2019, perhaps calling into question its sky high share price.
Expectations for quarterly EPS of $2.02 (-7.3%) on revenue of $51.7 billion (-3.8%)
Chart Thoughts
Apple is trading up 79% year to date. However, after reaching an all time high of $400, the stock has been in decline dropping through its ascending trendline and heads straight for its 50 day moving average at $350. Failure of this level to hold could see a deeper sell off back towards the $320 pre-covid level before opening the doors to 100 sma close to $310.
Amazon
The stock reports as it is trading more than 55% higher YTD boosted by its e-commerce strength and its AWS cloud platform. Costs will once again be under the spotlight in Q2 earnings, particularly after Jeff Bezos said that he was less focused on near term profits, instead prioritizing improving the customer experience. Earnings come at a time when investors are starting to rotate out of stay at home stocks into value stocks. Expectations are for EPS $1.63 on revenue of $63.40 billion.
Chart thoughts
Whilst Amazon might have dropped sharply across the previous week, the stock remains above its 50, 100 and 200 daily moving averages and just above its ascending trendline as it finds support at the key psychological $3000 mark. Should this level hold we could see the stock look to take on its all-time high of $3344.
On the flip side, immediate resistance from the ascending trendline can be seen around the $2920 level, prior to support at $2800 and around $2630.
StoneX Financial Ltd (trading as “City Index”) is an execution-only service provider. This material, whether or not it states any opinions, is for general information purposes only and it does not take into account your personal circumstances or objectives. This material has been prepared using the thoughts and opinions of the author and these may change. However, City Index does not plan to provide further updates to any material once published and it is not under any obligation to keep this material up to date. This material is short term in nature and may only relate to facts and circumstances existing at a specific time or day. Nothing in this material is (or should be considered to be) financial, investment, legal, tax or other advice and no reliance should be placed on it.
No opinion given in this material constitutes a recommendation by City Index or the author that any particular investment, security, transaction or investment strategy is suitable for any specific person. The material has not been prepared in accordance with legal requirements designed to promote the independence of investment research. Although City Index is not specifically prevented from dealing before providing this material, City Index does not seek to take advantage of the material prior to its dissemination. This material is not intended for distribution to, or use by, any person in any country or jurisdiction where such distribution or use would be contrary to local law or regulation.
For further details see our full non-independent research disclaimer and quarterly summary.
CFDs are complex instruments and come with a high risk of losing money rapidly due to leverage. 69% of retail investor accounts lose money when trading CFDs with this provider. You should consider whether you understand how CFDs work and whether you can afford to take the high risk of losing your money. CFD and Forex Trading are leveraged products and your capital is at risk. They may not be suitable for everyone. Please ensure you fully understand the risks involved by reading our full risk warning.
City Index is a trading name of StoneX Financial Ltd. Head and Registered Office: 1st Floor, Moor House, 120 London Wall, London, EC2Y 5ET. StoneX Financial Ltd is a company registered in England and Wales, number: 05616586. Authorised and regulated by the Financial Conduct Authority. FCA Register Number: 446717.
City Index is a trademark of StoneX Financial Ltd.
The information on this website is not targeted at the general public of any particular country. It is not intended for distribution to residents in any country where such distribution or use would contravene any local law or regulatory requirement.
© City Index 2024