DAX Potential bearish breakdown below 12900 on Middle East tensions
Medium-term technical outlook on DAX (Germany 30)
click to enlarge charts
This analysis is an update to our earlier weekly stock indices outlook report published on Mon, 06 Jan (click here for a recap).
Key Levels (1 to 3 weeks)
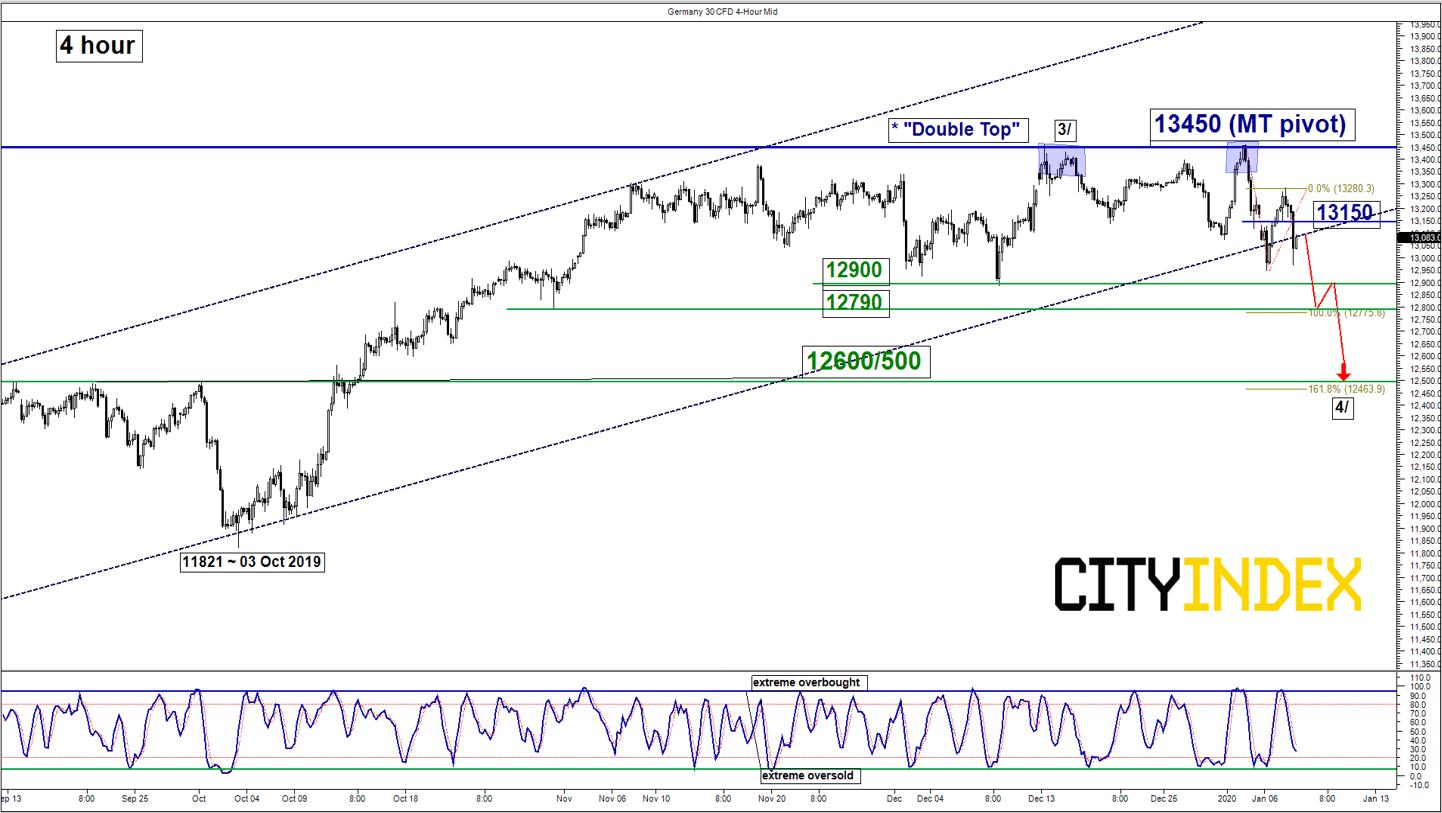
Intermediate resistance: 13150
Pivot (key resistance): 13450
Supports: 12900, 12790 & 12600/500
Next resistances: 13600/750 & 14115
Directional Bias (1 to 3 weeks)
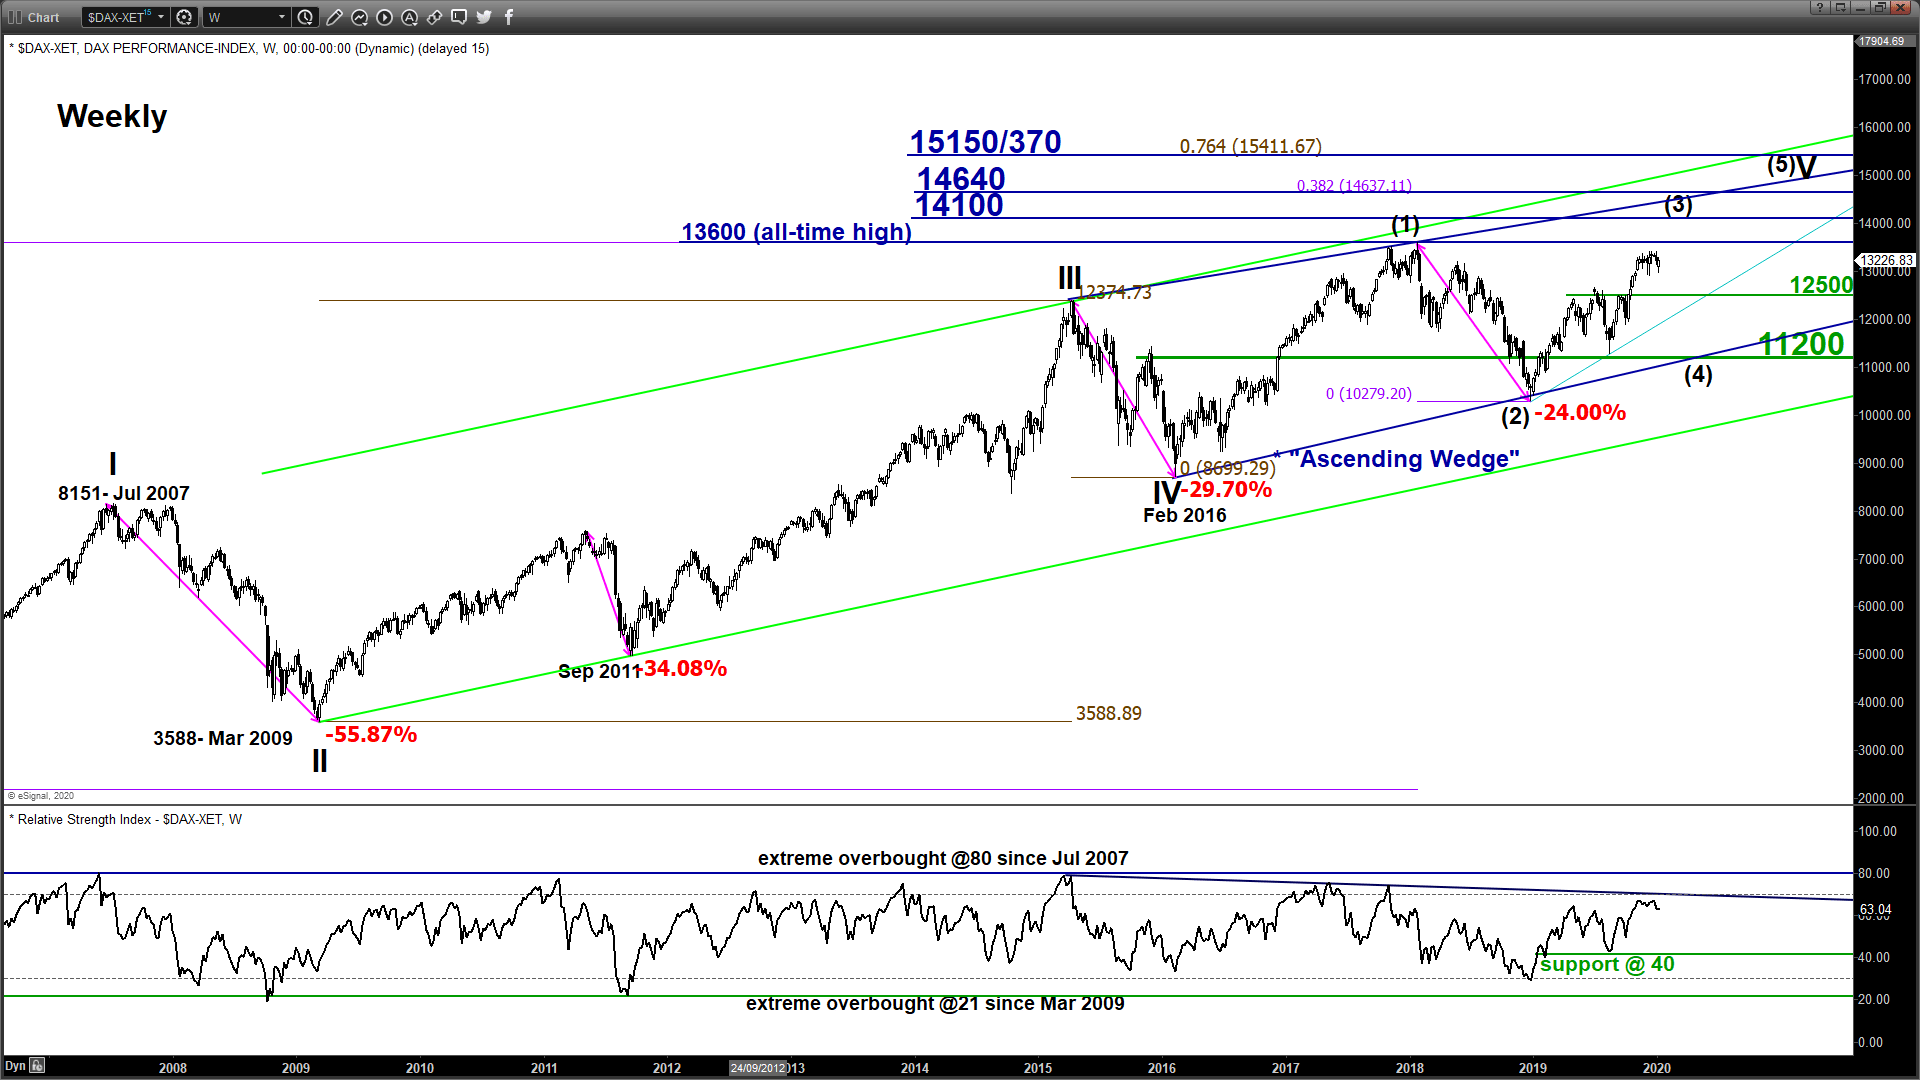
Key elements of the Germany 30 Index (proxy for the DAX futures) are now advocating for potential bearish breakdown below a 4-week old range configuration in place since 19 Nov 2019. Flip to a bearish bias below 13450 key medium-term pivotal resistance and a break below 12900 reinforces a potential corrective down move sequence within a major uptrend phase to target the next supports at 12790 and 12600/500 next.
On the flipside, a clearance above 13450 invalidates the bearish tone for a probe on the current all-time all high area of 13600/750. Only a daily close above 13750 opens up scope for a more pronounced rally to target the next resistance at 14115 (Fibonacci expansion cluster).
Key elements
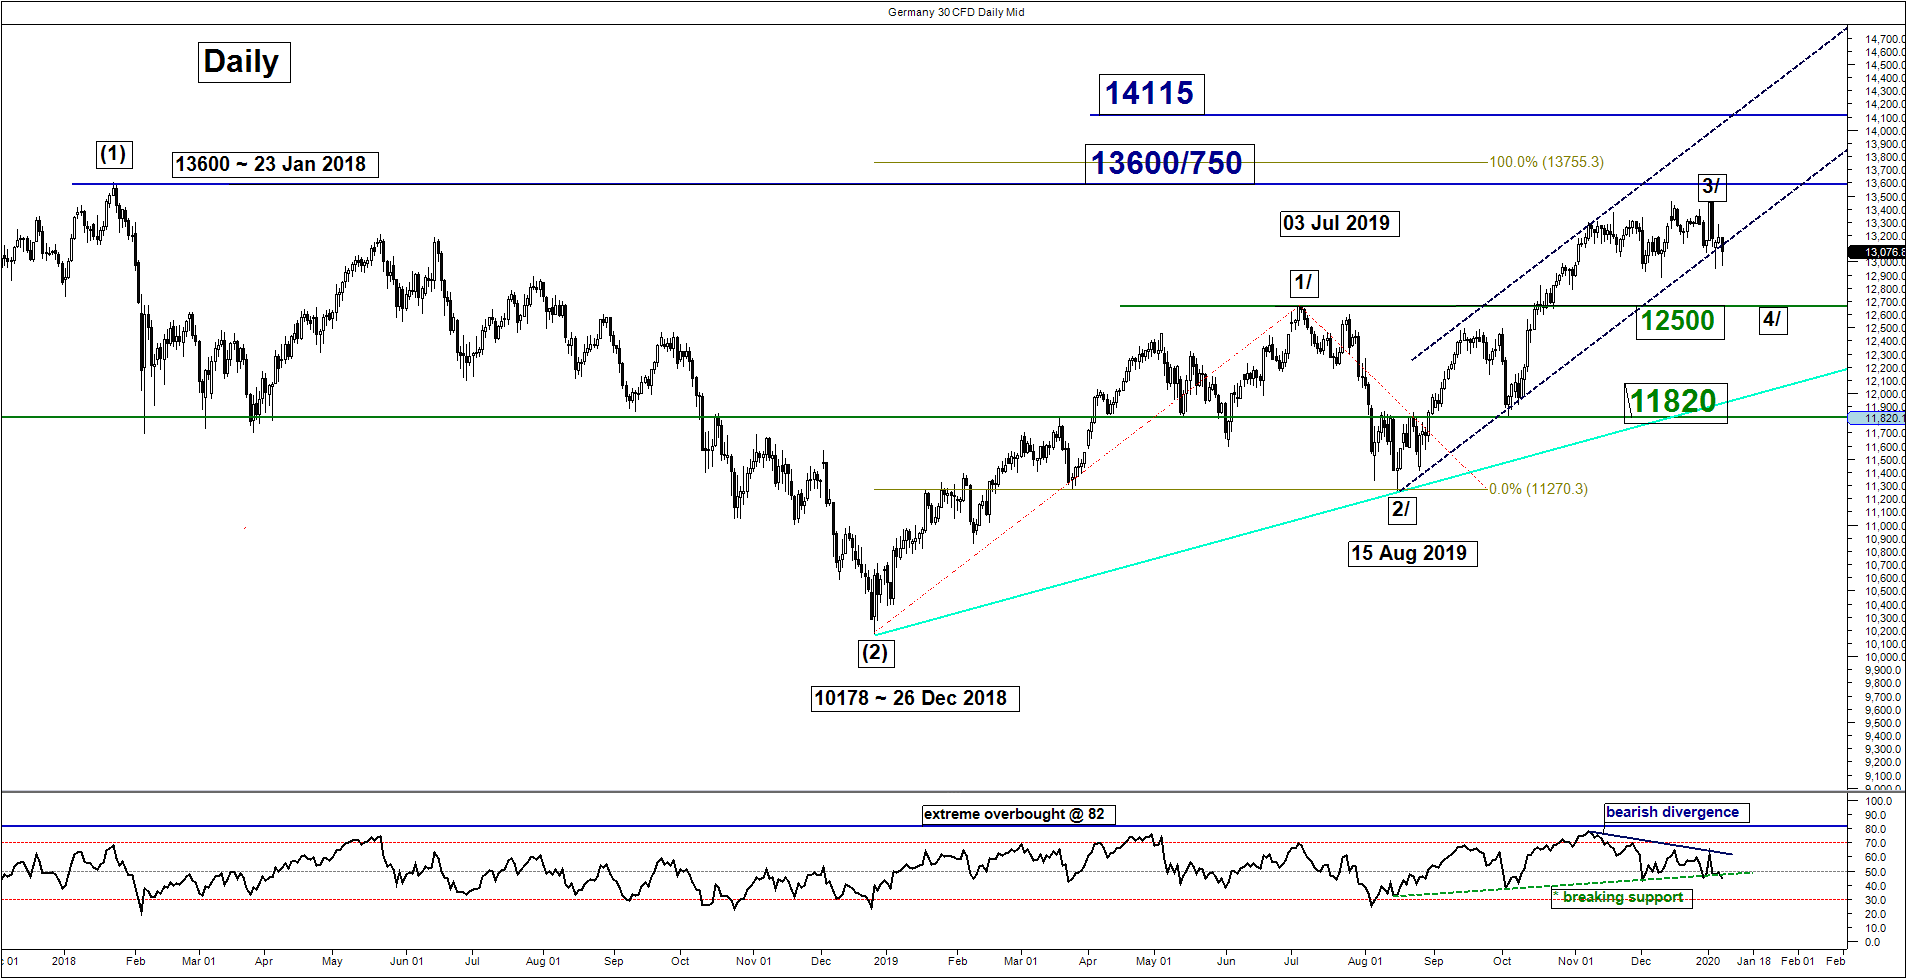
- Since its swing high of 19 Nov 2019, the price action of the Index has traced out a medium-term bearish reversal “Double Top” configuration with its neckline support at 12900 and potential bearish breakout exit target at 12600 that confluences with the former swing high areas of 13 Sep/22 Sep/01 Oct 2019.
- The daily RSI oscillator is now looking vulnerable to the downside as it is testing a key corresponding support at 45 level the 3rd time with a prior bearish divergence signal. These observations suggest medium-term downside momentum of price action is building up.
- The 12600/500 medium-term support is also defined by a Fibonacci cluster (38.2% retracement of the prior multi-month up move from 15 Aug 2019 low to 02 Jan 2020 low & 1.618 expansion of the latest slide from 03 Jan 2020 high to 06 Jan 2020 low projected from 07 Jan 2020 high.
Charts are from City Index Advantage TraderPro & eSignal
StoneX Financial Ltd (trading as “City Index”) is an execution-only service provider. This material, whether or not it states any opinions, is for general information purposes only and it does not take into account your personal circumstances or objectives. This material has been prepared using the thoughts and opinions of the author and these may change. However, City Index does not plan to provide further updates to any material once published and it is not under any obligation to keep this material up to date. This material is short term in nature and may only relate to facts and circumstances existing at a specific time or day. Nothing in this material is (or should be considered to be) financial, investment, legal, tax or other advice and no reliance should be placed on it.
No opinion given in this material constitutes a recommendation by City Index or the author that any particular investment, security, transaction or investment strategy is suitable for any specific person. The material has not been prepared in accordance with legal requirements designed to promote the independence of investment research. Although City Index is not specifically prevented from dealing before providing this material, City Index does not seek to take advantage of the material prior to its dissemination. This material is not intended for distribution to, or use by, any person in any country or jurisdiction where such distribution or use would be contrary to local law or regulation.
For further details see our full non-independent research disclaimer and quarterly summary.
CFDs are complex instruments and come with a high risk of losing money rapidly due to leverage. 69% of retail investor accounts lose money when trading CFDs with this provider. You should consider whether you understand how CFDs work and whether you can afford to take the high risk of losing your money. CFD and Forex Trading are leveraged products and your capital is at risk. They may not be suitable for everyone. Please ensure you fully understand the risks involved by reading our full risk warning.
City Index is a trading name of StoneX Financial Ltd. Head and Registered Office: 1st Floor, Moor House, 120 London Wall, London, EC2Y 5ET. StoneX Financial Ltd is a company registered in England and Wales, number: 05616586. Authorised and regulated by the Financial Conduct Authority. FCA Register Number: 446717.
City Index is a trademark of StoneX Financial Ltd.
The information on this website is not targeted at the general public of any particular country. It is not intended for distribution to residents in any country where such distribution or use would contravene any local law or regulatory requirement.
© City Index 2024