


S&P 500 – At risk of shaping a multi-week corrective decline
click to enlarge charts
Key Levels (1 to 3 weeks)
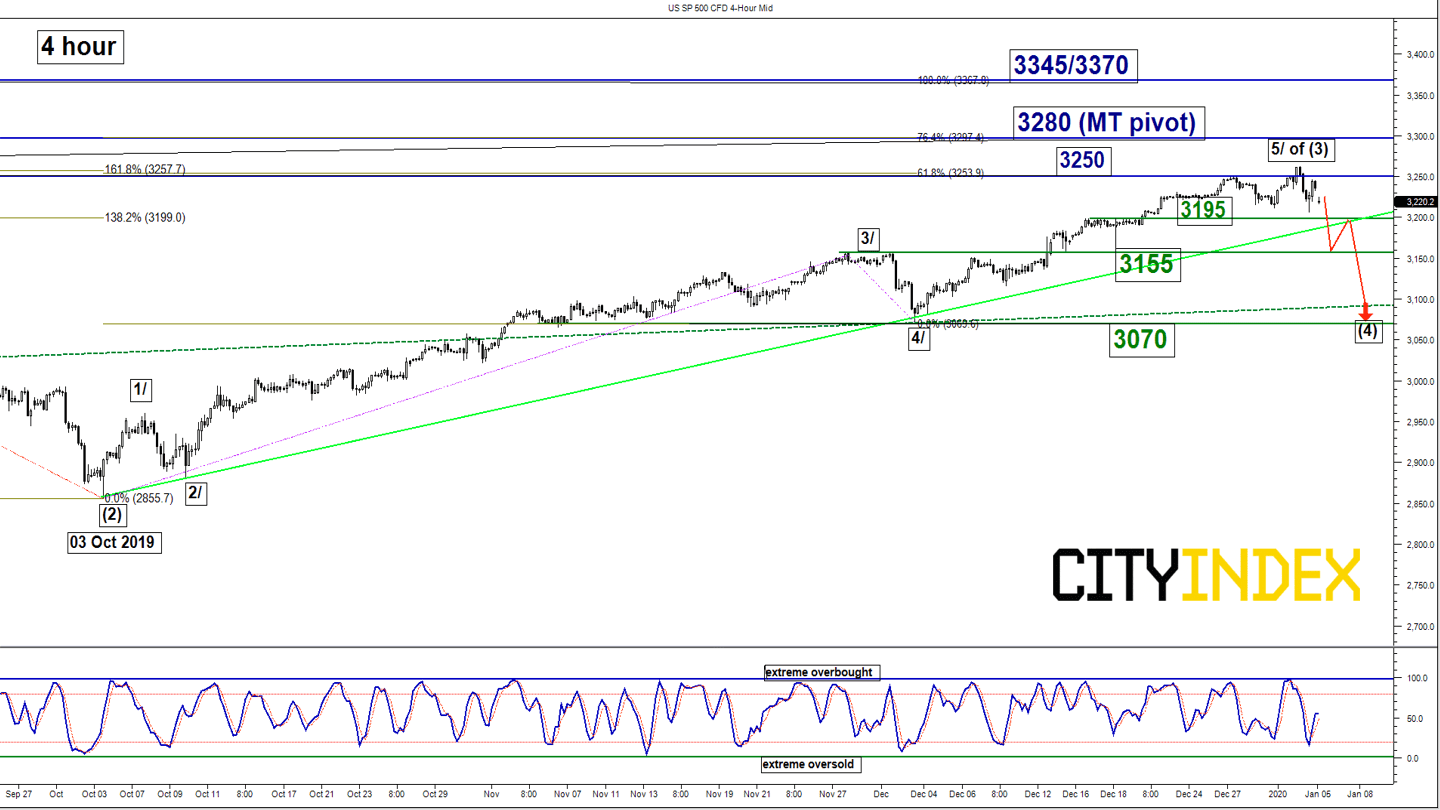
Intermediate resistance: 3250
Pivot (key resistance): 3280
Supports: 3195, 3155 & 3070
Next resistance: 3345/3370
Directional Bias (1 to 3 weeks)
The SP 500 Index (proxy for the S&P 500 futures) was the “sole” major stock index that had managed to print a fresh all-time high in the last 2 weeks of 2019 and rallied to our first target at 3250. Also, it had almost hit the major resistance/inflection level of 3280 (printed an intraday high of 3262 on 03 Jan 2020 during the Asian session) as per highlighted in our previous report (click here for a recap).
Right, the Index is now at risk of undergoing a potential corrective down move sequence within a major uptrend phase. Flip to a bearish bias in any bounces below 3280 pivotal resistance a break below 3195 reinforces a multi-week decline to target the next supports at 3155 and 3070 before the next potential impulsive upleg sequence unfolds.
On the flipside, a clearance with a daily close above 3280 invalidates the bearish scenario for a continuation of the rally to target the next resistance zone of 3345/3370 (Fibonacci expansion cluster).
Key elements
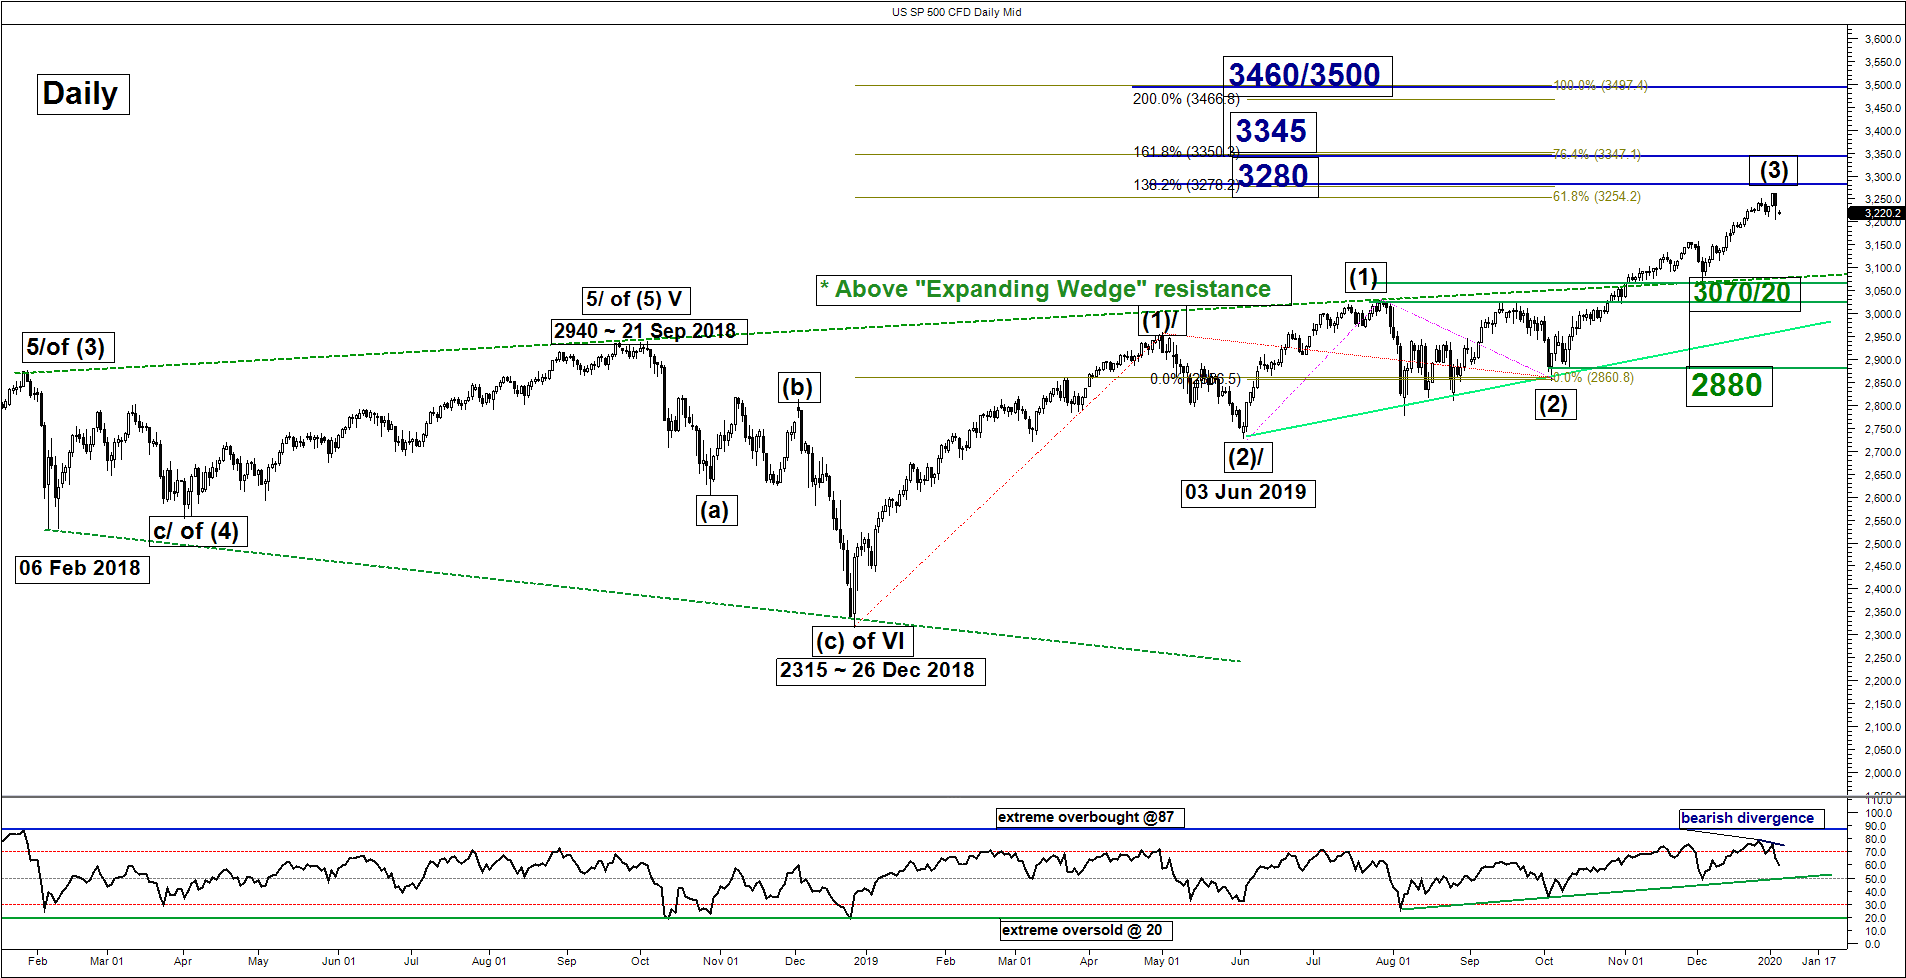
- The daily RSI oscillator has flashed a bearish divergence signal at its overbought region which indicates that the medium-term upside momentum of price action has waned.
- Elliot Wave/fractal analysis suggests that the intermediate degree impulsive upleg wave (3) sequence may have ended and the Index now is at risk of shaping a 1-3 weeks of corrective down move wave (4) sequence.
- The significant medium-term 3070 support is defined by the pull-back support of a former major “Expanding Wedge” resistance from Jan 2018, 03 Dec 2019 swing low and close to the 50% Fibonacci retracement of the recent multi-month up move from 03 Oct 2019 low to 03 Jan 2020 high.
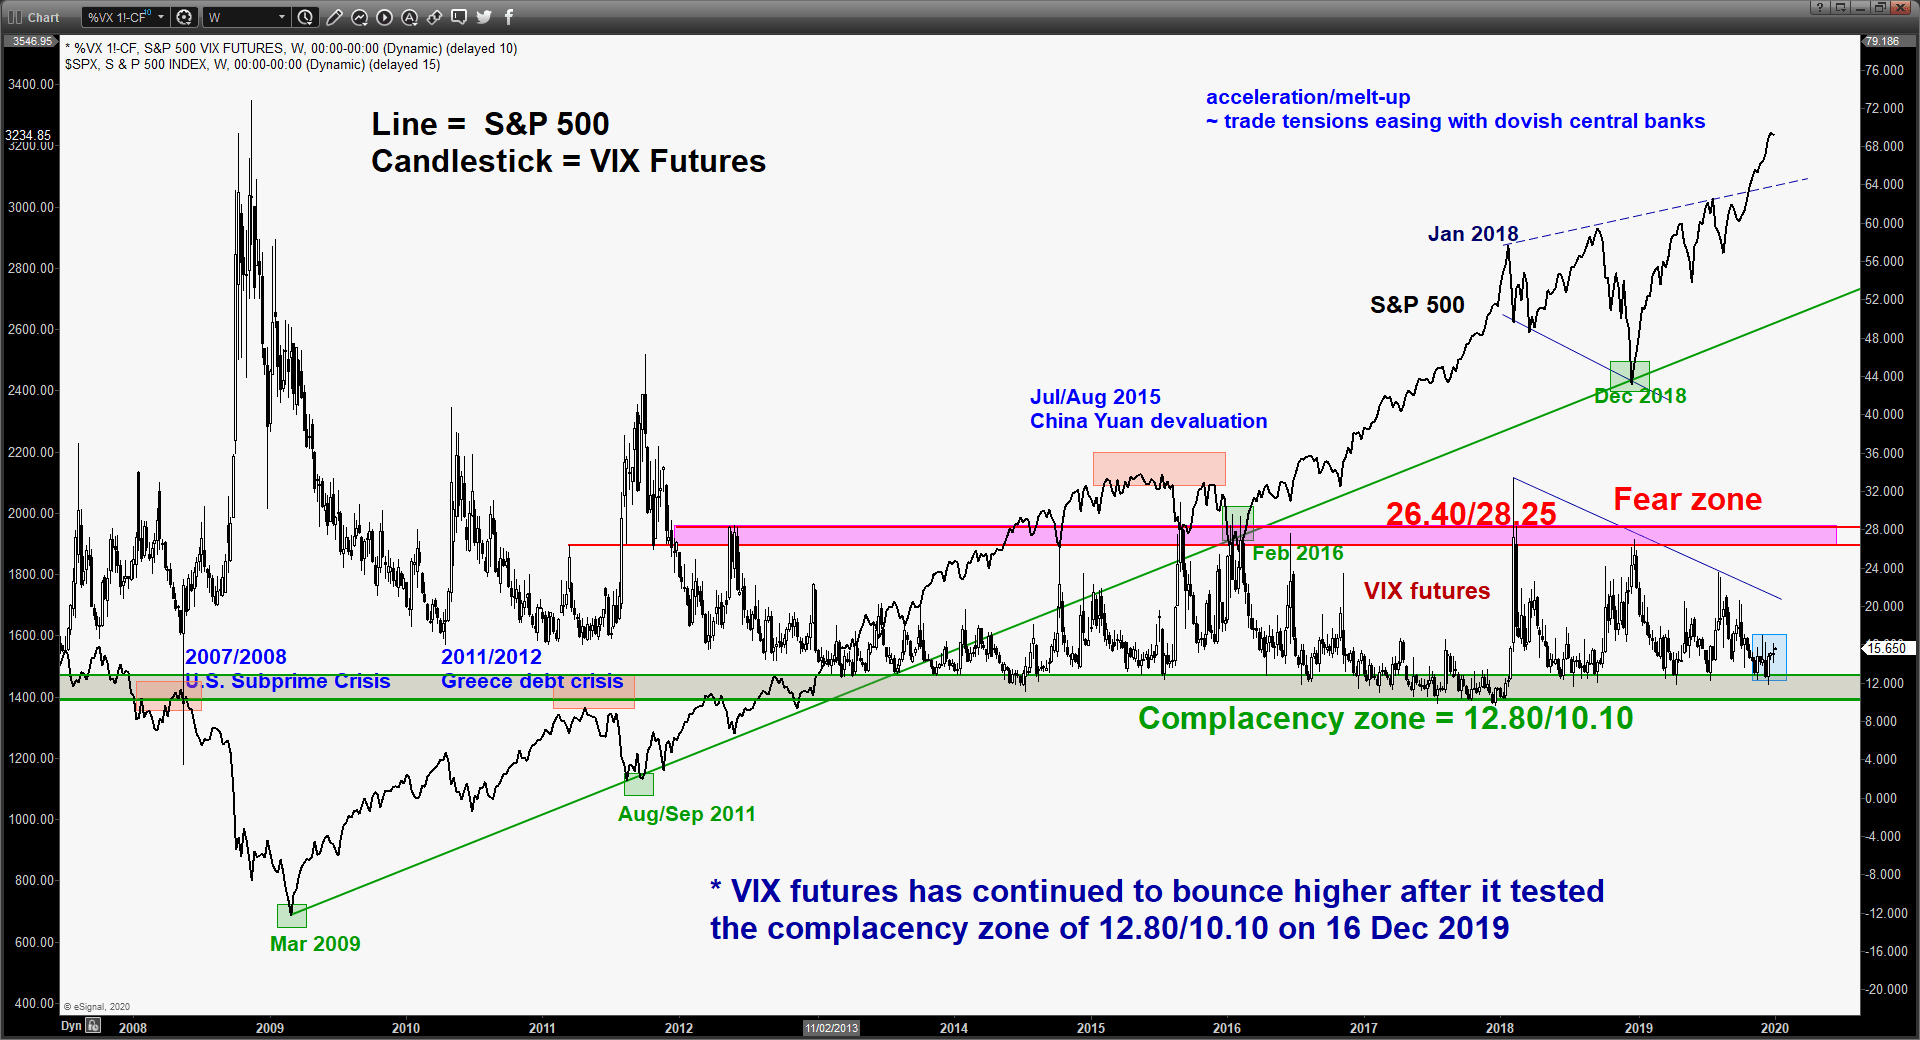
- From a contrary opinion perspective, the VIX futures has continued to shape a rebound in the past 2 weeks after it has hit the “complacency zone” of 12.80/10.10 on 16 Dec 2019. These observations suggest unwinding of long positions on the S&P 500 Index may materialise at a fast pace given the prior “high level of “complacency” as market participants ignore systematic risk.
Nikkei 225 – Further decline within major sideways configuration
click to enlarge charts
Key Levels (1 to 3 weeks)
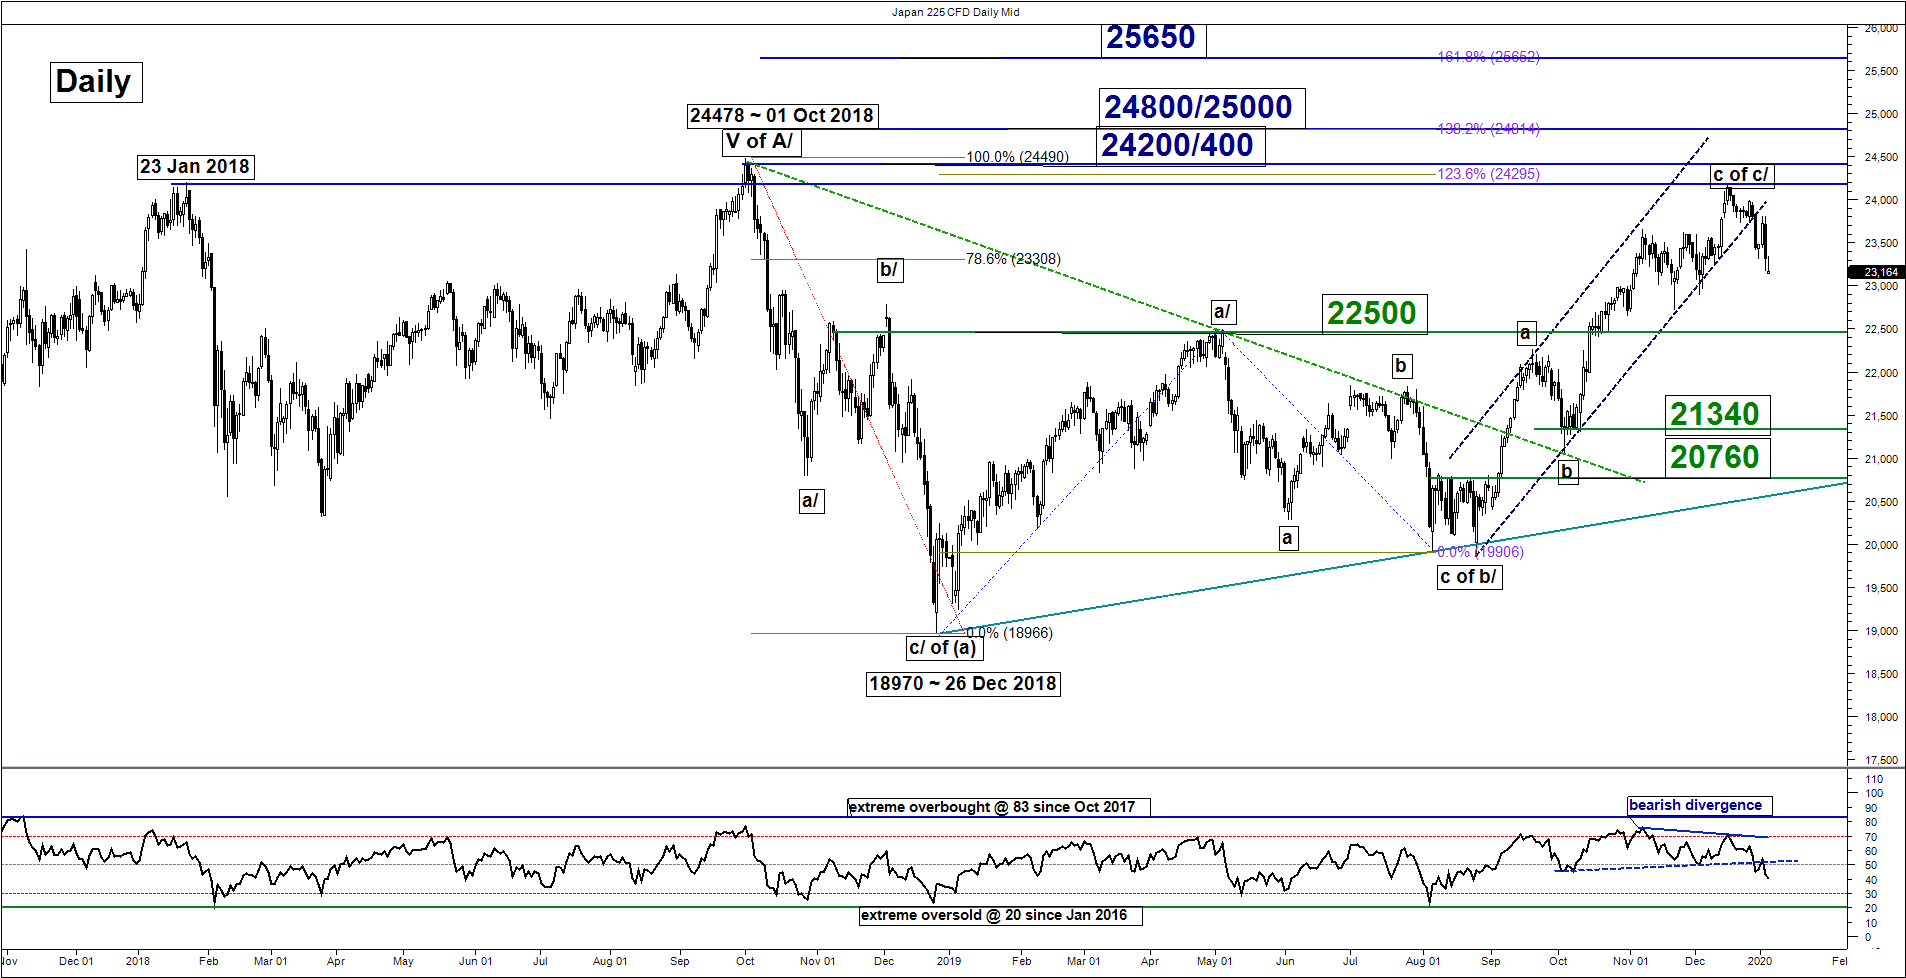
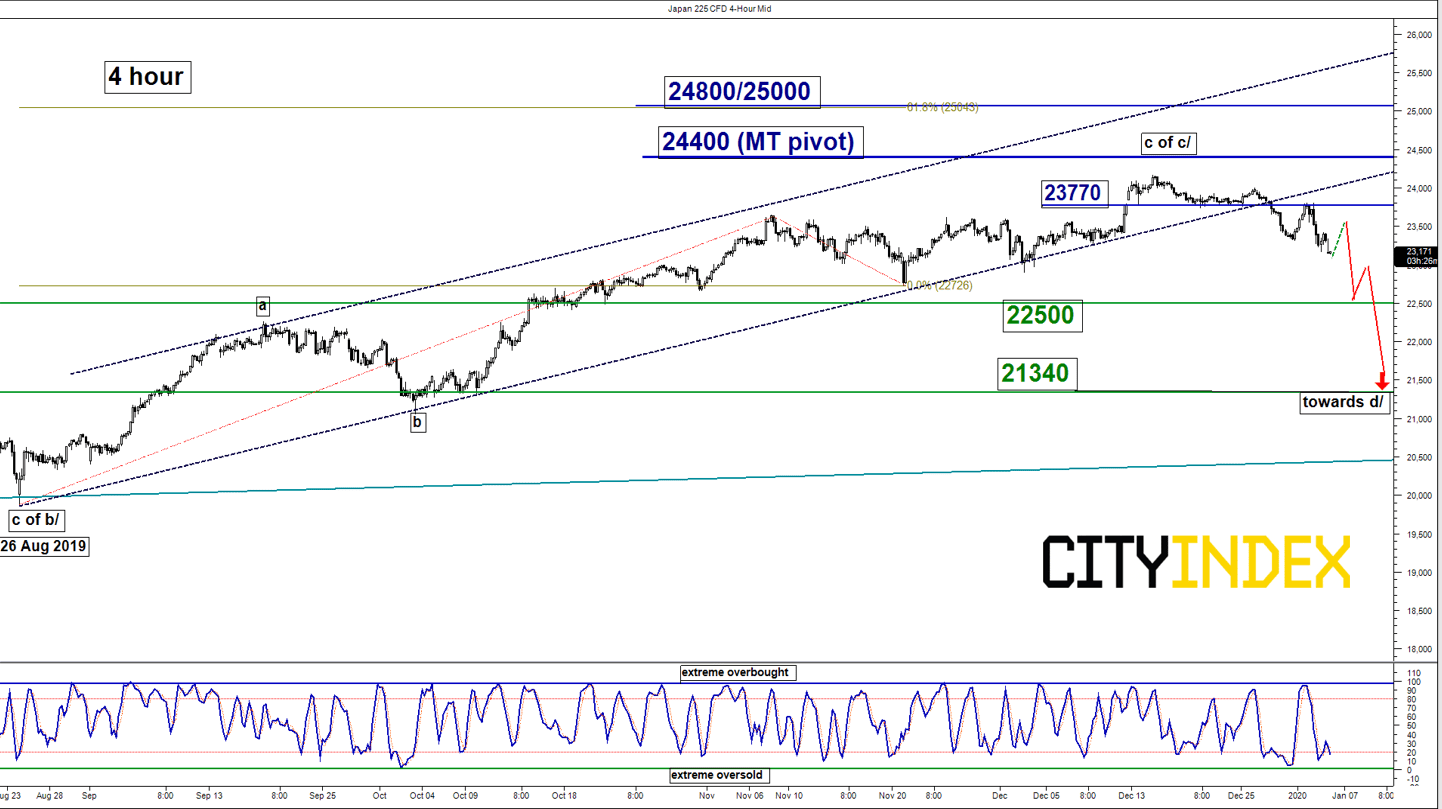
Intermediate resistance: 23770
Pivot (key resistance): 24400
Supports: 22500 & 21340
Next resistance: 24800/25000 & 25650
Directional Bias (1 to 3 weeks)
The Japan 225 Index (proxy for the Nikkei 225 futures) staged a bearish breakdown below the 23540 key medium-term pivotal support that was highlighted in our previous report; the bullish scenario towards 24800/25000 and 25650 has been invalidated.
Right now, the Index seems to be undergoing another leg of decline within a major sideways configuration in place since 23 Jan 2018; flip to a bearish bias below 24200/400 medium-term pivotal resistance for a potential slide towards the next supports at 22500 and 21340 next.
However, a clearance with a daily close above 24400 revives the bullish tone for a breakout to target 24800/25000 follow by 25650 next.
Key elements
- The daily RSI oscillator has staged a bearish breakdown below a corresponding significant support at the 50 level after a bearish divergence signal at the overbought region which indicates medium-term upside momentum of price action has waned.
- The intermediate resistance of 23770 is defined by the pull-back resistance of a former ascending channel support from 26 Aug 2019 low.
- The 21340 significant medium-term support is defined by the 03 Oct 2019 swing low and close to the 61.8% Fibonacci retracement of recent multi-month up move from 26 Aug 2019 low to 16 Dec 2019 high.
Hang Seng – Bulls rejected right below 29000 major resistance
click to enlarge charts
Key Levels (1 to 3 weeks)
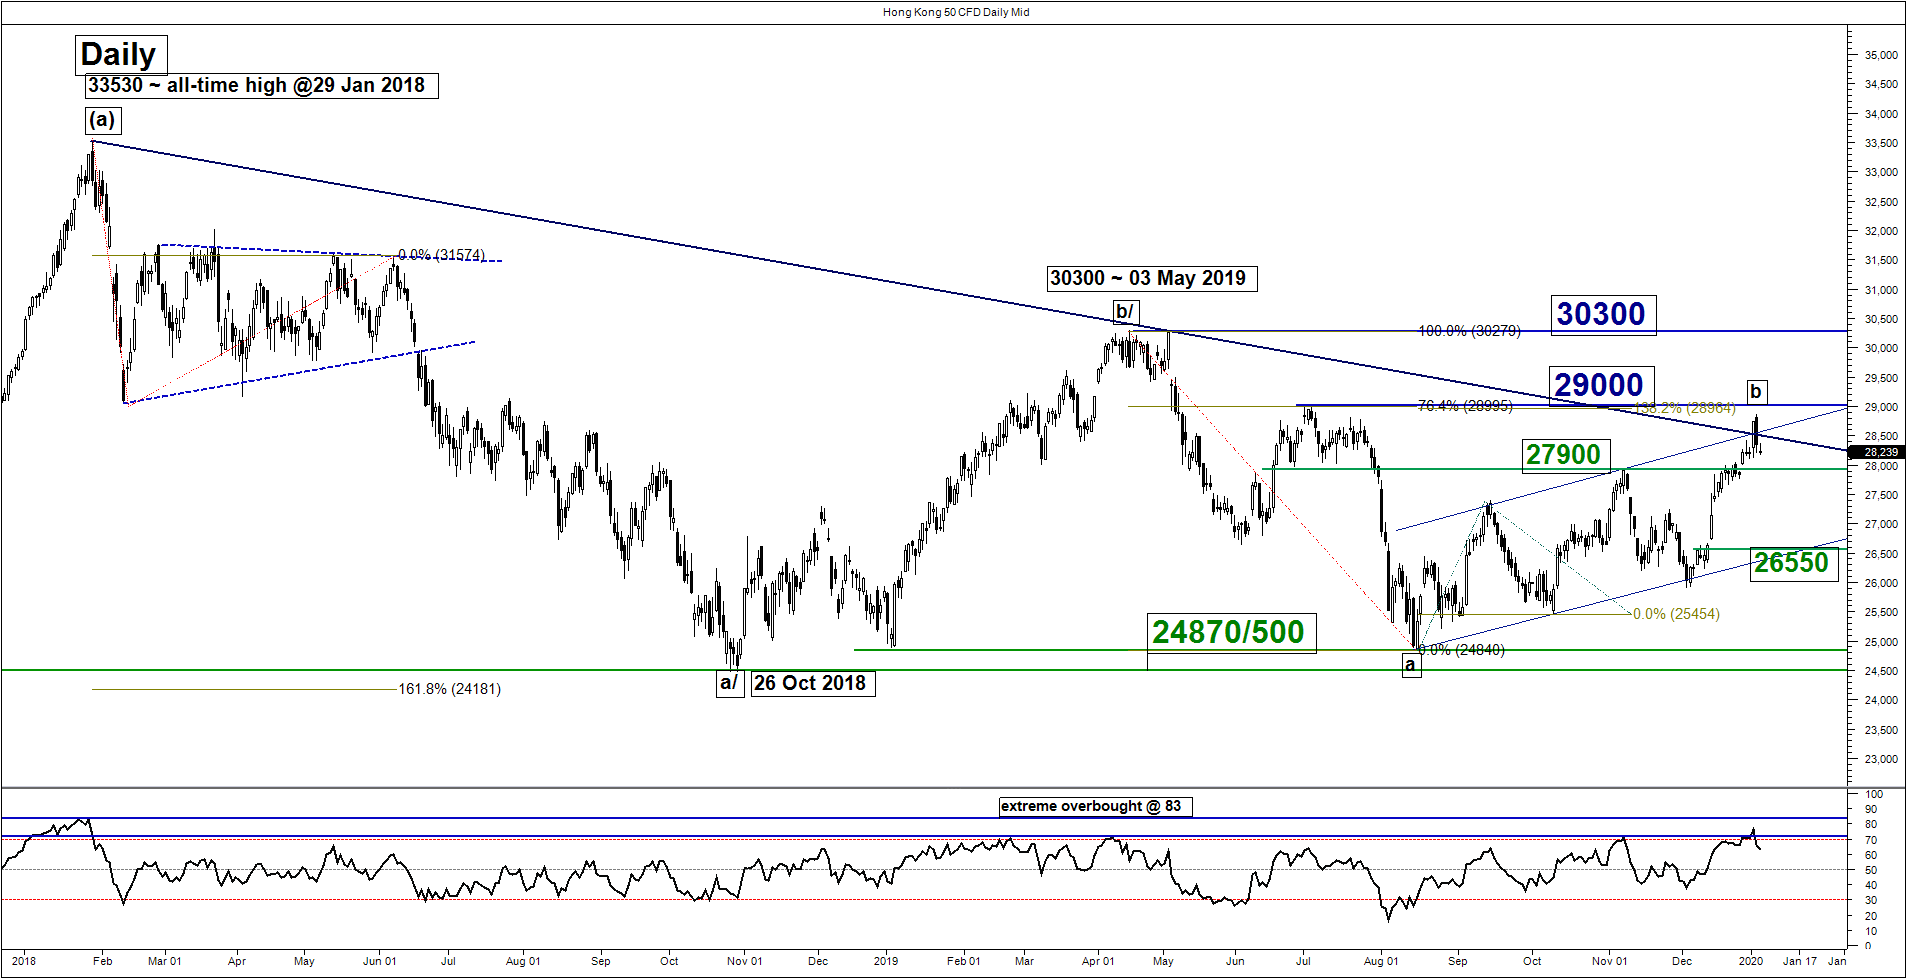
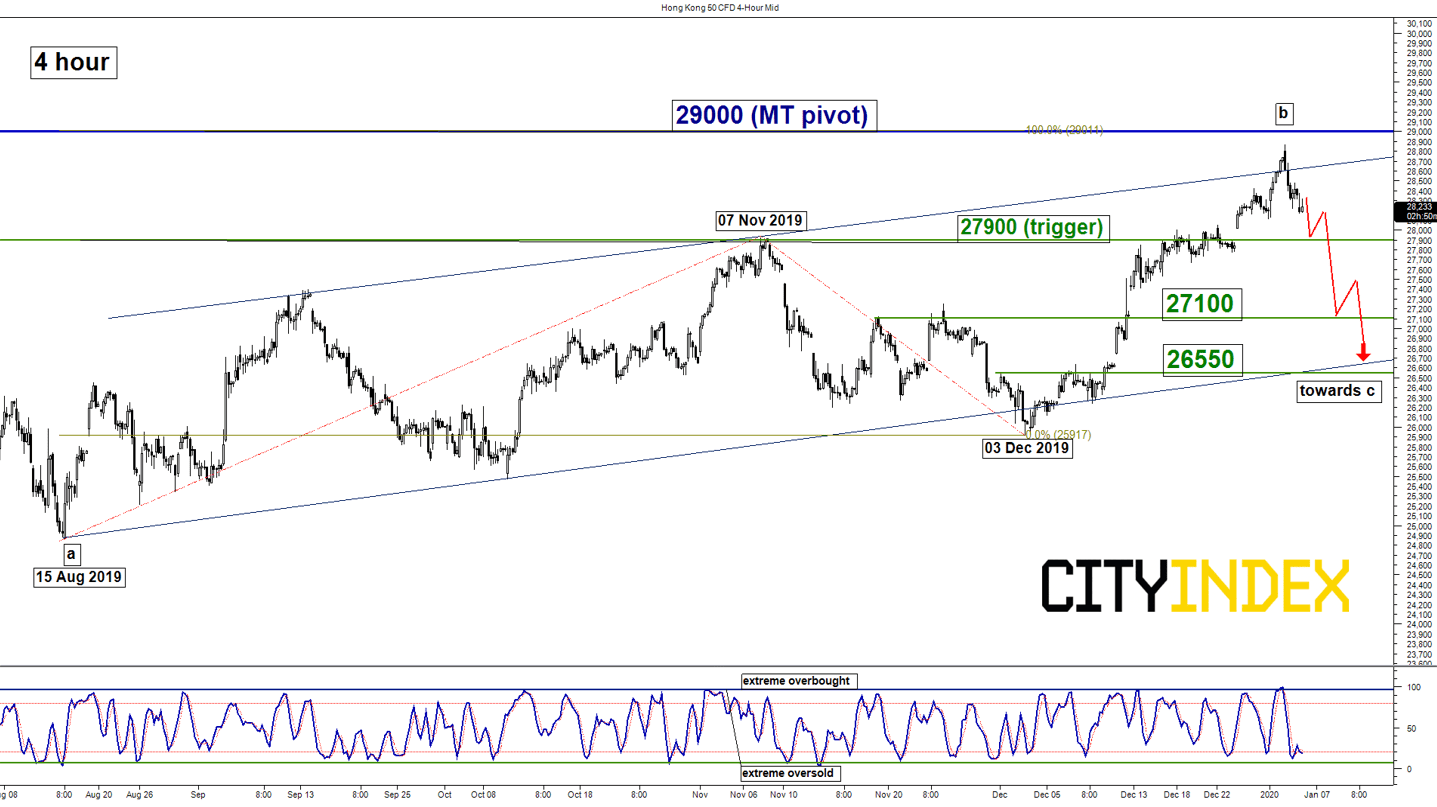
Pivot (key resistance): 29000
Supports: 27900, 27100 & 26550
Next resistance: 30300
Directional Bias (1 to 3 weeks)
The Hong Kong 50 Index (proxy for Hang Seng Index futures) staged a breakout above the 28200-upper limit of the neutrality zone and rallied towards the 29000 upside target/resistance as per highlighted in our previous report; it printed an intraday high of 28863 on 03 Jan 2020.
Flip to a bearish bias below 29000 pivotal resistance and a break below 27900 reinforces a further potential slide towards the next supports at 27100 and 26550 within a major complex range configuration in place since 26 Oct 2018.
On the flipside, a clearance with a daily close above 29000 invalidates the bearish scenario for a bullish breakout to target the next resistance at 30300 in the first step.
Key elements
- The recent push up towards 29000 major resistance has been rejected by a descending trendline in place since its current all-time high of 33530 printed on 29 Jan 2018, swing area of 02/03 Jul 2019 and a Fibonacci retracement/expansion cluster.
- In addition, the price action of the Index has formed a bearish daily reversal candlestick pattern, “Dark Cloud Cover” on 03 Jan 2020 coupled with the daily RSI oscillator that has just exited from the overbought region.
- The 26550 medium-term support is defined by the ascending range support from 15 Aug 2018 low and the 76.4% Fibonacci retracement of the recent up move from 03 Dec 2019 low to 03 Jan 2020 high.
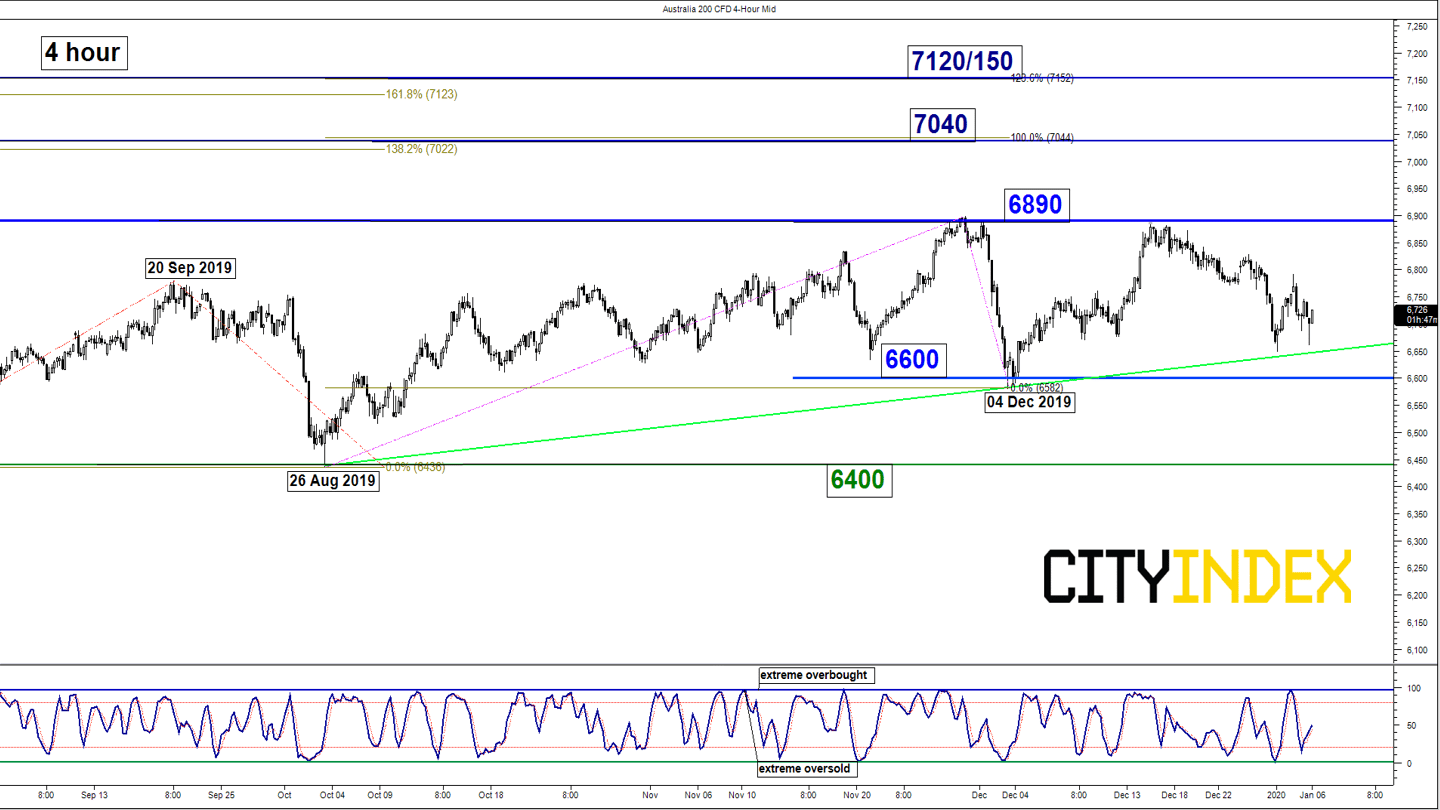
ASX 200 – Stuck in a range
click to enlarge charts
Key Levels (1 to 3 weeks)
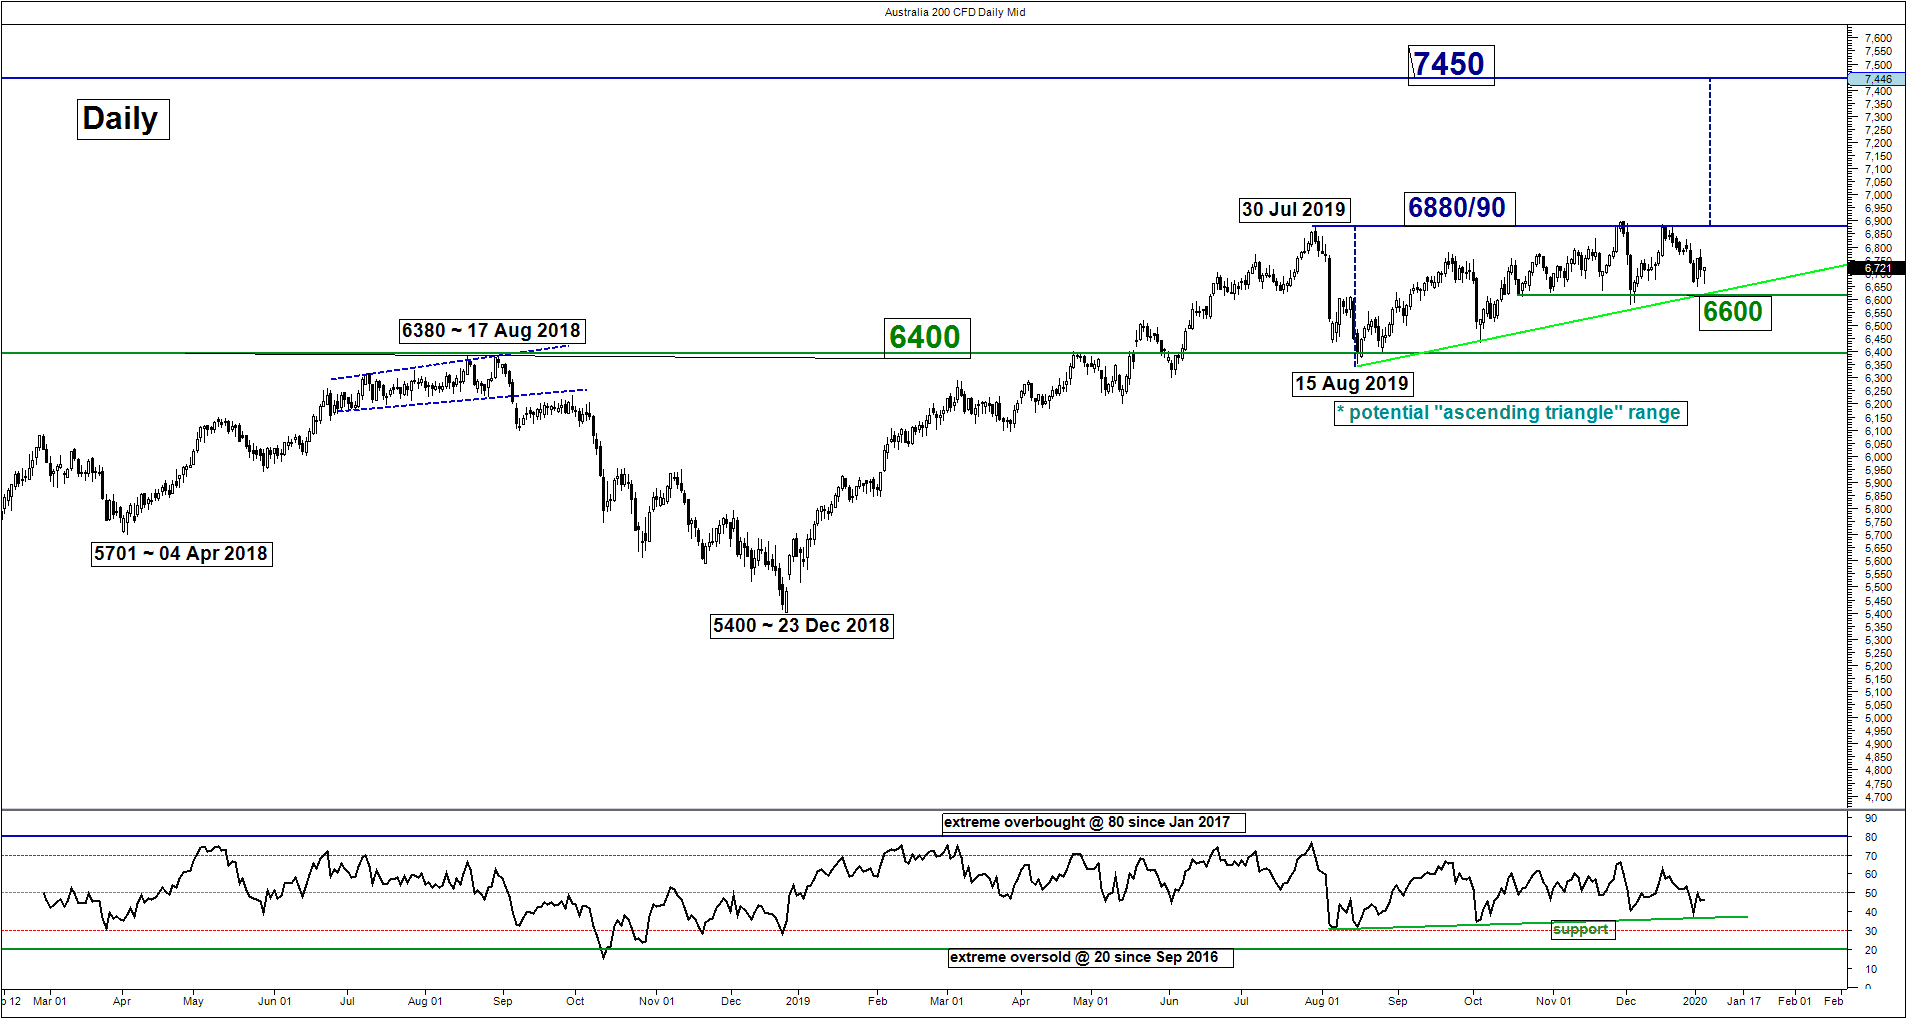
Resistances: 6890, 7040 & 7120/150
Supports: 6600 & 6400
Directional Bias (1 to 3 weeks)
The Australia 200 Index (proxy for the ASX 200 futures) has continued to get rejected around its all-time high area/resistance of 6890 for the 3rd time on 16 Dec 2019.
Mix elements prevail, flip to a neutral stance between 6600 and 6890. Only a clearance with a daily close above 6890 validates a bullish breakout from the “ascending triangle” range configuration in place since 30 Jul 2019 for further potential up move to target 7040 and 7120/150 next.
On the flipside, a break below 6600 invalidates the “ascending triangle” configuration for a further slide towards the next support at 6400.
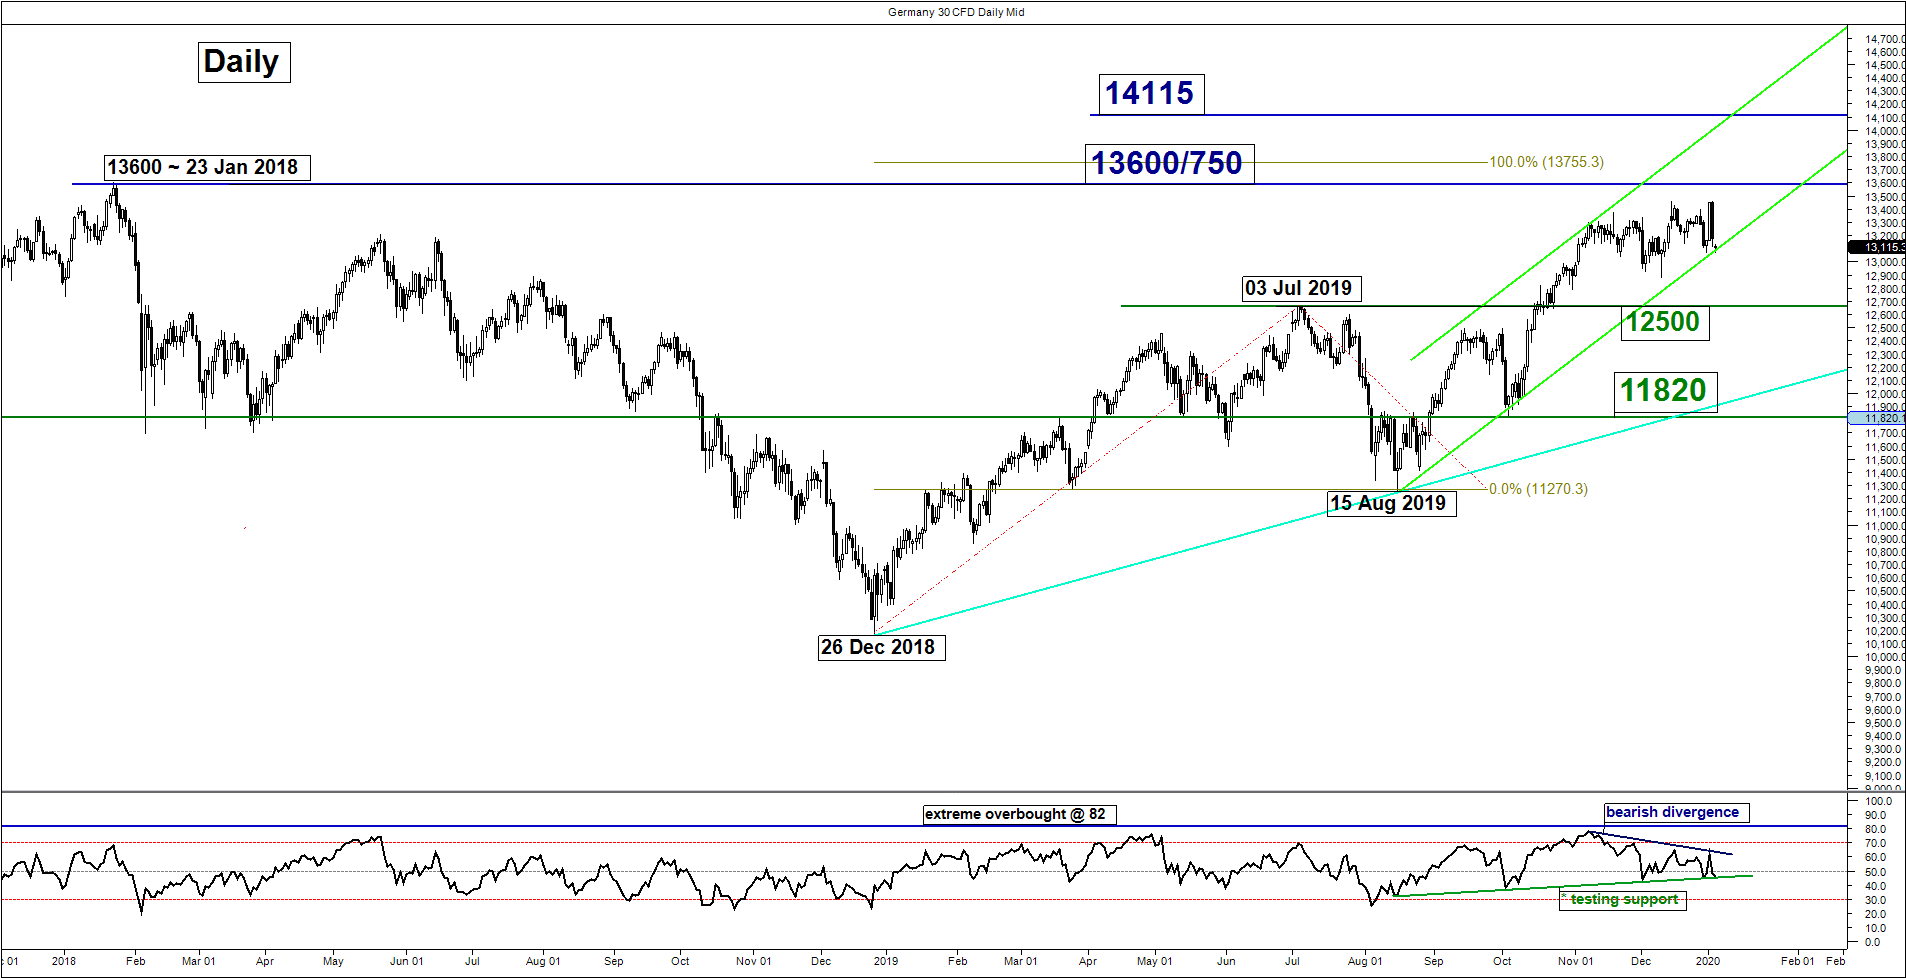
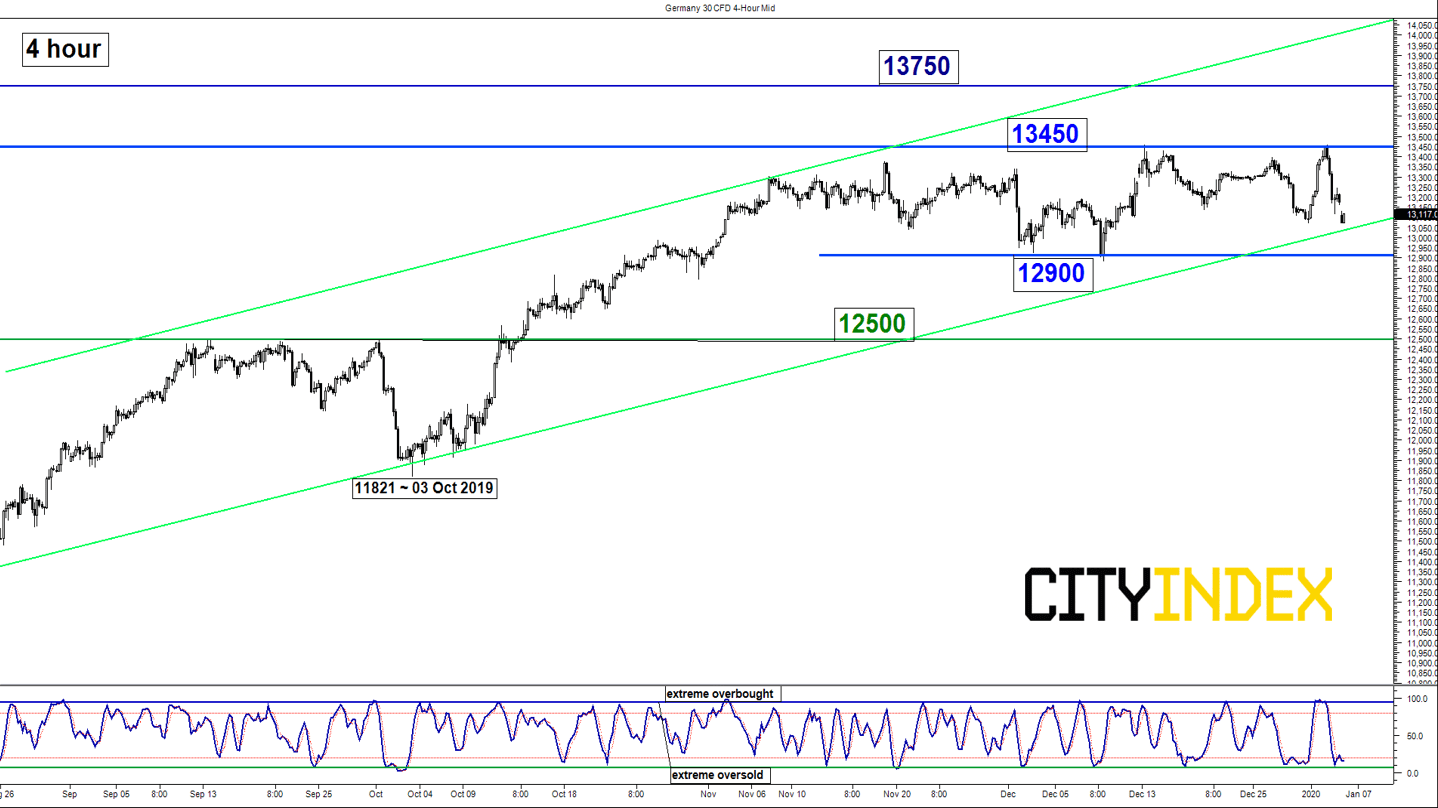
DAX – Mix elements; turn neutral first
click to enlarge charts
Key Levels (1 to 3 weeks)
Resistances: 13450, 13600/750 & 14115
Supports: 12900 & 12500
Directional Bias (1 to 3 weeks)
The Germany 30 Index (proxy for the DAX futures) has continued to churn sideways in above the 12900 key medium-term pivotal support as per highlighted in the previous report.
Right now, it is exhibiting mix elements as the daily RSI oscillator is testing a significant corresponding support at the 45 level with a prior bearish divergence signal that indicates a slowdown in medium-term upside momentum.
In addition, given the bearish configurations seen in the S&P 500, we do not have the conviction to maintain the bullish bias for the Germany 30 Index. Thus, prefer to turn neutral first at this juncture between 13450 and 12900 (the range configuration in place since 19 Nov 2019). A break below 12900 validates a potential corrective decline towards the next support at 12500. On the flipside, a clearance above 13450 sees a further push up to retest the all-time high area of 13600/750 and only a daily close above 13750 opens up scope for a further rally to target the next resistance at 14115 (Fibonacci expansion cluster & upper boundary the ascending channel in place since 15 Aug 2019 low).
Charts are from City Index Advantage TraderPro & eSignal
Latest market news
Latest Germany 40 articles
February 20, 2024 11:00 AM
January 17, 2024 12:25 PM
January 10, 2024 12:00 PM
November 1, 2023 12:19 PM