Daily Forex Technical Trend Bias Key Levels Tues 18 Jun
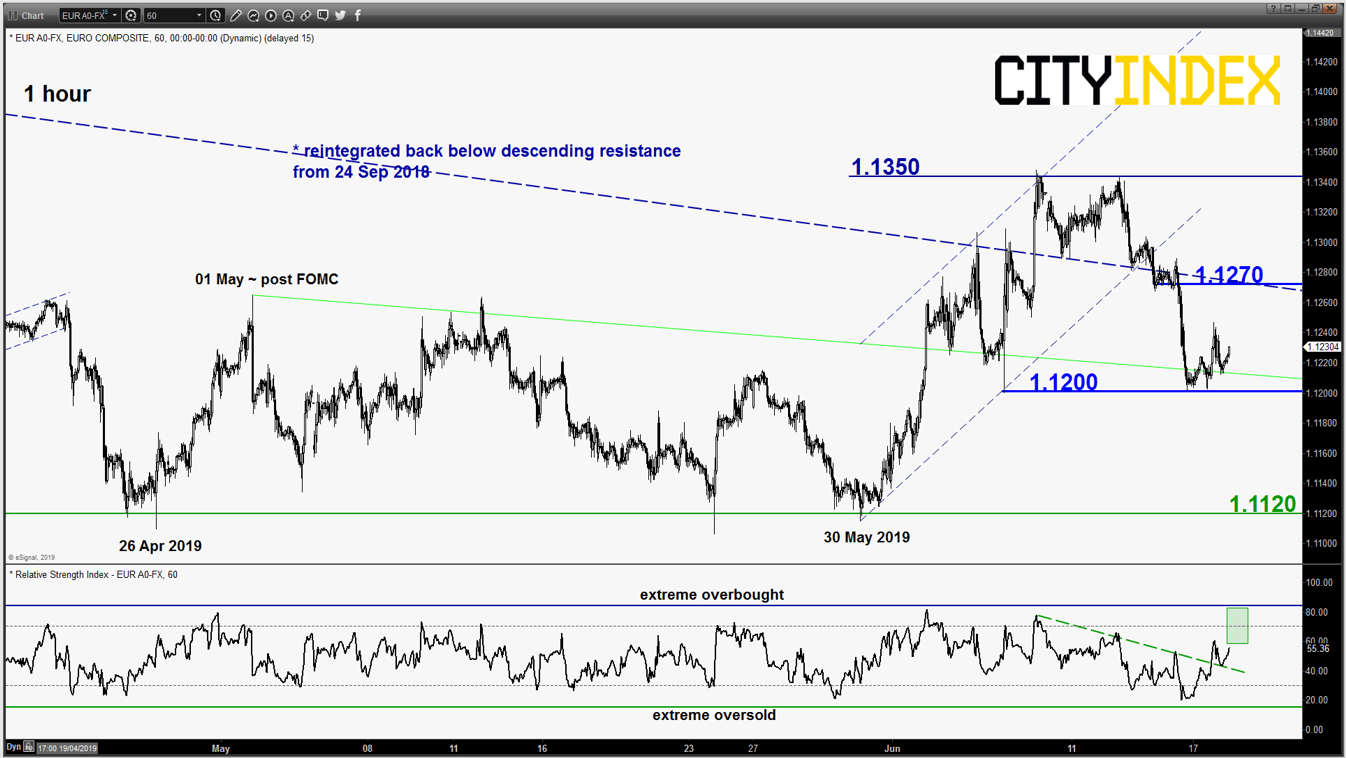
EUR/USD – Sideways, watch 1.1270 upper limit range
click to enlarge chart
- Tumbled down as expected on last Fri, 14 Jun and hit the downside target/support of 1.1215 as per highlighted in our previous report (click here for a recap). Right now, the price action has managed to find an interim support at 1.1215/1.1200 (the minor pull-back support from 01 May/the previous post FOMC, 06 Jun 2019 intraday spiked down & the 61.8% retracement of the recent push up from 30 May low to 07 Jun 2019 high).
- In addition, the hourly RSI oscillator has turned positive and still has room to manoeuvre to the upside before it reaches an extreme overbought level. Thus, prefer to turn neutral now between 1.1270 and 1.1200. An hourly close above 1.1270 sees a squeeze up to retest the 07/08 Jun 2019 minor top of 1.1350. On the flipside, a break with an hourly close above 1.1200 opens up scope for a further potential push down to target the medium-term range support of 1.1120.
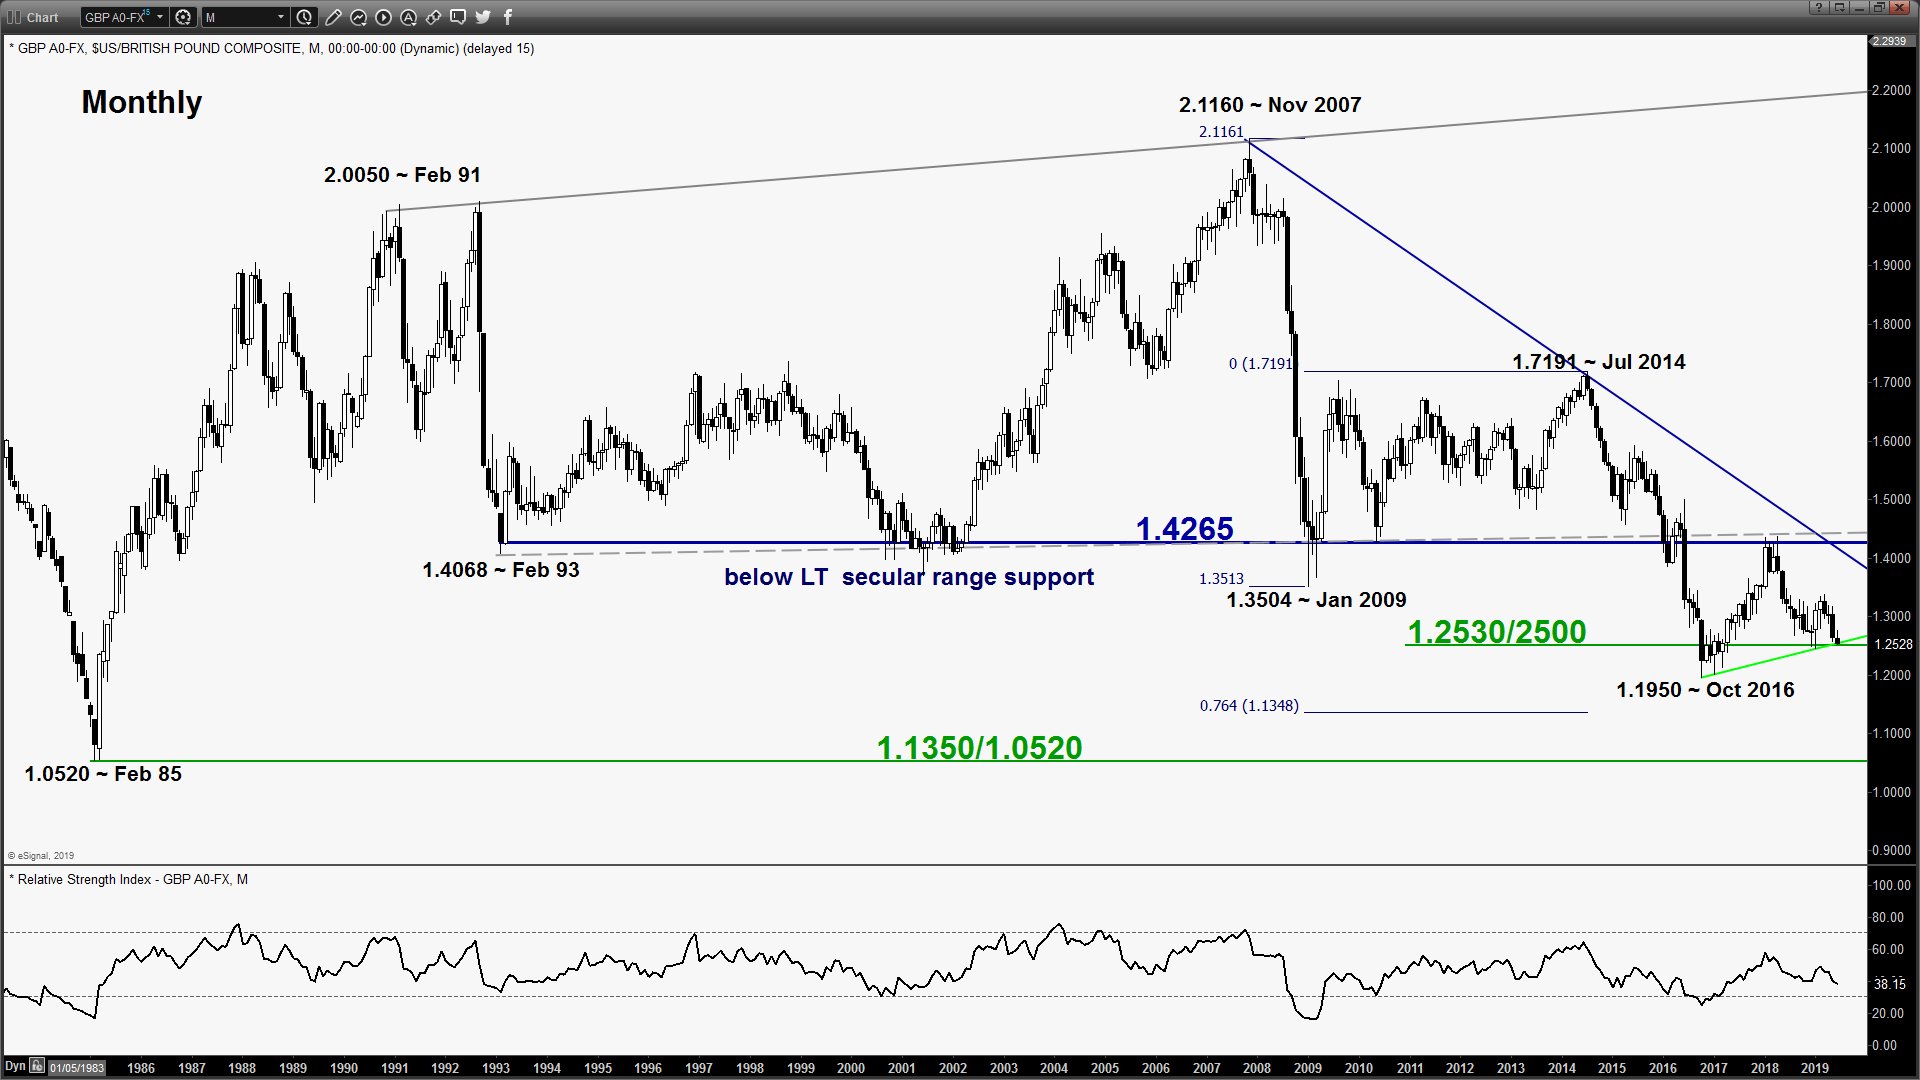
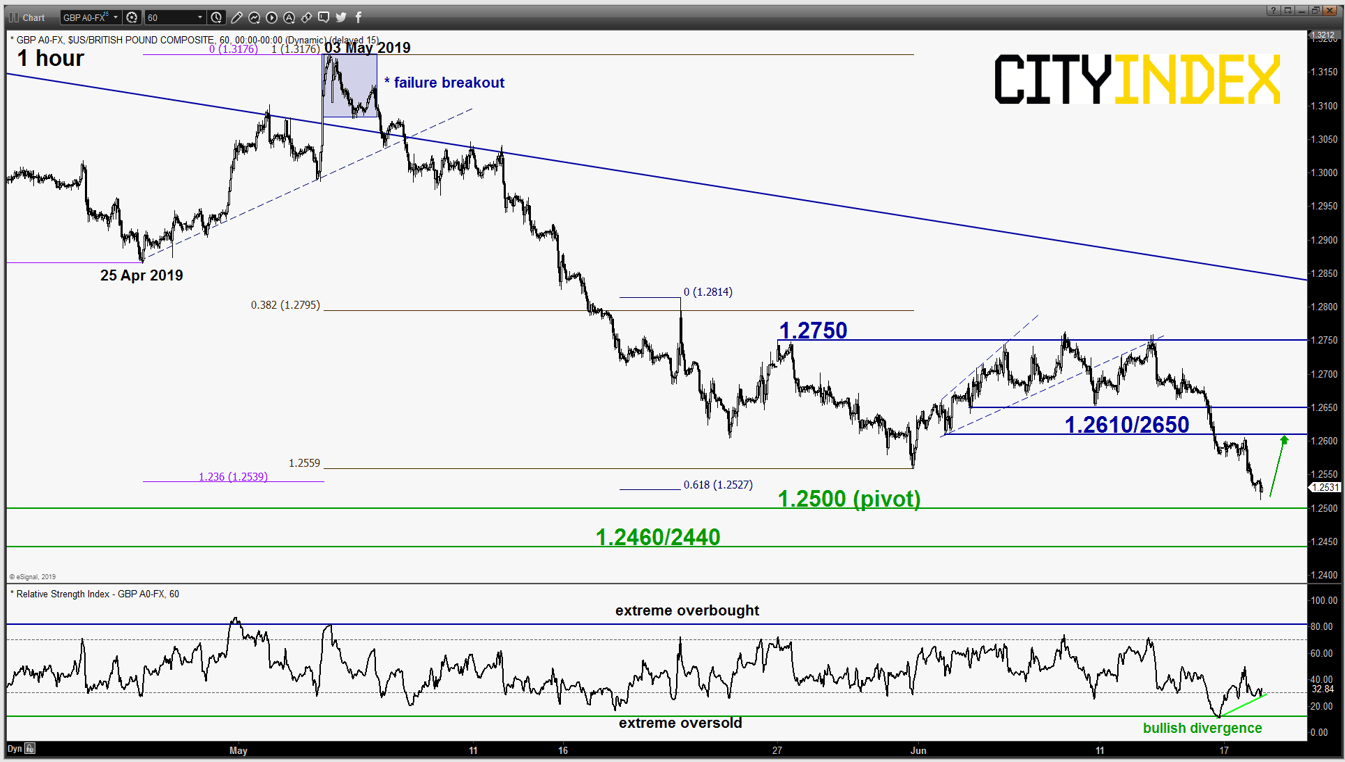
GBP/USD – At risk of shaping minor corrective rebound above major support
click to enlarge charts
- Dropped lower as expected and hit the major support of 1.2545/2530 as per highlighted in our report. Based on Elliot Wave/fractal analysis, the pair is now showing risk of a minor corrective rebound within a medium-term down trend sequence in place since 13 Mar 2019 high of 1.3380.
- In addition, the hourly RSI oscillator has flashed a bullish divergence signal after it reached an extreme oversold level. Flip to a bullish bias above 1.2500 key short-term pivotal support for a minor corrective rebound to target the intermediate resistance zone of 1.2610/2650.
- On the other hand, a break with an hourly close below 1.2500 may see spike down to towards the next support at 1.2460/2440 (03 Jan 2019 swing low & Fibonacci expansion cluster).
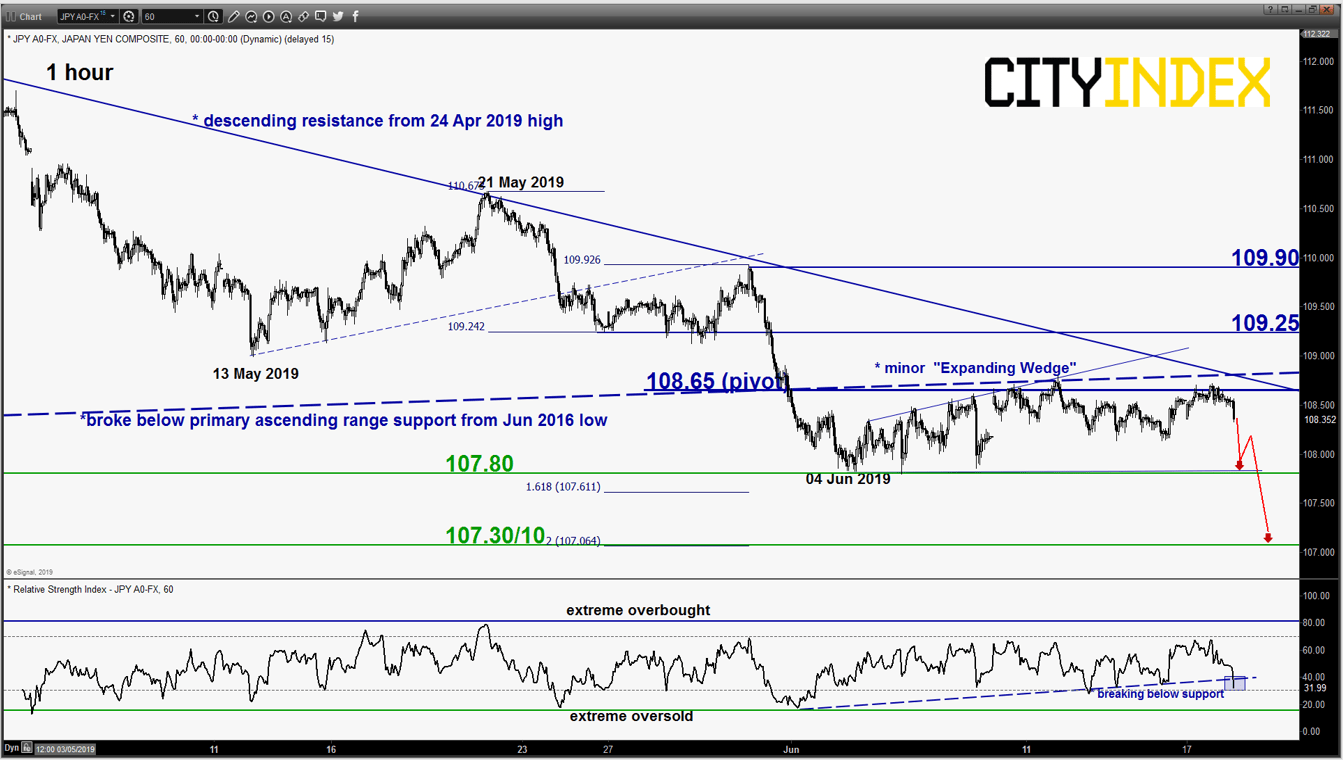
USD/JPY – Drop in progress
click to enlarge chart
- Tested and staged a retreat from the 108.65 key pivotal resistance as expected. No change, maintain bearish bias for a slide to retest 107.80 and a break below it reinforces a further drop towards the next near-term support at 107.30/10 (Fibonacci expansion cluster).
- On the other hand, an hourly close above 108.65 invalidates the bearish scenario for a squeeze up to retest the next intermediate resistance at 109.25.
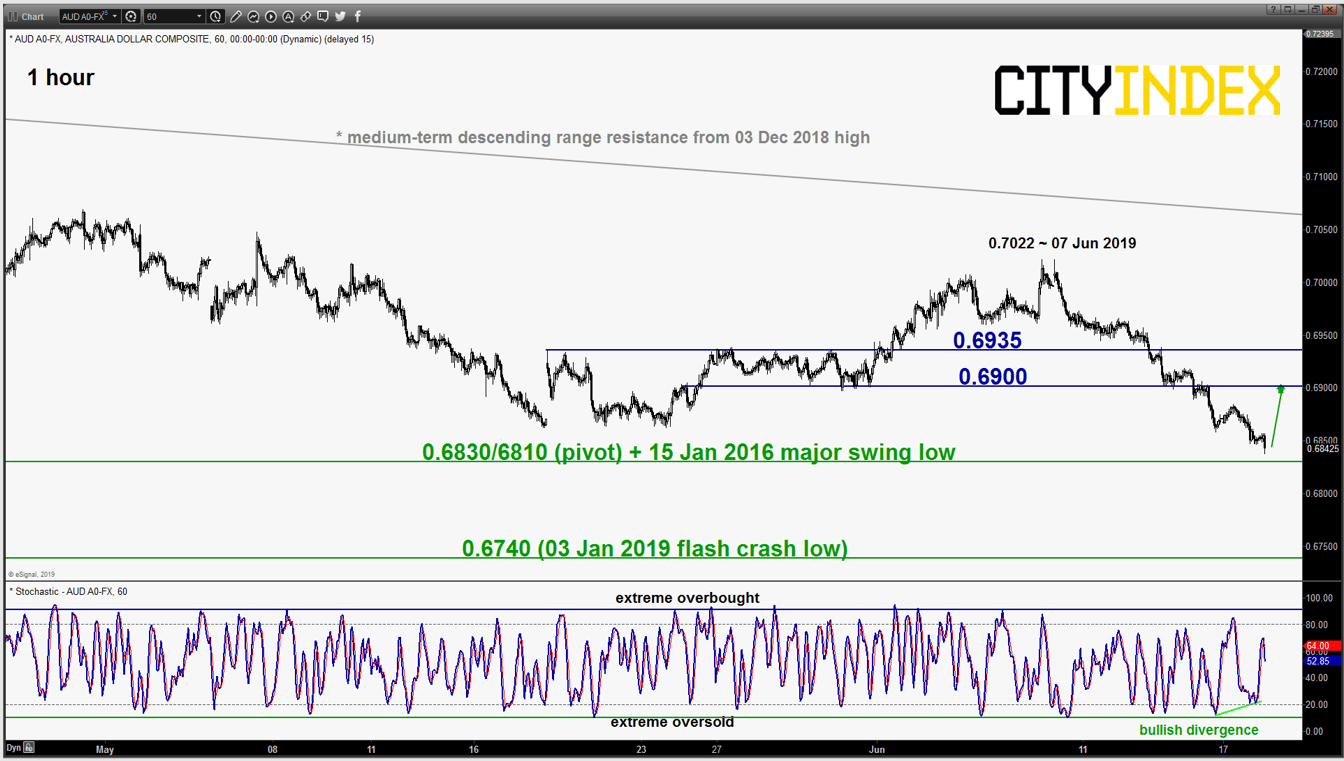
AUD/USD – At risk of shaping minor corrective rebound
click to enlarge chart
- Tumbled as expected and right now it is coming close to the downside target/support of 0.6860 as per highlighted in our previous report. It printed a current intraday low 0.6840 in today’s Asian session after the release of the RBA’s minutes of its recent monetary policy meeting that has indicated an increasing dovish tone among RBA officials.
- Short-term Elliot Wave/fractal analysis now indicates the risk of a minor rebound within a medium-term downtrend in place since 31 Jan 2019 high of 0.7295. In addition, the hourly Stochastic oscillator has flashed a bullish divergence signal at an extreme oversold level.
- Flip to a bullish bias with 0.6810 as the key short-term pivotal support for a potential push up to target the intermediate resistance zone at 0.6900/6934. On the other hand, a break with an hourly close below 0.6810 resumes the down move sequence to test the 03 Jan 2019 flash crash low of 0.6740 in the first step.
Charts are from eSignal
StoneX Financial Ltd (trading as “City Index”) is an execution-only service provider. This material, whether or not it states any opinions, is for general information purposes only and it does not take into account your personal circumstances or objectives. This material has been prepared using the thoughts and opinions of the author and these may change. However, City Index does not plan to provide further updates to any material once published and it is not under any obligation to keep this material up to date. This material is short term in nature and may only relate to facts and circumstances existing at a specific time or day. Nothing in this material is (or should be considered to be) financial, investment, legal, tax or other advice and no reliance should be placed on it.
No opinion given in this material constitutes a recommendation by City Index or the author that any particular investment, security, transaction or investment strategy is suitable for any specific person. The material has not been prepared in accordance with legal requirements designed to promote the independence of investment research. Although City Index is not specifically prevented from dealing before providing this material, City Index does not seek to take advantage of the material prior to its dissemination. This material is not intended for distribution to, or use by, any person in any country or jurisdiction where such distribution or use would be contrary to local law or regulation.
For further details see our full non-independent research disclaimer and quarterly summary.
CFDs are complex instruments and come with a high risk of losing money rapidly due to leverage. 69% of retail investor accounts lose money when trading CFDs with this provider. You should consider whether you understand how CFDs work and whether you can afford to take the high risk of losing your money. CFD and Forex Trading are leveraged products and your capital is at risk. They may not be suitable for everyone. Please ensure you fully understand the risks involved by reading our full risk warning.
City Index is a trading name of StoneX Financial Ltd. Head and Registered Office: 1st Floor, Moor House, 120 London Wall, London, EC2Y 5ET. StoneX Financial Ltd is a company registered in England and Wales, number: 05616586. Authorised and regulated by the Financial Conduct Authority. FCA Register Number: 446717.
City Index is a trademark of StoneX Financial Ltd.
The information on this website is not targeted at the general public of any particular country. It is not intended for distribution to residents in any country where such distribution or use would contravene any local law or regulatory requirement.
© City Index 2024