Daily Forex Technical Strategy Tues 10 Sep
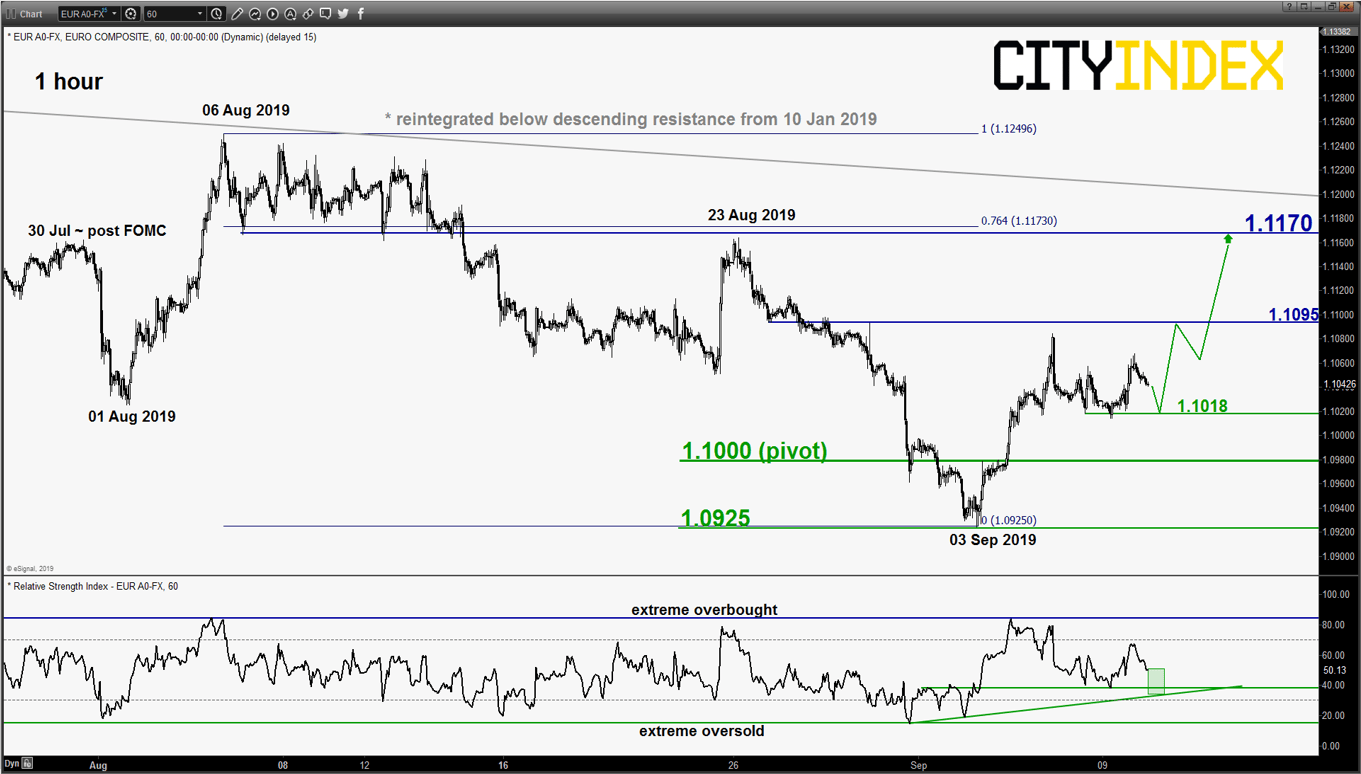
EUR/USD – Further corrective rebound in play
click to enlarge chart
- The pair has drifted lower and hit the short-term downside target/support of 1.1000 as per highlighted in our previous report (click here for a recap).
- Since last Tues, 03 Sep, it has staged a bounce of 160 pips to print a high of 1.1085 on 05 Sep before it traded sideways with a minor low of 1.1018. This minor sideways range represents 38.2% Fibonacci retracement of the recent rebound from 03 Sep low to 05 Sep 2019 high.
- Bullish bias in any dips above 1.1000 key short-term pivotal support for another potential upleg of the corrective rebound phase to target the next resistances at 1.1095 and 1.1170 (76.4% Fibonacci retracement of the decline from 06 Aug high to 03 Sep 2019 low & close to an intersection point of the descending resistance from 10 Jan 2019 high & former minor range support from 06 Aug 2019). However, a break with an hourly close below 1.1000 negates the bullish tone to retest 1.0925.
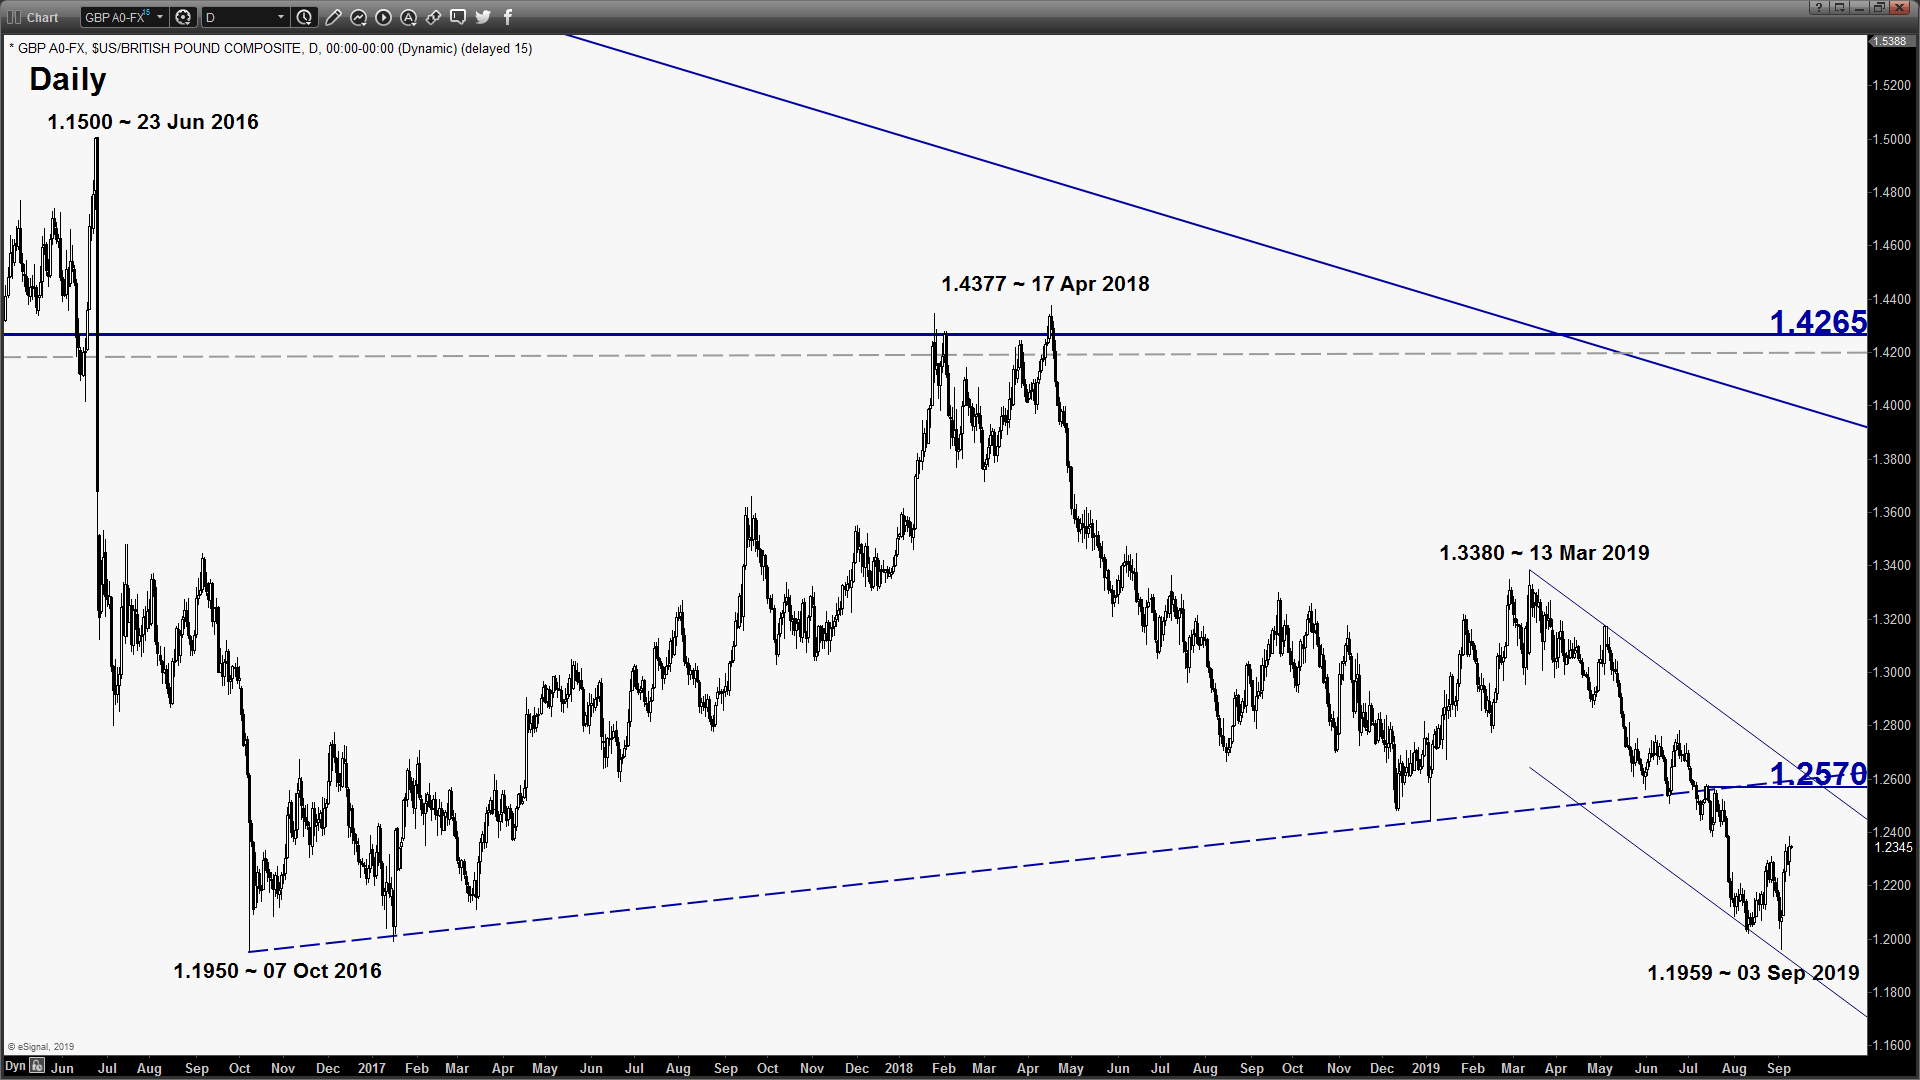
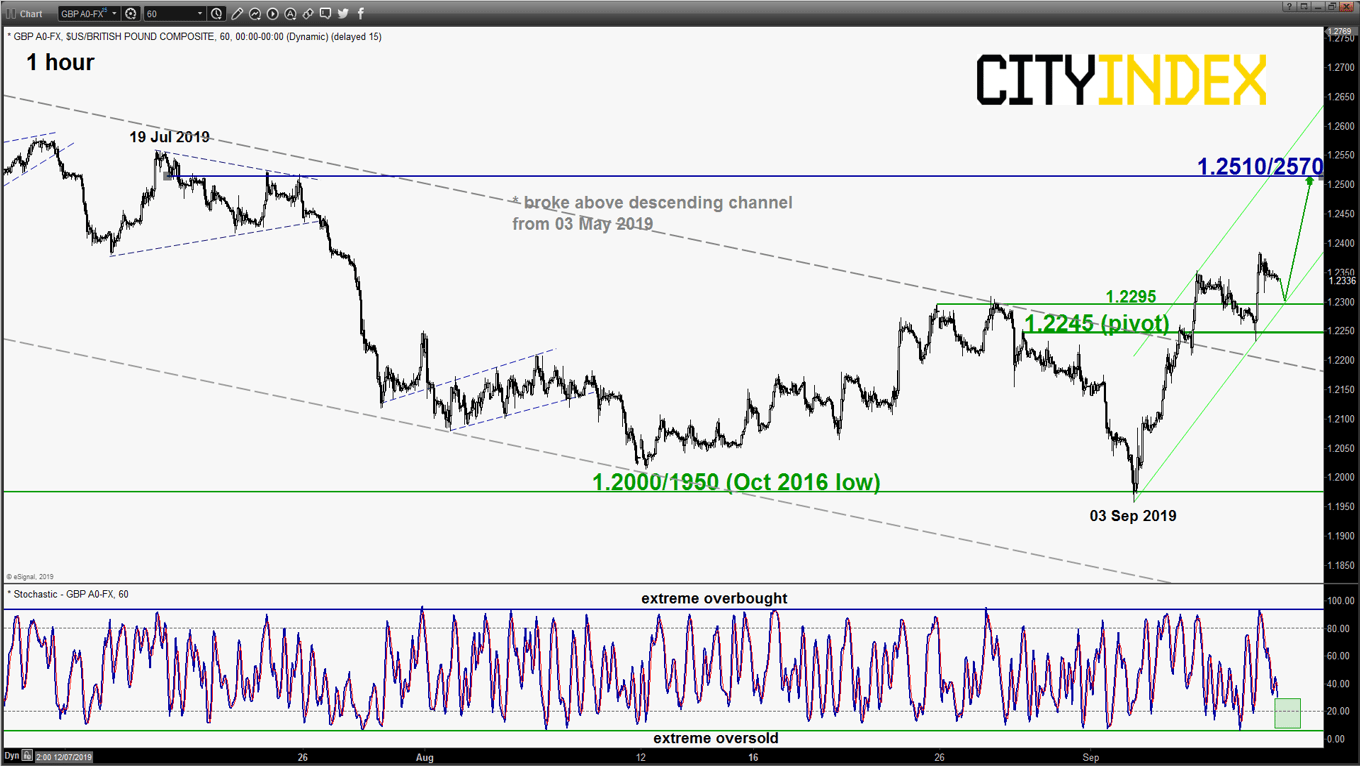
GBP/USD – Further potential push up towards key resistance
click to enlarge charts
- The pair has staged the expected bearish breakdown and hit the downside target/support of 1.2000/1950 as per highlighted in our previous report. It has printed a low of 1.1959 on 03 Sep 2019 before it staged a rebound of 428 pips to print a high of 1.2385 yesterday, 09 Sep.
- Bullish bias in any dips above 1.2245 key short-term pivotal support for a further potential push up to target the key resistance of 1.2510/2570 (upper boundary minor ascending channel from 03 Sep 2019 low & former major ascending support from 07 Oct 2016 low).
- However, a break with an hourly close below 1.2245 negates the bullish tone to retest 1.2000/1950.
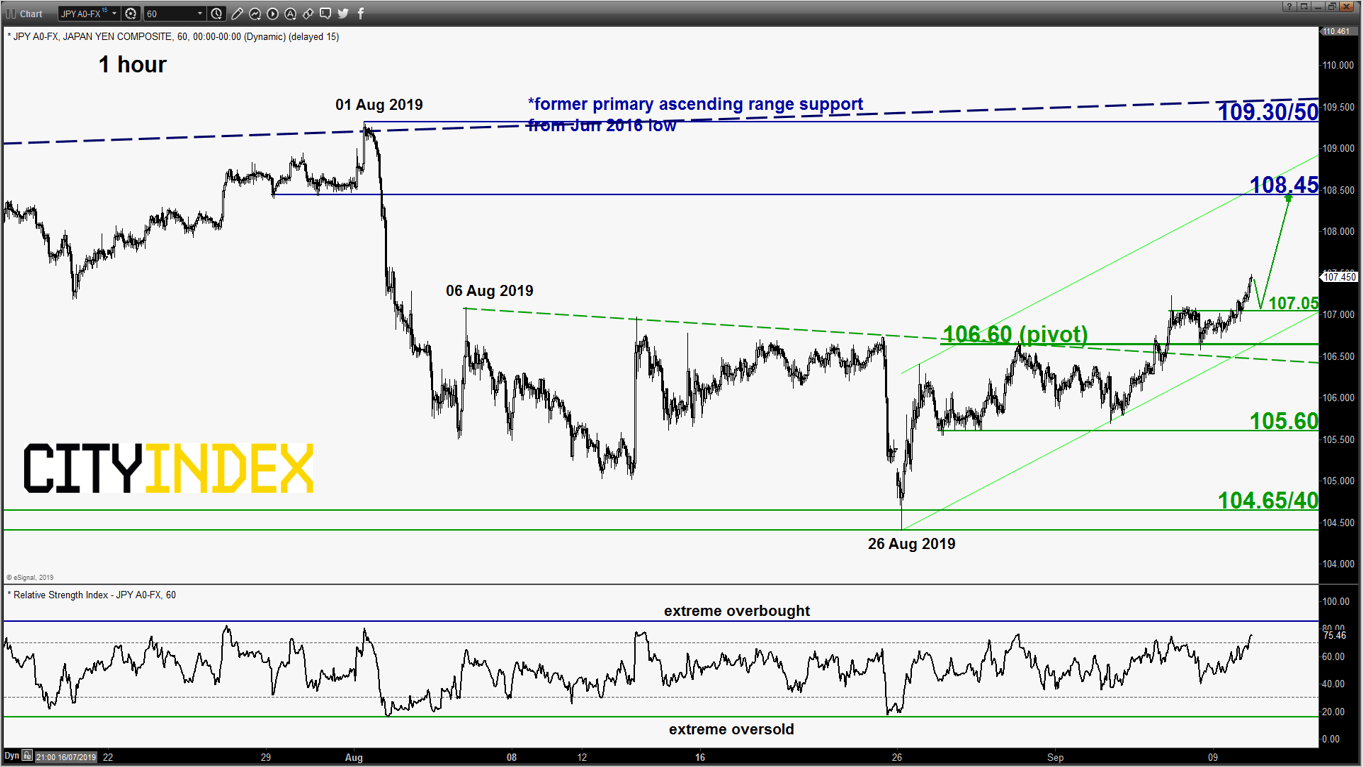
USD/JPY – Bullish breakout from minor range configuration
click to enlarge chart
- The pair has staged a bullish breakout above the 107.00 key short-term resistance (also the upper limit of the minor range configuration in place since 06 Aug 2019) that has invalidated the preferred short-term bearish scenario to retest 104.65/40.
- Flip to a bullish bias in any dips above 106.60 key short-term pivotal support for a further corrective bounce to target the next intermediate resistance at 108.45(Fibonacci retracement/expansion cluster & upper boundary of the minor ascending channel from 26 Aug 2019 low).
- However, a break with an hourly close below 106.80 indicates a failure bullish breakout for another round of choppy slide back towards 105.60 and even 104.65/40 next.
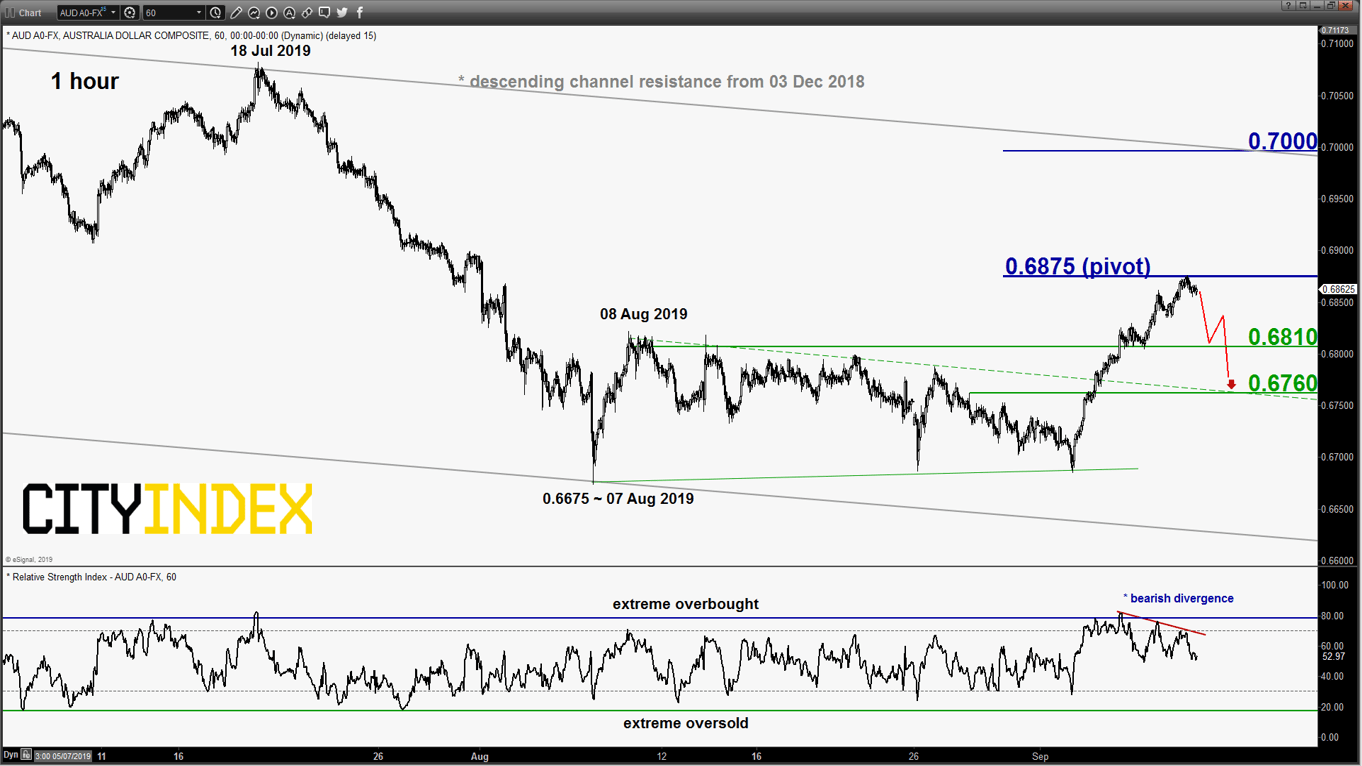
AUD/USD – Recent push up looks “overstretched”
click to enlarge chart
- The pair has staged a breakout above 0.6780 and squeezed up towards the alternate target/resistance of 0.6865 as per highlighted in our previous report (printed a high of 0.6875 yesterday, 09 Sep).
- Right now, short-term elements are highlighted the risk of a mean reversion pull-back with a bearish divergence signal seen in the hourly RSI oscillator at its overbought region. 0.6875 key short-term pivotal resistance for a potential slide to target 0.6810 and a break below it exposes 0.6760 next.
- However, a clearance with an hourly close above 0.6875 sees the continuation of the corrective rally towards 0.7000 next (upper boundary of the descending channel from 03 Dec 2018 high).
Charts are from eSignal
StoneX Financial Ltd (trading as “City Index”) is an execution-only service provider. This material, whether or not it states any opinions, is for general information purposes only and it does not take into account your personal circumstances or objectives. This material has been prepared using the thoughts and opinions of the author and these may change. However, City Index does not plan to provide further updates to any material once published and it is not under any obligation to keep this material up to date. This material is short term in nature and may only relate to facts and circumstances existing at a specific time or day. Nothing in this material is (or should be considered to be) financial, investment, legal, tax or other advice and no reliance should be placed on it.
No opinion given in this material constitutes a recommendation by City Index or the author that any particular investment, security, transaction or investment strategy is suitable for any specific person. The material has not been prepared in accordance with legal requirements designed to promote the independence of investment research. Although City Index is not specifically prevented from dealing before providing this material, City Index does not seek to take advantage of the material prior to its dissemination. This material is not intended for distribution to, or use by, any person in any country or jurisdiction where such distribution or use would be contrary to local law or regulation.
For further details see our full non-independent research disclaimer and quarterly summary.
CFDs are complex instruments and come with a high risk of losing money rapidly due to leverage. 69% of retail investor accounts lose money when trading CFDs with this provider. You should consider whether you understand how CFDs work and whether you can afford to take the high risk of losing your money. CFD and Forex Trading are leveraged products and your capital is at risk. They may not be suitable for everyone. Please ensure you fully understand the risks involved by reading our full risk warning.
City Index is a trading name of StoneX Financial Ltd. Head and Registered Office: 1st Floor, Moor House, 120 London Wall, London, EC2Y 5ET. StoneX Financial Ltd is a company registered in England and Wales, number: 05616586. Authorised and regulated by the Financial Conduct Authority. FCA Register Number: 446717.
City Index is a trademark of StoneX Financial Ltd.
The information on this website is not targeted at the general public of any particular country. It is not intended for distribution to residents in any country where such distribution or use would contravene any local law or regulatory requirement.
© City Index 2024