BP Jump 4 On Dividend Increase Despite Falling Profits
Results
- Q4 earnings -26% to $2.6 billion vs $2.08 billion
- FY profits -21% $10 billion vs $12.7 billion 2018
- Dividend +2.4% to 10.50 cents per share
Falling energy prices
Higher production has failed to offset lower oil and gas prices. The average oil price across 2018 was $71 per barrel, whereas in 2019 this was down at $64 per barrel, an almost 10% difference – even with a 3% increase in production, there is no escaping that squeeze.
The results come following disappointing numbers from Shell, Exxon Mobil and Chevron as falling energy prices and reducing chemical industry margins hit the sector hard.
The price of oil has been under pressure already at the start of this year and could slip lower with the coronavirus outbreak potentially having a significant impact on demand for oil. Crude oil prices dived 15% across January and are already down 1.5% in February.
Divestment
BP is in the process of a $10 billion divestment programme to end 2020. The programme aims to reconfigure BP's portfolio of assets in order to strengthen the balance sheet following the BHP shale assets deal. Q4 Divestment totalled $800 million, in addition to $600 million from sale of 49% stake in Australian retail property portfolio.
BP impressed by saying that it was ahead of target and plans an additional $5 billion by mid-2021.
Debt
Since the BHP deal BP’s debt levels have come increasingly under the spotlight, gearing has fallen from 32% in Q3 to 31% in Q4 and is expected to move to mid-20% in 2020. There had been concerns that the higher debt levels could dampen prospects of cash being returned to investors. However, this fear doesn’t appear to be materialising.
Bob Dudley Steps Down
These were the last results with Bob Dudley at the helm; he leaves after 10 years a chief executive. Bernard Looney, head of exploration and production will take over. The timing seems fitting as BP looks to steers its course towards for sustainable forms of energy in a rapidly changing landscape.
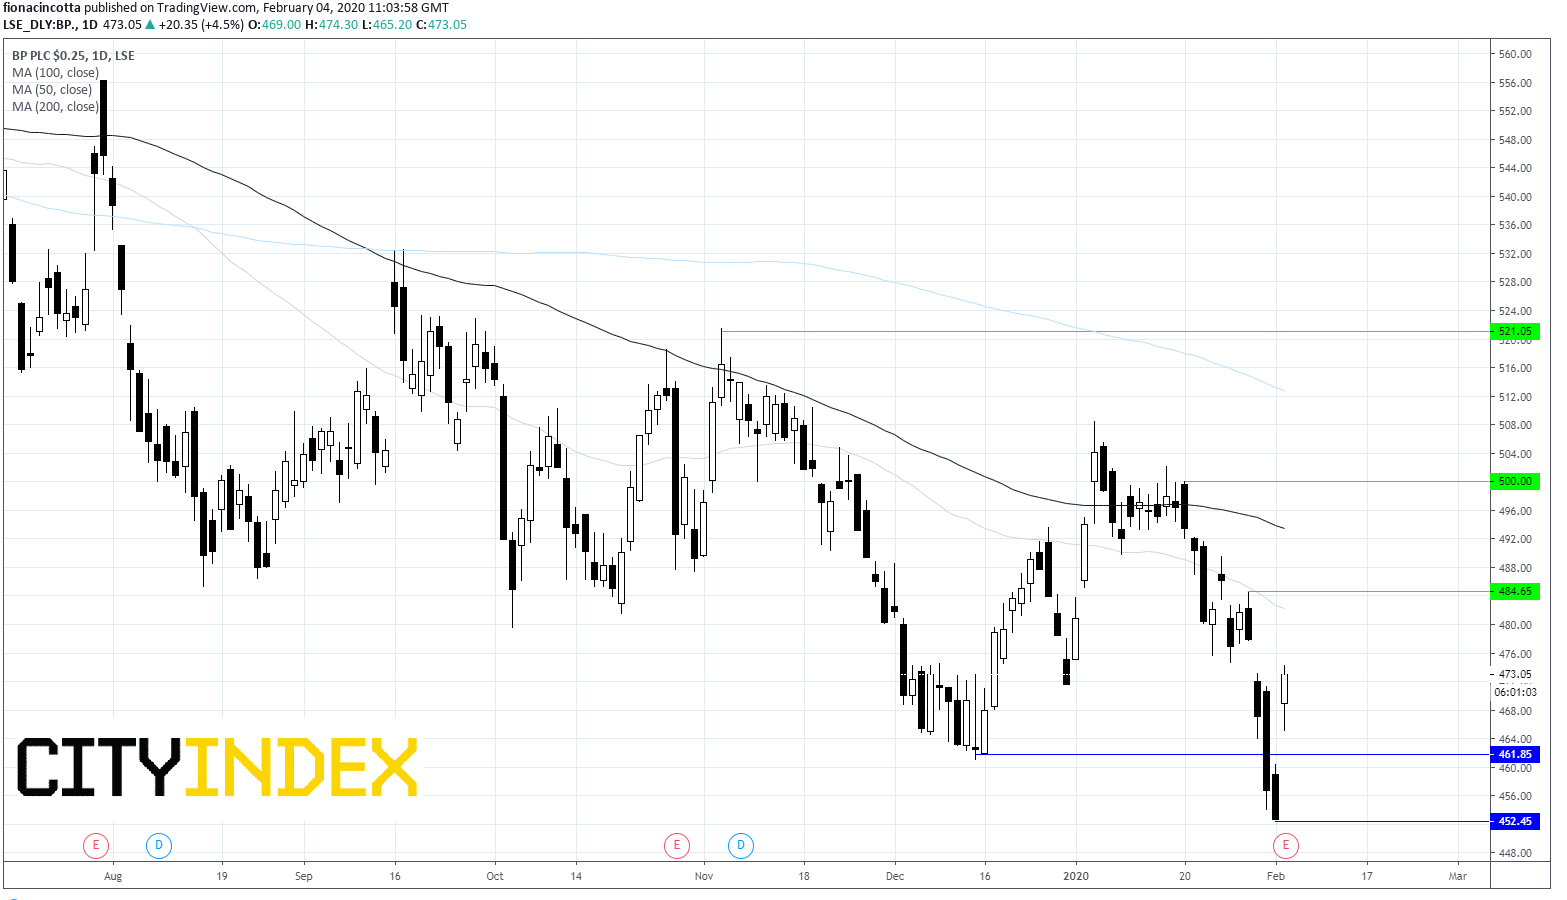
Chart thoughts
BP has jumped 4% higher in early trade on Tuesday. However BP continues trading below its 200, 100 on 50 sma on a bearish daily chart.
A break above resistance around 483-5p (29th Jan high, 50 sma) could negate the current bearish trend. Resistance is then at 500p (high 20th Jan) and 521p (5th Nov high).
Support can be seen at around 460p a level which provided support mid-December, before 452p, yesterday’s low.
StoneX Financial Ltd (trading as “City Index”) is an execution-only service provider. This material, whether or not it states any opinions, is for general information purposes only and it does not take into account your personal circumstances or objectives. This material has been prepared using the thoughts and opinions of the author and these may change. However, City Index does not plan to provide further updates to any material once published and it is not under any obligation to keep this material up to date. This material is short term in nature and may only relate to facts and circumstances existing at a specific time or day. Nothing in this material is (or should be considered to be) financial, investment, legal, tax or other advice and no reliance should be placed on it.
No opinion given in this material constitutes a recommendation by City Index or the author that any particular investment, security, transaction or investment strategy is suitable for any specific person. The material has not been prepared in accordance with legal requirements designed to promote the independence of investment research. Although City Index is not specifically prevented from dealing before providing this material, City Index does not seek to take advantage of the material prior to its dissemination. This material is not intended for distribution to, or use by, any person in any country or jurisdiction where such distribution or use would be contrary to local law or regulation.
For further details see our full non-independent research disclaimer and quarterly summary.
CFDs are complex instruments and come with a high risk of losing money rapidly due to leverage. 69% of retail investor accounts lose money when trading CFDs with this provider. You should consider whether you understand how CFDs work and whether you can afford to take the high risk of losing your money. CFD and Forex Trading are leveraged products and your capital is at risk. They may not be suitable for everyone. Please ensure you fully understand the risks involved by reading our full risk warning.
City Index is a trading name of StoneX Financial Ltd. Head and Registered Office: 1st Floor, Moor House, 120 London Wall, London, EC2Y 5ET. StoneX Financial Ltd is a company registered in England and Wales, number: 05616586. Authorised and regulated by the Financial Conduct Authority. FCA Register Number: 446717.
City Index is a trademark of StoneX Financial Ltd.
The information on this website is not targeted at the general public of any particular country. It is not intended for distribution to residents in any country where such distribution or use would contravene any local law or regulatory requirement.
© City Index 2024