AUDNZD recovery under review
Two months have passed since our last update (here) on the AUDNZD cross, one of our favourite trading pairs for 2019.
The length of time between our updates reflects the holiday period. It also reflects a determination to let the dust settle after the RBNZ wrong-footed the market in mid-November and elected to keep interest rates on hold despite a consensus view they would cut rates.
“For now, the sensible course of action in AUDNZD is to allow the market time to stabilise and look for signs of a base to form over the coming weeks.”
Since that point, AUDNZD has fallen over 300 points, from 1.0650 to near 1.0300 as the market unwound its long positions, seemingly exacerbated by the natural disasters currently impacting multiple regions in Australia. The impact of the bushfires on economic activity remains uncertain, more so as there is sadly a high risk of further fire damage in the coming weeks.
Economists expect the fires to result in a hit to growth in the March quarter of around -0.5% centred in the agricultural and tourism sectors before a rebuilding boost in the June quarter. Typically markets tend to look through both the negative print and the rebound caused by “one-off” natural disaster type disruptions.
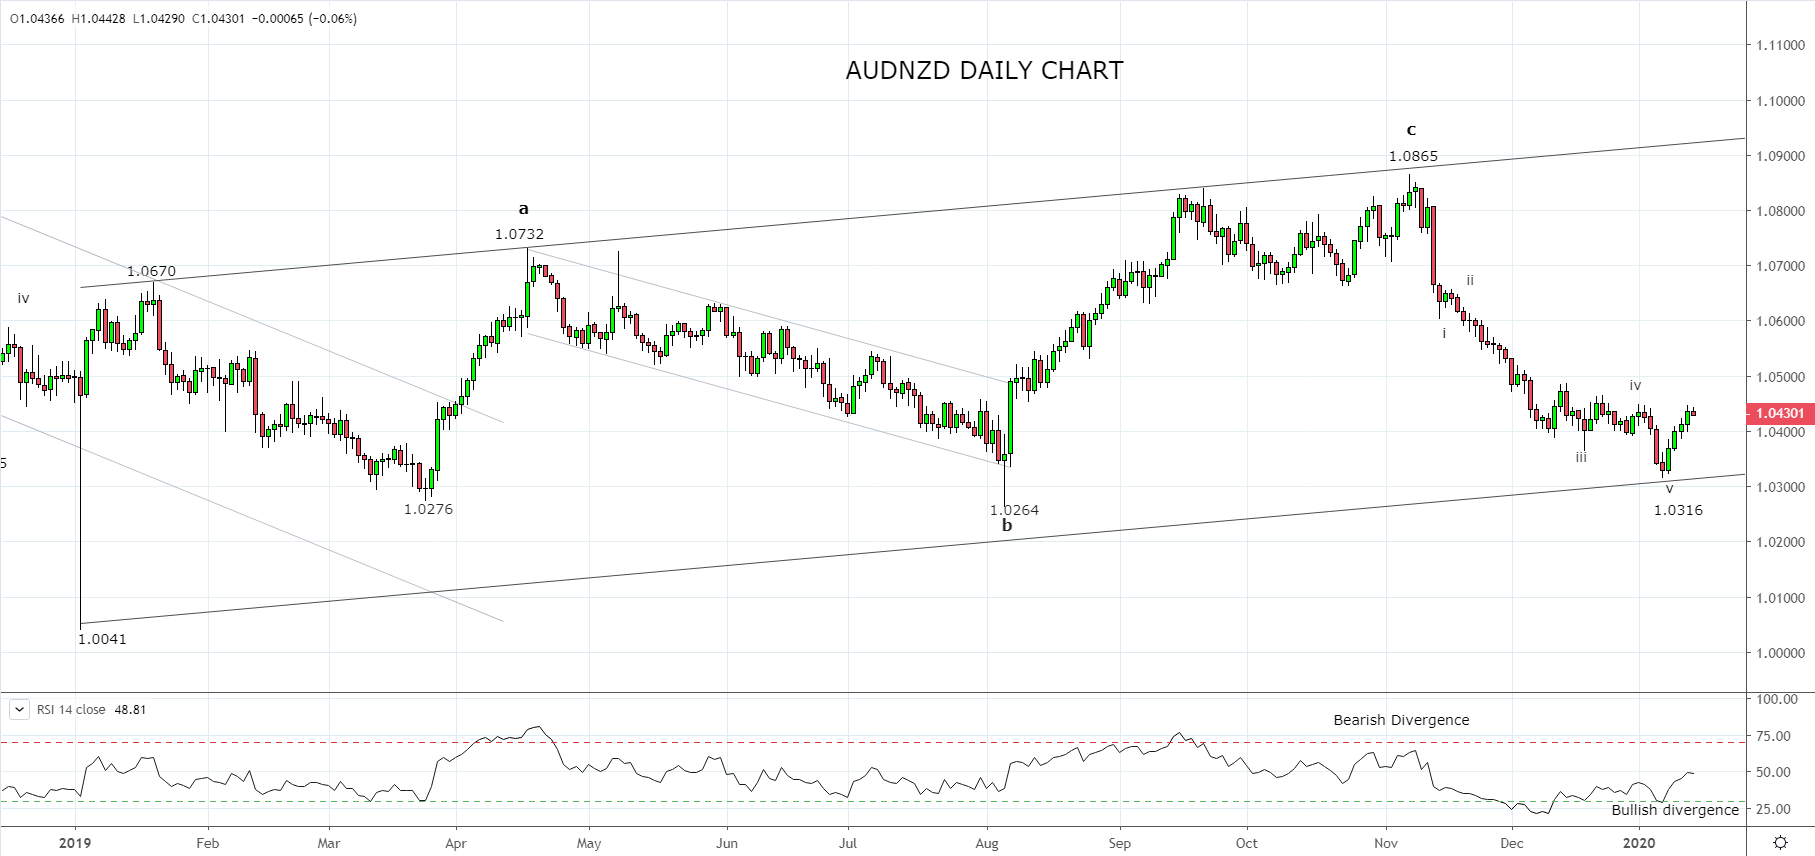
Also relevant to the cross rate, AUDNZD completed a five wave decline from the 1.0865 high at the long term trend channel support ahead of 1.0300. Combined with the bullish divergence as viewed on the RSI indicator, the stage was set last week for a bounce to commence, following the better than expected housing approvals and strongest retail sales numbers in two years.
For those that took advantage of the set up there appears to be room for the rebound to continue towards 1.0500/50. However, I do feel that the easy money from this countertrend rally is now mostly gone and if at any time the trendline support at 1.0315 and 2019 lows 1.0275/65 give way, the next leg of the downtrend is likely to have commenced, targeting a retest of the 2019 flash crash low near 1.0040.
Source Tradingview. The figures stated areas of the 15th of January 2020. Past performance is not a reliable indicator of future performance. This report does not contain and is not to be taken as containing any financial product advice or financial product recommendation
StoneX Financial Ltd (trading as “City Index”) is an execution-only service provider. This material, whether or not it states any opinions, is for general information purposes only and it does not take into account your personal circumstances or objectives. This material has been prepared using the thoughts and opinions of the author and these may change. However, City Index does not plan to provide further updates to any material once published and it is not under any obligation to keep this material up to date. This material is short term in nature and may only relate to facts and circumstances existing at a specific time or day. Nothing in this material is (or should be considered to be) financial, investment, legal, tax or other advice and no reliance should be placed on it.
No opinion given in this material constitutes a recommendation by City Index or the author that any particular investment, security, transaction or investment strategy is suitable for any specific person. The material has not been prepared in accordance with legal requirements designed to promote the independence of investment research. Although City Index is not specifically prevented from dealing before providing this material, City Index does not seek to take advantage of the material prior to its dissemination. This material is not intended for distribution to, or use by, any person in any country or jurisdiction where such distribution or use would be contrary to local law or regulation.
For further details see our full non-independent research disclaimer and quarterly summary.
CFDs are complex instruments and come with a high risk of losing money rapidly due to leverage. 69% of retail investor accounts lose money when trading CFDs with this provider. You should consider whether you understand how CFDs work and whether you can afford to take the high risk of losing your money. CFD and Forex Trading are leveraged products and your capital is at risk. They may not be suitable for everyone. Please ensure you fully understand the risks involved by reading our full risk warning.
City Index is a trading name of StoneX Financial Ltd. Head and Registered Office: 1st Floor, Moor House, 120 London Wall, London, EC2Y 5ET. StoneX Financial Ltd is a company registered in England and Wales, number: 05616586. Authorised and regulated by the Financial Conduct Authority. FCA Register Number: 446717.
City Index is a trademark of StoneX Financial Ltd.
The information on this website is not targeted at the general public of any particular country. It is not intended for distribution to residents in any country where such distribution or use would contravene any local law or regulatory requirement.
© City Index 2024