ASX Long And Short Of It BFT WES IVC
- It’s been a volatile week for equities globally, which were initially spooked on Tuesday another negative print from ISM manufacturing report. Whilst we’ve seen a minor rebound on Trump’s reassurance that “talks are going well” the markets aren’t really ‘buying it’, so we need further clarification from China.
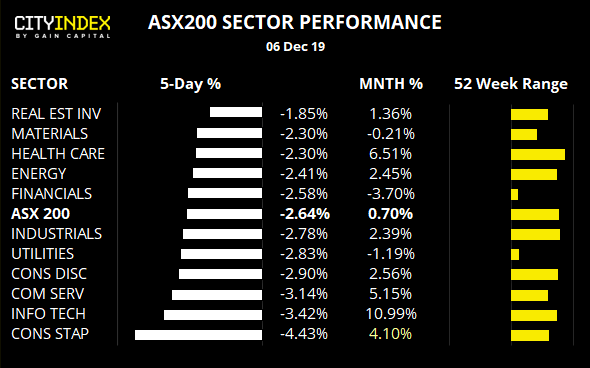
- Technically, the week closed with another bearish outside week (its 2nd over 3 weeks) and twice failed to close above the prior all-time highs of 6875.50. So the market may well have topped in our view without a breakthrough in trade talks. Whilst we’d love to see a Santa’s rally, it took until the last week of December in 2018 for it to finally arrive. So let price action be your guide.
- We can see that all sectors closed in the red this week, with consumer staples and info tech bearing the brunt. The energy index will largely take it direction from the conclusion of this week’s OPEC meeting early next week, so keep that in mind of trading equities within the sector. Consumer discretionary, healthcare and info tech sectors remain technically strong, although all sectors are on the back foot and to the mercy of global sentiment.
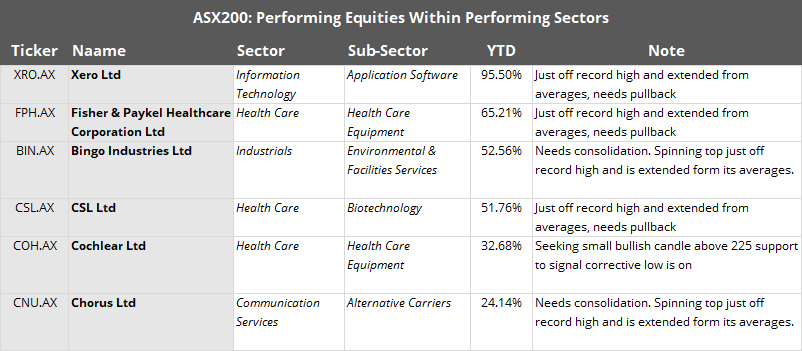
These equities display trade within strong sectors whilst also showing strong, bullish trends. Whilst they don’t quite qualify for an immediate entry, they’re on our radar should they do so in future.
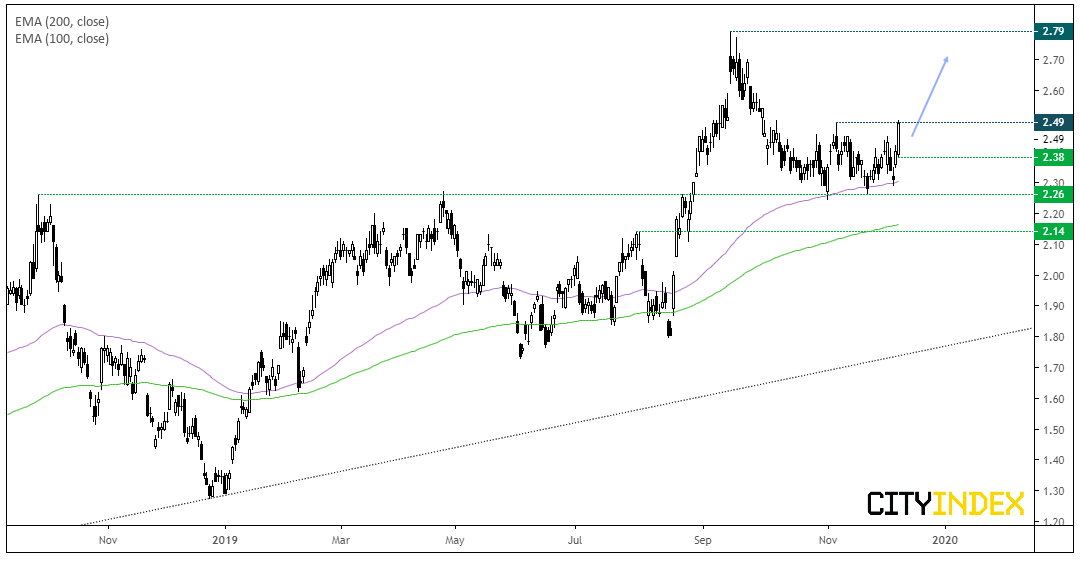
Beach Energy CFD/DFT: Despite poor returns from the energy sector this year, Beach Energy has packed a punch with an 85% return YTD. In the prior report, we had flagged it as one to monitor around the pivotal level of 2.26, as a bounce higher would have reaffirmed the support level in line with the dominant trend. Failing that, it left the potential for a 12c countertrend move. Well, it chosen the former scenario and the 100-day eMA continues to support and prices are considering a break higher.
- Bias remains bullish above 2.25, although today’s low at 2.38 can also be used to aid with risk management if momentum if bullish on Monday.
- Initial target is the 2.79 high.
- Keep in mind today’s OPEC meeting can have a direct impact on the energy sector on Monday’s open.
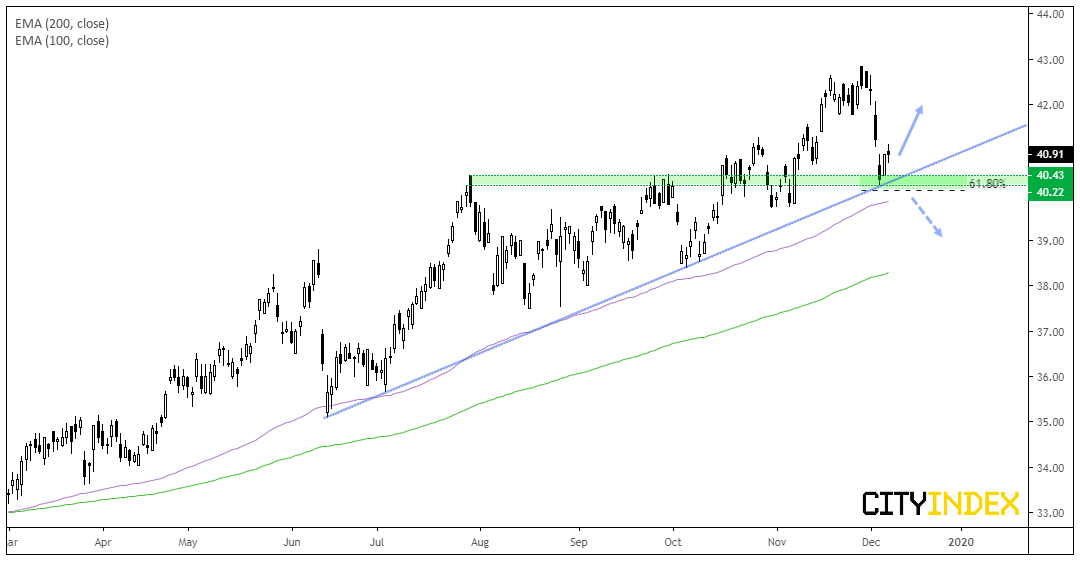
Wesfarmers CFD/DFT: This is one to monitor next week to see if bullish momentum returns. The direct losses from 43 are a concern yet encouraging to see support found around 40.22-40.43. Moreover, this zone coincides with the bullish trendline from the June low, making it a pivotal level to watch.
- Bulls can seek more evidence that a trough is being formed or consider entry if bullish momentum returns to suggest the swing low is in at 40.22.
- A break below 40.22 invalidates the bullish bias and could be one for counter-trend traders to consider if the bullish trendline breaks.
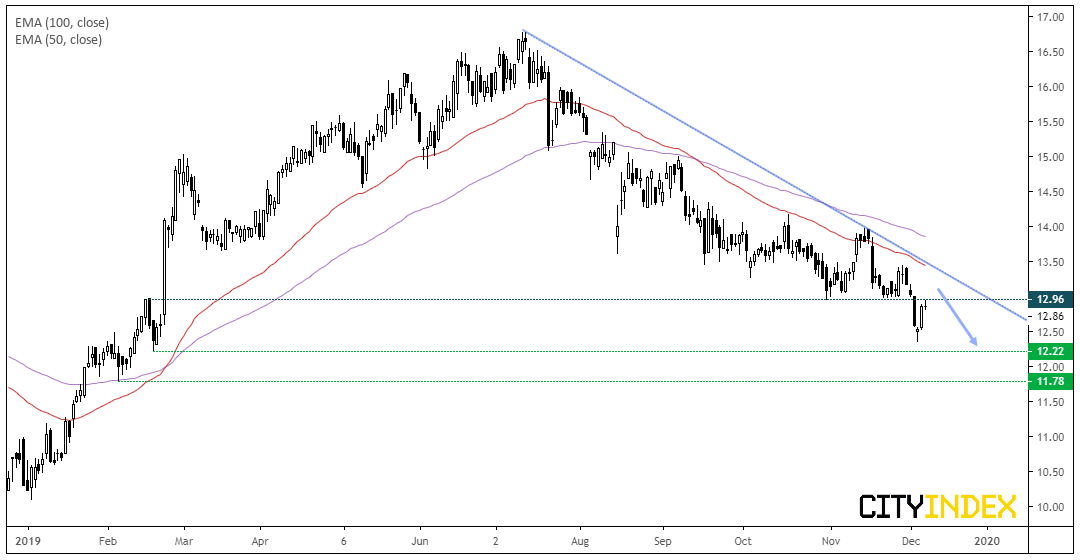
Invocare CFD/DFT: Prices remains below the bearish trendline and, having broken through support around 13 this week, has now pulled back into this key level. Perhaps we’ll now see it turned into resistance, although traders could consider bearish setups whilst it trades below the bearish trendline and / or the 13.50 high.
Price Action Update
Nanosonic CFD/DFT (NAN): There’s no denying it, this one failed having broken the wrong way out of compression (down) and straight through the bullish trendline. It remains in a strong sector so may return but, for now, has been removed from the watchlist.
Galaxy Resources CFD/DFT (GXY): The triple top target around 0.875 has been met and exceeded and prices are now headed for the lows around 0.815-0.830. The bearish channel remains intact, so the bias is for ran eventual break low which pave the way for 0.675. However, we urge cation around current levels as the September lows may beckon profit taking and therefore a rebound over the near-term.
Newcrest Mining CFD/DFT: 31.49 resistance held and, after some time oscillating sideways is now on route to the target around 28. Thursday’s bearish engulfing candle suggests bears remain I control, so the near-term bias remain bearish whilst 29.93 resistance holds.
REA Group Ltd CFD/DFT: The retracement on this was deeper than we’d have liked and traded above the 106 threshold we’d used to invalidate the idea, before finally falling lower. Price action is now messy so has been removed from the watchlist for now.
Bank of Queensland CFD: This was flagged on the 8th November for a likely breakdown and it has not disappointed. After a small consolidation, prices gapped low and bears drove it beneath the 8.02 target. With no signs of mean reversion, it’s vulnerable to snapping back to its mean, so is on the backburner for now.
Related analysis:
Historically, How Bearish Has A 'Bearish Outside Week' Been On The ASX200?
S&P500: The Long And Short Of It | AMD, United Technologies, Apache, NiScource
FTSE: The Long & Short Of It | EasyJet, Compass, Hiscox
ASX200: The Long And Short Of It | NAN, GXY, REA, BPT
StoneX Financial Ltd (trading as “City Index”) is an execution-only service provider. This material, whether or not it states any opinions, is for general information purposes only and it does not take into account your personal circumstances or objectives. This material has been prepared using the thoughts and opinions of the author and these may change. However, City Index does not plan to provide further updates to any material once published and it is not under any obligation to keep this material up to date. This material is short term in nature and may only relate to facts and circumstances existing at a specific time or day. Nothing in this material is (or should be considered to be) financial, investment, legal, tax or other advice and no reliance should be placed on it.
No opinion given in this material constitutes a recommendation by City Index or the author that any particular investment, security, transaction or investment strategy is suitable for any specific person. The material has not been prepared in accordance with legal requirements designed to promote the independence of investment research. Although City Index is not specifically prevented from dealing before providing this material, City Index does not seek to take advantage of the material prior to its dissemination. This material is not intended for distribution to, or use by, any person in any country or jurisdiction where such distribution or use would be contrary to local law or regulation.
For further details see our full non-independent research disclaimer and quarterly summary.
CFDs are complex instruments and come with a high risk of losing money rapidly due to leverage. 69% of retail investor accounts lose money when trading CFDs with this provider. You should consider whether you understand how CFDs work and whether you can afford to take the high risk of losing your money. CFD and Forex Trading are leveraged products and your capital is at risk. They may not be suitable for everyone. Please ensure you fully understand the risks involved by reading our full risk warning.
City Index is a trading name of StoneX Financial Ltd. Head and Registered Office: 1st Floor, Moor House, 120 London Wall, London, EC2Y 5ET. StoneX Financial Ltd is a company registered in England and Wales, number: 05616586. Authorised and regulated by the Financial Conduct Authority. FCA Register Number: 446717.
City Index is a trademark of StoneX Financial Ltd.
The information on this website is not targeted at the general public of any particular country. It is not intended for distribution to residents in any country where such distribution or use would contravene any local law or regulatory requirement.
© City Index 2024