FAANGs Earnings In Focus
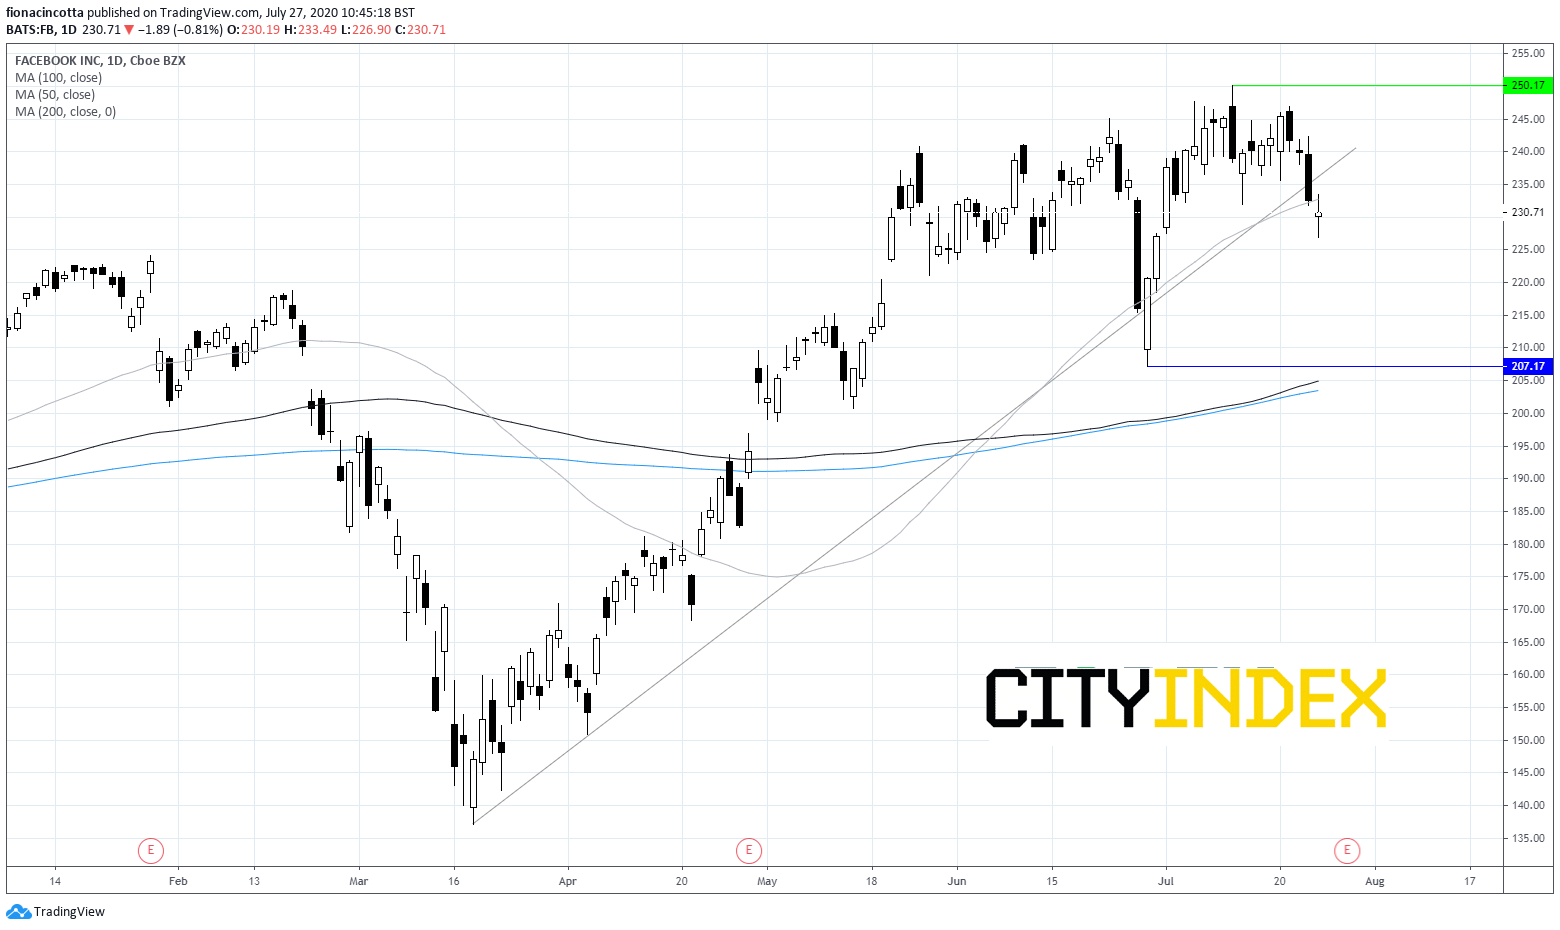
Facebook Q2 – 29th July
All eyes will be on advertising revenue when Facebooks reports Q2 earnings. FB reports as some big brands officially boycott Facebook advertising over its policy on misinformation and hate speech. Recent data shows US online ad spend points to a stronger than forecast recovery. Facebook’s daily active users climbed 11% in Q1 and could perform well again in Q2 amid the stay at home order. FB’s expansion into the booming e-commerce world will also be closely eyed with stores now easily created in Facebook and on Instagram. Broadly speaking analysts are optimistic.
Expectations are for quarterly EPS of $1.44 (+58%) on revenue of $17.31 billion (+2.5%)
Chart Thoughts
After hitting an all time high of $250 two weeks ago FB has fallen lower, slipping below its ascending trendline and 50 daily moving average suggesting that more weakness could be on the cards. If FB fails to retake the ascending trendline at $234, we could see a steeper sell off towards the key support at $205 (low 29th June & 100 & 200 sma)
Alphabet Q2 – 30th July
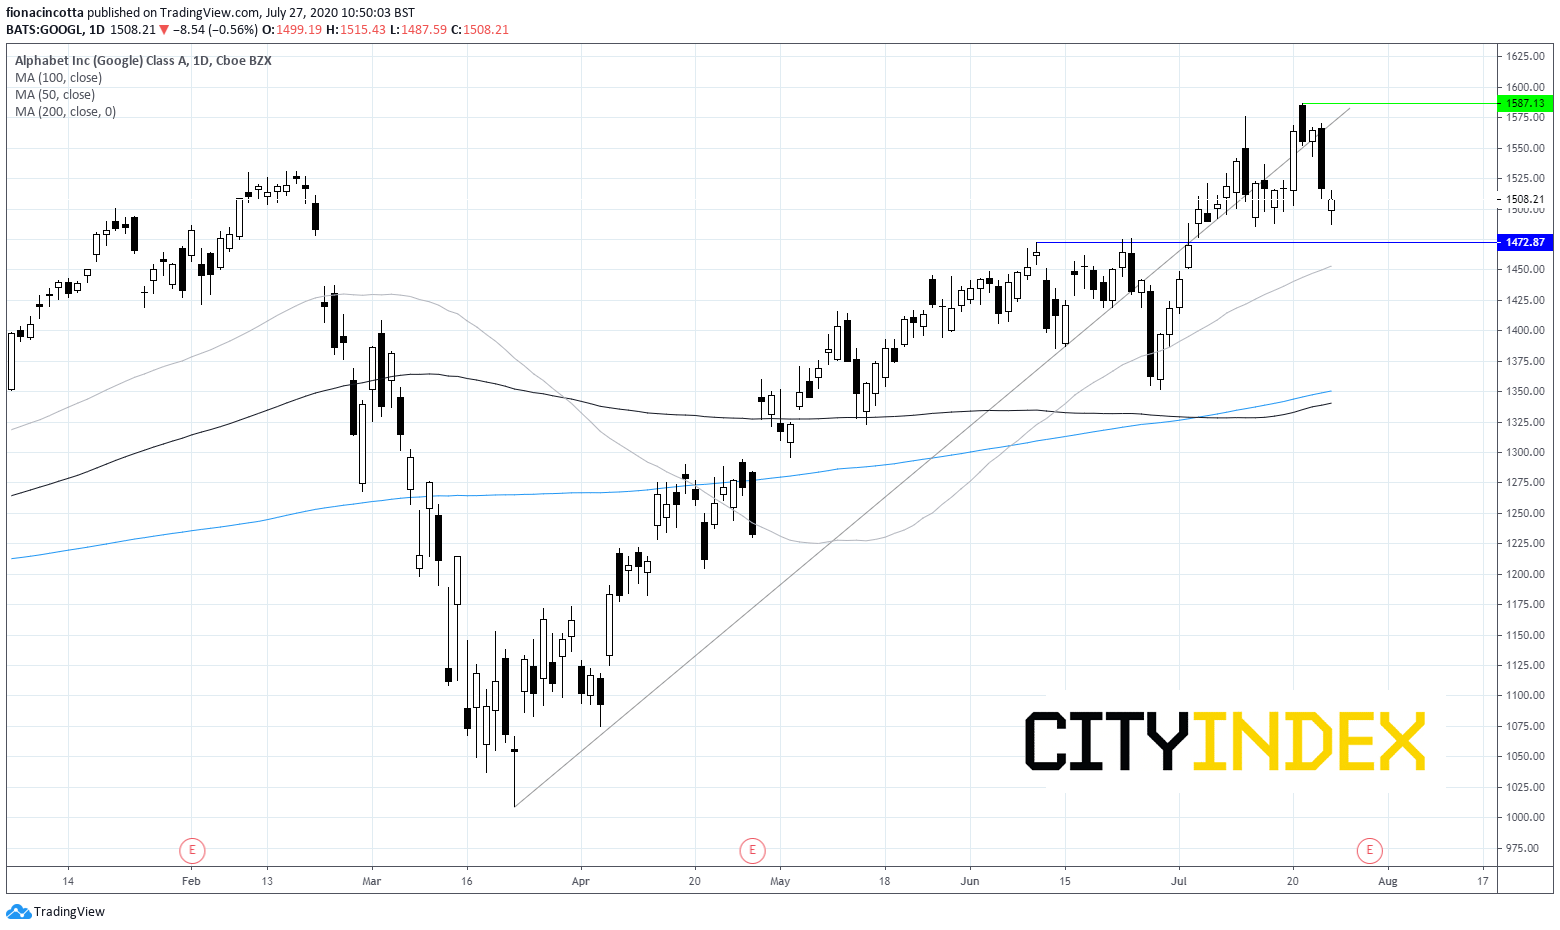
Google parent Alphabet is expected to report year on year decline in earnings on lower revenue. As with Facebook, advertising revenue will be in focus. April – June is expected to be the nadir for ad spend as marketing budgets are cut. Recent data shows that ad spend is starting to pick up. Alphabet has more than one string to its bow and could also benefit from consumers spending more time at home, on YouTube and Google Cloud platform which are now driving more than 50% of total sales. FactSet project that Google Cloud Platform will generate $12.9 billion in 2020 making it a significant factor in Alphabet’s growth but one that is perhaps undervalued by investors.
Expectations for quarterly EPS of $8.43 (-40% yoy) on revenues $30.66 billion (-3.3% yoy)
Chart thoughts
Alphabet has had a phenomenal rally from mid-March lows, soaring 57% to an all-time high of$1587 last week. Since then the stock has looked less certain dropping below its ascending trendline, although it remains firmly above its 50, 100 and 200 sma suggesting that there could be more upside on the cards still. We would be looking for a move back over the ascending trendline around $1560 to confirm a bullish trend. Otherwise a test of support at $1470 (July low) could open the doors to 50 sma at $1450.
Apple Q3 – 30th July
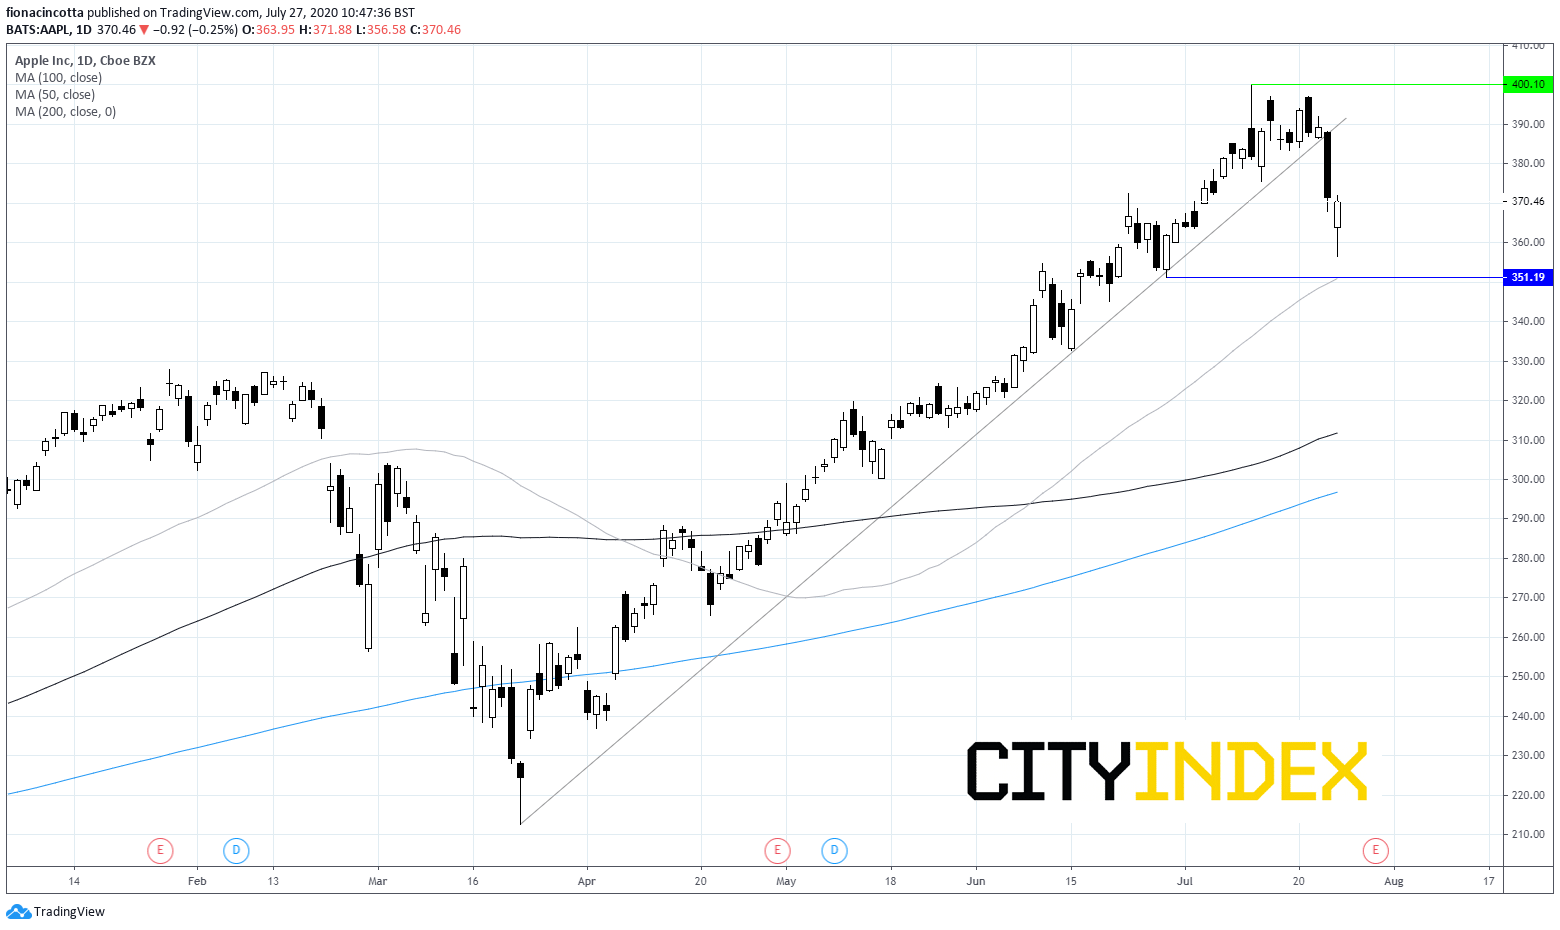
Apple is due to report Q3 earnings. It’s share price has had a phenomenal run since March lows but is showing signs of cracking heading into results. With expectations sky high the risk of disappointment also runs high. iPhone sales are forecast at $22.4 billion down by 13.8%, services and wearables are expected to see revenue grow 15% to $13.2 billion and 5% $5.97 billion respectively. If the service business segment does grow by 15% this would be the slowest rate of growth since Q3 2019, perhaps calling into question its sky high share price.
Expectations for quarterly EPS of $2.02 (-7.3%) on revenue of $51.7 billion (-3.8%)
Chart Thoughts
Apple is trading up 79% year to date. However, after reaching an all time high of $400, the stock has been in decline dropping through its ascending trendline and heads straight for its 50 day moving average at $350. Failure of this level to hold could see a deeper sell off back towards the $320 pre-covid level before opening the doors to 100 sma close to $310.
Amazon
The stock reports as it is trading more than 55% higher YTD boosted by its e-commerce strength and its AWS cloud platform. Costs will once again be under the spotlight in Q2 earnings, particularly after Jeff Bezos said that he was less focused on near term profits, instead prioritizing improving the customer experience. Earnings come at a time when investors are starting to rotate out of stay at home stocks into value stocks. Expectations are for EPS $1.63 on revenue of $63.40 billion.
Chart thoughts
Whilst Amazon might have dropped sharply across the previous week, the stock remains above its 50, 100 and 200 daily moving averages and just above its ascending trendline as it finds support at the key psychological $3000 mark. Should this level hold we could see the stock look to take on its all-time high of $3344.
On the flip side, immediate resistance from the ascending trendline can be seen around the $2920 level, prior to support at $2800 and around $2630.
This report is intended for general circulation only. It should not be construed as a recommendation, or an offer (or solicitation of an offer) to buy or sell any financial products. The information provided does not take into account your specific investment objectives, financial situation or particular needs. Before you act on any recommendation that may be contained in this report, independent advice ought to be sought from a financial adviser regarding the suitability of the investment product, taking into account your specific investment objectives, financial situation or particular needs.
StoneX Financial Pte. Ltd., may distribute reports produced by its respective foreign entities or affiliates within the StoneX group of companies or third parties pursuant to an arrangement under Regulation 32C of the Financial Advisers Regulations. Where the report is distributed to a person in Singapore who is not an accredited investor, expert investor or an institutional investor (as defined in the Securities Futures Act), StoneX Financial Pte. Ltd. accepts legal responsibility to such persons for the contents of the report only to the extent required by law. Singapore recipients should contact StoneX Financial Pte. Ltd. at 6826 9988 for matters arising from, or in connection with the report.
In the case of all other recipients of this report, to the extent permitted by applicable laws and regulations neither StoneX Financial Pte. Ltd. nor its associated companies will be responsible or liable for any loss or damage incurred arising out of, or in connection with, any use of the information contained in this report and all such liability is hereby expressly disclaimed. No representation or warranty is made, express or implied, that the content of this report is complete or accurate.
StoneX Financial Pte. Ltd. is not under any obligation to update this report.
Trading CFDs and FX on margin carries a high level of risk that may not be suitable for some investors. Consider your investment objectives, level of experience, financial resources, risk appetite and other relevant circumstances carefully. The possibility exists that you could lose some or all of your investments, including your initial deposits. If in doubt, please seek independent expert advice. Visit www.cityindex.com/en-sg/terms-and-policies for the complete Risk Disclosure Statement.
ALL TRADING INVOLVES RISKS. LOSSES CAN EXCEED DEPOSITS.
City Index is a trading name of StoneX Financial Pte. Ltd. (“SFP”) for the offering of dealing services in Contracts for Differences (“CFD”). SFP holds a Capital Markets Services Licence issued by the Monetary Authority of Singapore for Dealing in Exchange-Traded Derivatives Contracts, Over-the-Counter Derivatives Contracts, and Spot Foreign Exchange Contracts for the Purposes of Leveraged Foreign Exchange Trading. SFP is also both Derivatives Trading and Clearing member of the Singapore Exchange (“SGX”). SFP is a wholly-owned subsidiary of StoneX Group Inc.
The information provided herein is intended for general circulation. It does not take into account the specific investment objectives, financial situation or particular needs of any particular person. You should take into account your specific investment objectives, financial situation or particular needs before making a commitment to invest, including seeking advice from an independent financial adviser regarding the suitability of the investment, under a separate engagement, as you deem fit. No representation or warranty is given as to the accuracy or completeness of this information. Consequently, any person acting on it does so entirely at their own risk.
The information does not represent an offer of, or solicitation for, a transaction in any investment product. Any views and opinions expressed may be changed without an update. To understand the risks and costs involved, please visit the section captioned “Important Information” and the “Risk Disclosure Statement”.
The information herein is not directed to, or intended for distribution to or use by, any person or entity who is a citizen or resident of or located in any locality, state, country or other jurisdiction where such distribution, publication, availability or use would be contrary to law or regulation.
StoneX Financial Pte. Ltd. 1 Raffles Place, #18-61, One Raffles Place Tower 2, Singapore 048616. Tel: 6309 1000. Co. Reg. No.: 201130598R.
This advertisement has not been reviewed by the Monetary Authority of Singapore.
© City Index 2024