WTI turns lower even as crude stocks fall
Crude oil prices managed to end Tuesday’s session in the positive territory after some strong selling pressure in the first two trading days of the month. The price recovery was in part driven by profit-taking ahead of the usual weekly oil reports from the American Petroleum Institute (API) on Tuesday evening and the Energy Information Admiration (EIA) today. As the API had reported a sharper-than-expected drop in crude and gasoline stocks last night, WTI was able to gain further ground this morning. Oil speculators were thus expecting to see a drawdown in the official numbers. Indeed, the EIA reported a relatively sharp 4.4 million barrel decline in oil stocks. Unsurprisingly, WTI initially shot higher in response to this seemingly bullish oil report, before falling back a good one dollar to trade in the negative territory.
WTI’s failure to respond more favourably to the crude inventories report doesn’t surprise me in this current weak environment. The 4.4 million barrel drawdown in crude inventories was never going to be a game changer anyway – it merely represents a drop in the ocean – and some of the decline was already priced in following the API’s report from last night. Also, bear in mind that gasoline stocks actually rose while US oil production increased further. It is worth pointing out that sometimes the failure of price to respond as expected can actually be more important than the news itself. Oil “should” have rallied but it didn’t; this is a very bearish outcome in my view as it suggests that the bears are still in the driving seat.
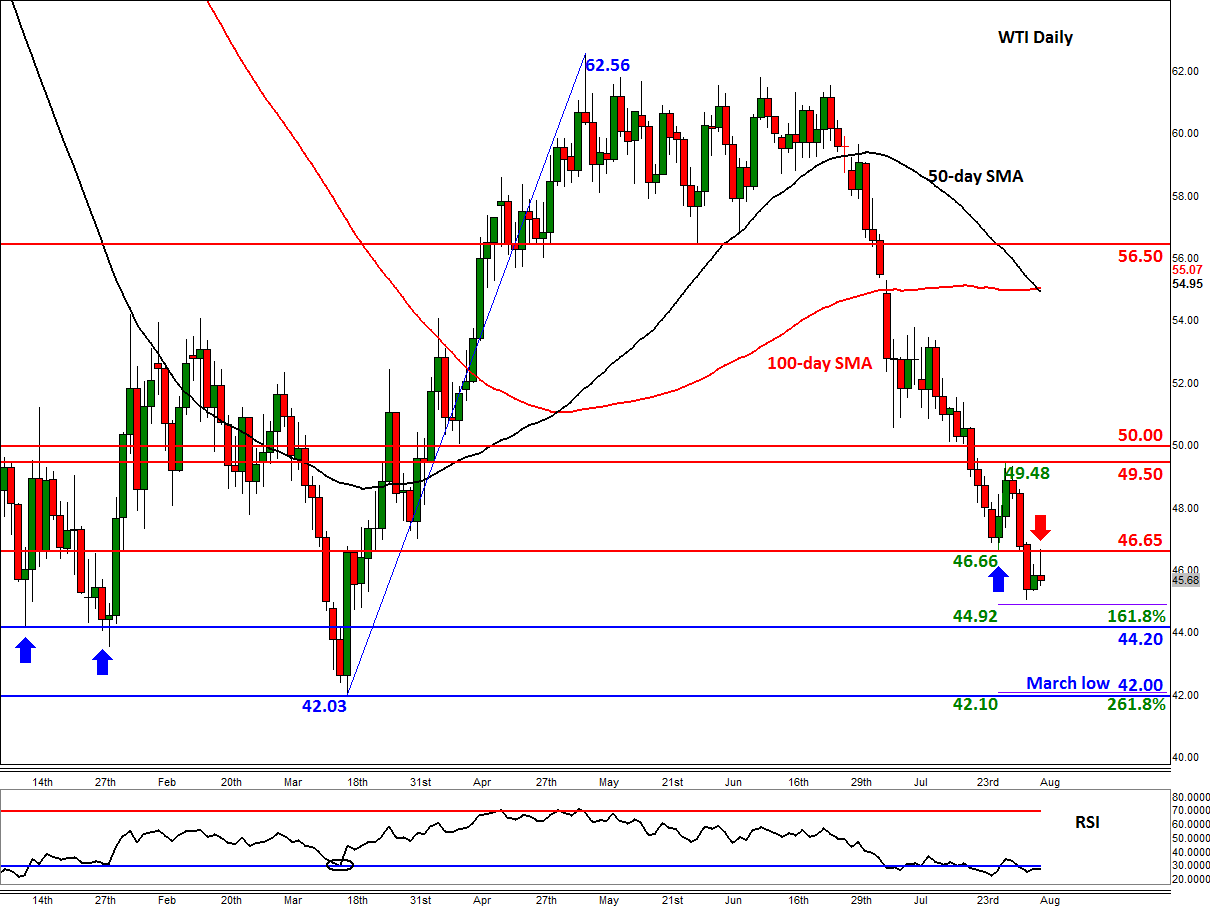
US oil’s behaviour post the crude stockpiles report makes even more sense when you look at the charts. As the daily chart shows, below, WTI turned lower from where it “should” have i.e. $46.65 – the previous support level. In downward trending markets, once a support level breaks down it usually turns into resistance in the future. This common behaviour of price action is what we have seen again today. Also, the dollar’s kickback rally in response to a very good ISM services PMI report is another reason why oil and some other buck-denominated commodities like gold have turned lower.
Going forward, for as long as WTI remains below $46.65 on a daily closing basis, the short-term bias would remain bearish. As such, the path of least resistance remains to the downside. Oil may now go on to head towards the supports shown on the chart, including $44.90 (a 161.8% Fibonacci extension level), $44.20 and the March low at $42.00. Alternatively, a closing break above $46.65 would violate the near-term down trend and in this scenario oil could easily head back towards the prior resistance levels of $49.50 or even $50.00 before making its next move.
StoneX Financial Ltd (trading as “City Index”) is an execution-only service provider. This material, whether or not it states any opinions, is for general information purposes only and it does not take into account your personal circumstances or objectives. This material has been prepared using the thoughts and opinions of the author and these may change. However, City Index does not plan to provide further updates to any material once published and it is not under any obligation to keep this material up to date. This material is short term in nature and may only relate to facts and circumstances existing at a specific time or day. Nothing in this material is (or should be considered to be) financial, investment, legal, tax or other advice and no reliance should be placed on it.
No opinion given in this material constitutes a recommendation by City Index or the author that any particular investment, security, transaction or investment strategy is suitable for any specific person. The material has not been prepared in accordance with legal requirements designed to promote the independence of investment research. Although City Index is not specifically prevented from dealing before providing this material, City Index does not seek to take advantage of the material prior to its dissemination. This material is not intended for distribution to, or use by, any person in any country or jurisdiction where such distribution or use would be contrary to local law or regulation.
For further details see our full non-independent research disclaimer and quarterly summary.
CFDs are complex instruments and come with a high risk of losing money rapidly due to leverage. 69% of retail investor accounts lose money when trading CFDs with this provider. You should consider whether you understand how CFDs work and whether you can afford to take the high risk of losing your money. CFD and Forex Trading are leveraged products and your capital is at risk. They may not be suitable for everyone. Please ensure you fully understand the risks involved by reading our full risk warning.
City Index is a trading name of StoneX Financial Ltd. Head and Registered Office: 1st Floor, Moor House, 120 London Wall, London, EC2Y 5ET. StoneX Financial Ltd is a company registered in England and Wales, number: 05616586. Authorised and regulated by the Financial Conduct Authority. FCA Register Number: 446717.
City Index is a trademark of StoneX Financial Ltd.
The information on this website is not targeted at the general public of any particular country. It is not intended for distribution to residents in any country where such distribution or use would contravene any local law or regulatory requirement.
© City Index 2024