WTI crude oil breaks 50 barrier
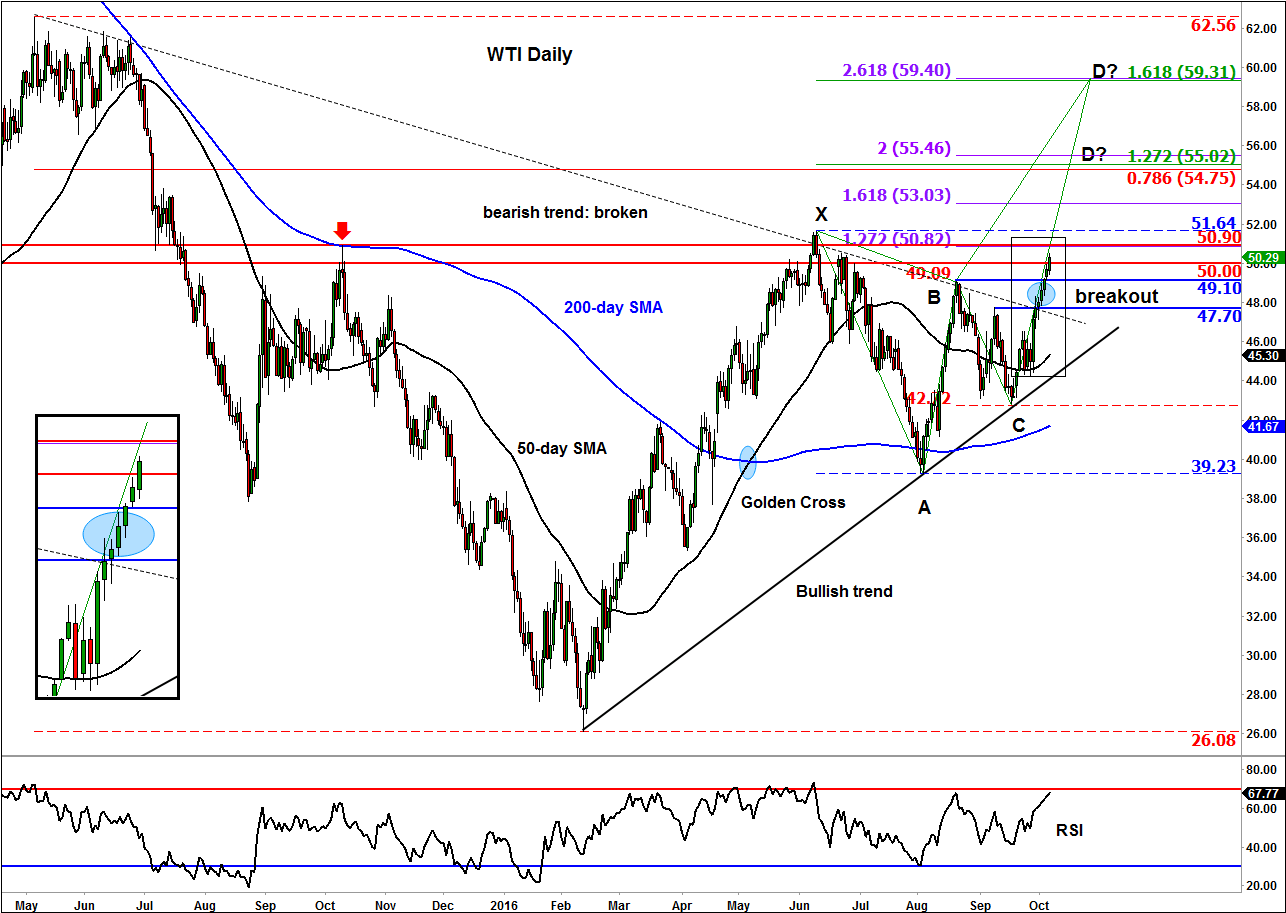
Crude oil prices are on track to rise for the seventh consecutive day. For the first time since June, a barrel of oil in the US costs more than $50 again. From around $44.50 a barrel towards the end of last month to today’s current high of $50.50, WTI has thus risen a solid $6 or in percentage terms more than 13%. While some would argue that the buying may be a little overdone, there is still no end in sight for the current bullish run. Speculators have been buying every short term dip, a strategy that has evidently been working very well so far. This trend could well continue for some yet as after all crude oil’s fundamental outlook continues to improve: as well as the planned OPEC oil output cut, we have seen surprise inventory destocking in the US for five straight weeks now. Consequently, US oil stocks have now fallen below 500 million barrels for the first time since January. In addition to the prospects of reduced supply, the outlook for oil demand appears to be healthy too, judging by this week’s key US economic data which have been mostly positive, with the key ISM manufacturing and services sector PMIs both coming in stronger than expected and unemployment claims unexpectedly falling last week to near a 43-year low. Buck-denominated oil prices are also showing resilience against the surging dollar, too, which is another bullish sign that not many people are talking about.
On top of all the fundamental factors, the recent breakout above key short-term resistance levels have probably encouraged momentum-based buying interest, too. WTI appears to be heading towards $50.90, a level which had been resistance in the past. If it manages to break above here then the top of the recent range at $51.65 could be the next bullish target to watch. I, however, think the rally could potentially go much further, obviously not in a straight line. A couple of very interesting levels that I would be watching are around $55 and then at $59.30/40. As can be seen on the chart, these are where several Fibonacci levels converge, which make them ideal profit-target areas for market participants who like myself use the Fibonacci tool in their analysis and trading. So there is the potential for WTI to climb to those levels and possibly find resistance there amid profit-taking. As things stand only a potential drop back below old resistances at $49.10 or $47.70 would invalidate our technical bullish view on WTI oil.
StoneX Financial Ltd (trading as “City Index”) is an execution-only service provider. This material, whether or not it states any opinions, is for general information purposes only and it does not take into account your personal circumstances or objectives. This material has been prepared using the thoughts and opinions of the author and these may change. However, City Index does not plan to provide further updates to any material once published and it is not under any obligation to keep this material up to date. This material is short term in nature and may only relate to facts and circumstances existing at a specific time or day. Nothing in this material is (or should be considered to be) financial, investment, legal, tax or other advice and no reliance should be placed on it.
No opinion given in this material constitutes a recommendation by City Index or the author that any particular investment, security, transaction or investment strategy is suitable for any specific person. The material has not been prepared in accordance with legal requirements designed to promote the independence of investment research. Although City Index is not specifically prevented from dealing before providing this material, City Index does not seek to take advantage of the material prior to its dissemination. This material is not intended for distribution to, or use by, any person in any country or jurisdiction where such distribution or use would be contrary to local law or regulation.
For further details see our full non-independent research disclaimer and quarterly summary.
CFDs are complex instruments and come with a high risk of losing money rapidly due to leverage. 69% of retail investor accounts lose money when trading CFDs with this provider. You should consider whether you understand how CFDs work and whether you can afford to take the high risk of losing your money. CFD and Forex Trading are leveraged products and your capital is at risk. They may not be suitable for everyone. Please ensure you fully understand the risks involved by reading our full risk warning.
City Index is a trading name of StoneX Financial Ltd. Head and Registered Office: 1st Floor, Moor House, 120 London Wall, London, EC2Y 5ET. StoneX Financial Ltd is a company registered in England and Wales, number: 05616586. Authorised and regulated by the Financial Conduct Authority. FCA Register Number: 446717.
City Index is a trademark of StoneX Financial Ltd.
The information on this website is not targeted at the general public of any particular country. It is not intended for distribution to residents in any country where such distribution or use would contravene any local law or regulatory requirement.
© City Index 2024