WTI crude drops to 40 as oil stocks jump
WTI crude oil fell on the back of data from the US Department of Energy which showed US oil stockpiles rose by a sharp 9.4 million barrels last week. This more or less confirmed the data that was released by the American Petroleum Institute (API) the night before, but it still disappointed the expectations of a much smaller build. However crude stocks at Cushing fell, while gasoline inventories declined by a sharp 4.6 million barrels. So it wasn’t as bad a report as the headline figure made it out to be. Stockpiles have been rising relentlessly despite signs of lower oil output in recent months. But it should be noted that during this time of the year when refineries carry out their maintenance works ahead of the driving season, inventories do tend to rise. Thus, the build is not too much of a surprise. US oil inventories should begin to fall once the driving season starts, while the potential deal between Russia and the OPEC to freeze oil production should also help to reduce the imbalance between demand and supply in the oil market. For that reason, I don’t expect this to be the start of another major downward trend.
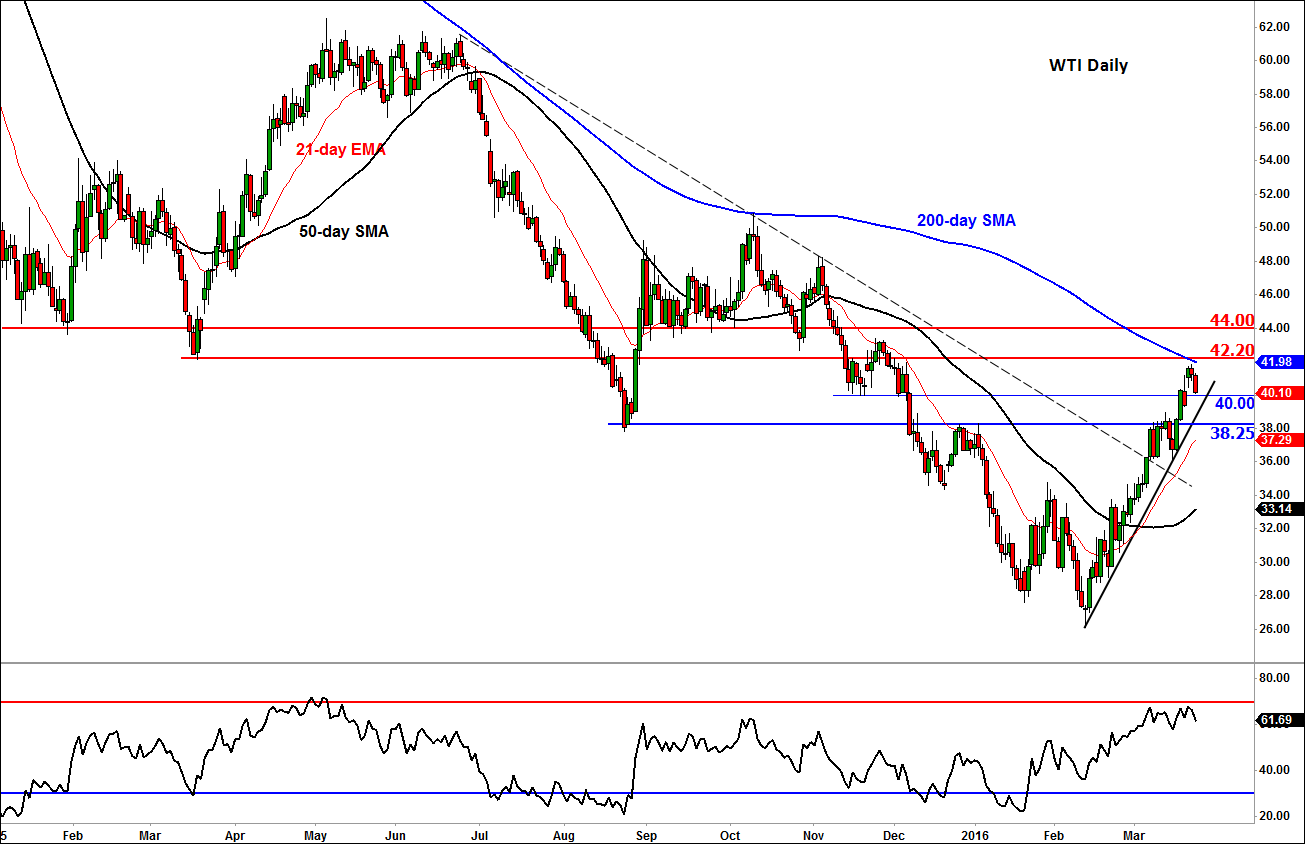
Indeed despite today’s sell-off, price action on both Brent and WTI has been looking bullish of late. So, this could just be a normal pullback in an upward trending market. While WTI may be pulling away from the still-declining 200-day moving average (which comes in around $42.00), the 50-day simple and the faster-moving 21-day exponential moving averages are both pointing higher now. At the time of this writing, WTI was testing the psychological $40 handle, although a more significant support level comes in somewhere in the region of $38.25 which was formerly resistance. The near-term outlook would only turn bearish if and when this level breaks down on daily closing basis.
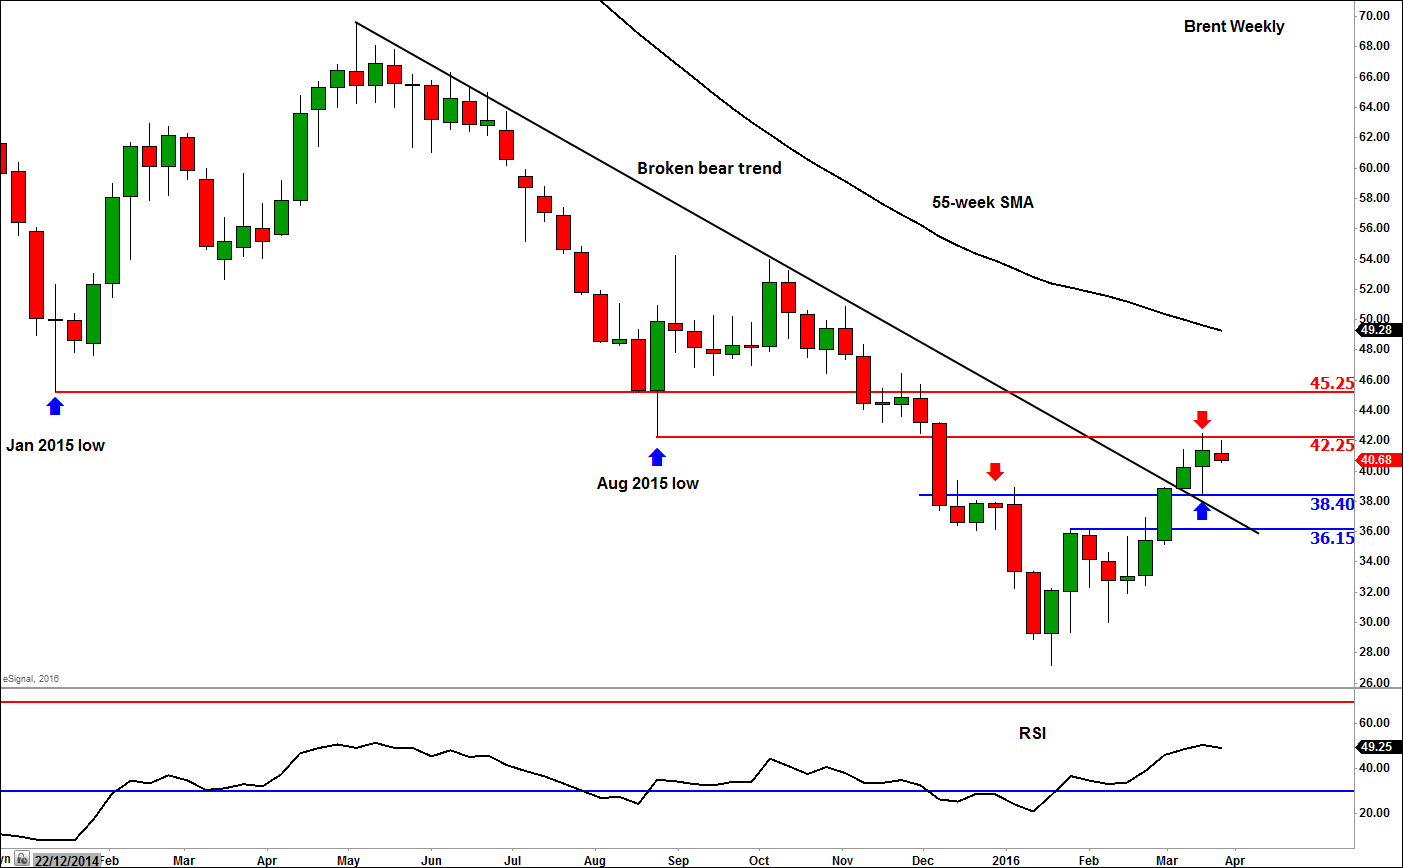
Meanwhile the weekly chart of Brent shows crude oil has found some resistance at the prior support level of $42.25, which was a temporary low established back in August 2015. This level is a key reference point for traders and the hesitation here should not come as a major surprise. Should we move above $42.25 at some point then it would strongly suggest that a more significant low has been established for oil. So far however the bears have managed to defend this key psychological hurdle. Another key reference point that needs to be monitored, should we get past $42.25, is the January 2015 low at $45.20/5.
While Brent oil holds below $42.25, a potential drop back towards old resistance-turned-support at $38.40 is a possibility. The medium term trend for Brent would only turn bearish if and when it moves back below the broken bearish trend line.
StoneX Financial Ltd (trading as “City Index”) is an execution-only service provider. This material, whether or not it states any opinions, is for general information purposes only and it does not take into account your personal circumstances or objectives. This material has been prepared using the thoughts and opinions of the author and these may change. However, City Index does not plan to provide further updates to any material once published and it is not under any obligation to keep this material up to date. This material is short term in nature and may only relate to facts and circumstances existing at a specific time or day. Nothing in this material is (or should be considered to be) financial, investment, legal, tax or other advice and no reliance should be placed on it.
No opinion given in this material constitutes a recommendation by City Index or the author that any particular investment, security, transaction or investment strategy is suitable for any specific person. The material has not been prepared in accordance with legal requirements designed to promote the independence of investment research. Although City Index is not specifically prevented from dealing before providing this material, City Index does not seek to take advantage of the material prior to its dissemination. This material is not intended for distribution to, or use by, any person in any country or jurisdiction where such distribution or use would be contrary to local law or regulation.
For further details see our full non-independent research disclaimer and quarterly summary.
CFDs are complex instruments and come with a high risk of losing money rapidly due to leverage. 69% of retail investor accounts lose money when trading CFDs with this provider. You should consider whether you understand how CFDs work and whether you can afford to take the high risk of losing your money. CFD and Forex Trading are leveraged products and your capital is at risk. They may not be suitable for everyone. Please ensure you fully understand the risks involved by reading our full risk warning.
City Index is a trading name of StoneX Financial Ltd. Head and Registered Office: 1st Floor, Moor House, 120 London Wall, London, EC2Y 5ET. StoneX Financial Ltd is a company registered in England and Wales, number: 05616586. Authorised and regulated by the Financial Conduct Authority. FCA Register Number: 446717.
City Index is a trademark of StoneX Financial Ltd.
The information on this website is not targeted at the general public of any particular country. It is not intended for distribution to residents in any country where such distribution or use would contravene any local law or regulatory requirement.
© City Index 2024