Why Dow 20K is good not 8220 great 8221
Great expectations
So the so-called ‘Trump trade’ strikes back and finally takes the Dow 20K prize. The President didn’t miss the chance to tag the largely symbolic win as partly his doing with an inevitable tweet —”Great! #Dow20K”.
Mostly though, Trump has had little directly to do with the trade flows named, not without irony, after him.
In a world of ‘animal spirits’ it seems to matter when the President rattles off a barrage of executive orders within days of taking office. Less so that they were already well-flagged, or that so far, are barely economically accretive: the wall along the border with Mexico, Obamacare repeal and certain temporary immigration controls.
A raft of solid quarterly figures by major-name companies is playing a bigger part. The tally of better-than-expected earnings now stands around 70% of the 100 or so S&P 500 firms to have reported so far. A busy, well-publicised slate of briefings with dozens of business leaders telegraphed optimism too.
And for now, market momentum continues to be partly fuelled by that optimism on Trump’s zeal for deregulation, tax cuts, and fiscal stimulus. But the same ‘Trump-flation’ uncertainties—lack of policy detail, a Republican rather than anti-establishment Congress—remain.
Thank the banks
The question is whether the market is more or less at risk of a reversal now, than in late December. The 8-year uptrend is making many participants reluctant to opt for conventional logic, but that ascent also brought regular harsh lessons for uber-optimists. And right now, bullishness is pervasive. The Dow’s trailing P/E of 20.6 is the highest in 7 years. That sets a high bar for upside earnings surprises to justify the rich rating. The current Wall St consensus for Q4 earnings to grow 6.8% year-on-year—according to Thomson Reuters data—won’t quite cut it, if accurate.
Furthermore, most of the heavy lifting that powered the Dow to its magic barrier was done by relatively few market segments, mainly financials. Banks have been among the best performers since the election on 8th November, but Goldman Sachs alone accounts for some 170 points of the market’s 42-session surge above 19,000, the largest contribution by one stock. Together with rival JPMorgan, GS contributed 20% of the rise.
The other Trump risk, protectionist trade measures, is also not far from investors’ minds. Diplomatic language out of China this week, calling such a scenario a “lose-lose” situation, is a clear enough threat of retaliation against tariffs which Trump has said could be as high as 45%.
Still, the Dow’s largely symbolic importance for the American stock market is also of course blessing. DJIA is no longer a benchmark. Data from S&P Dow Jones Indices shows $35.9bn indexed against DJIA vs. $2.1T against the S&P 500. The most influential market participants will therefore take the Dow’s achievement of a nice round number as just that.
Technical outlook
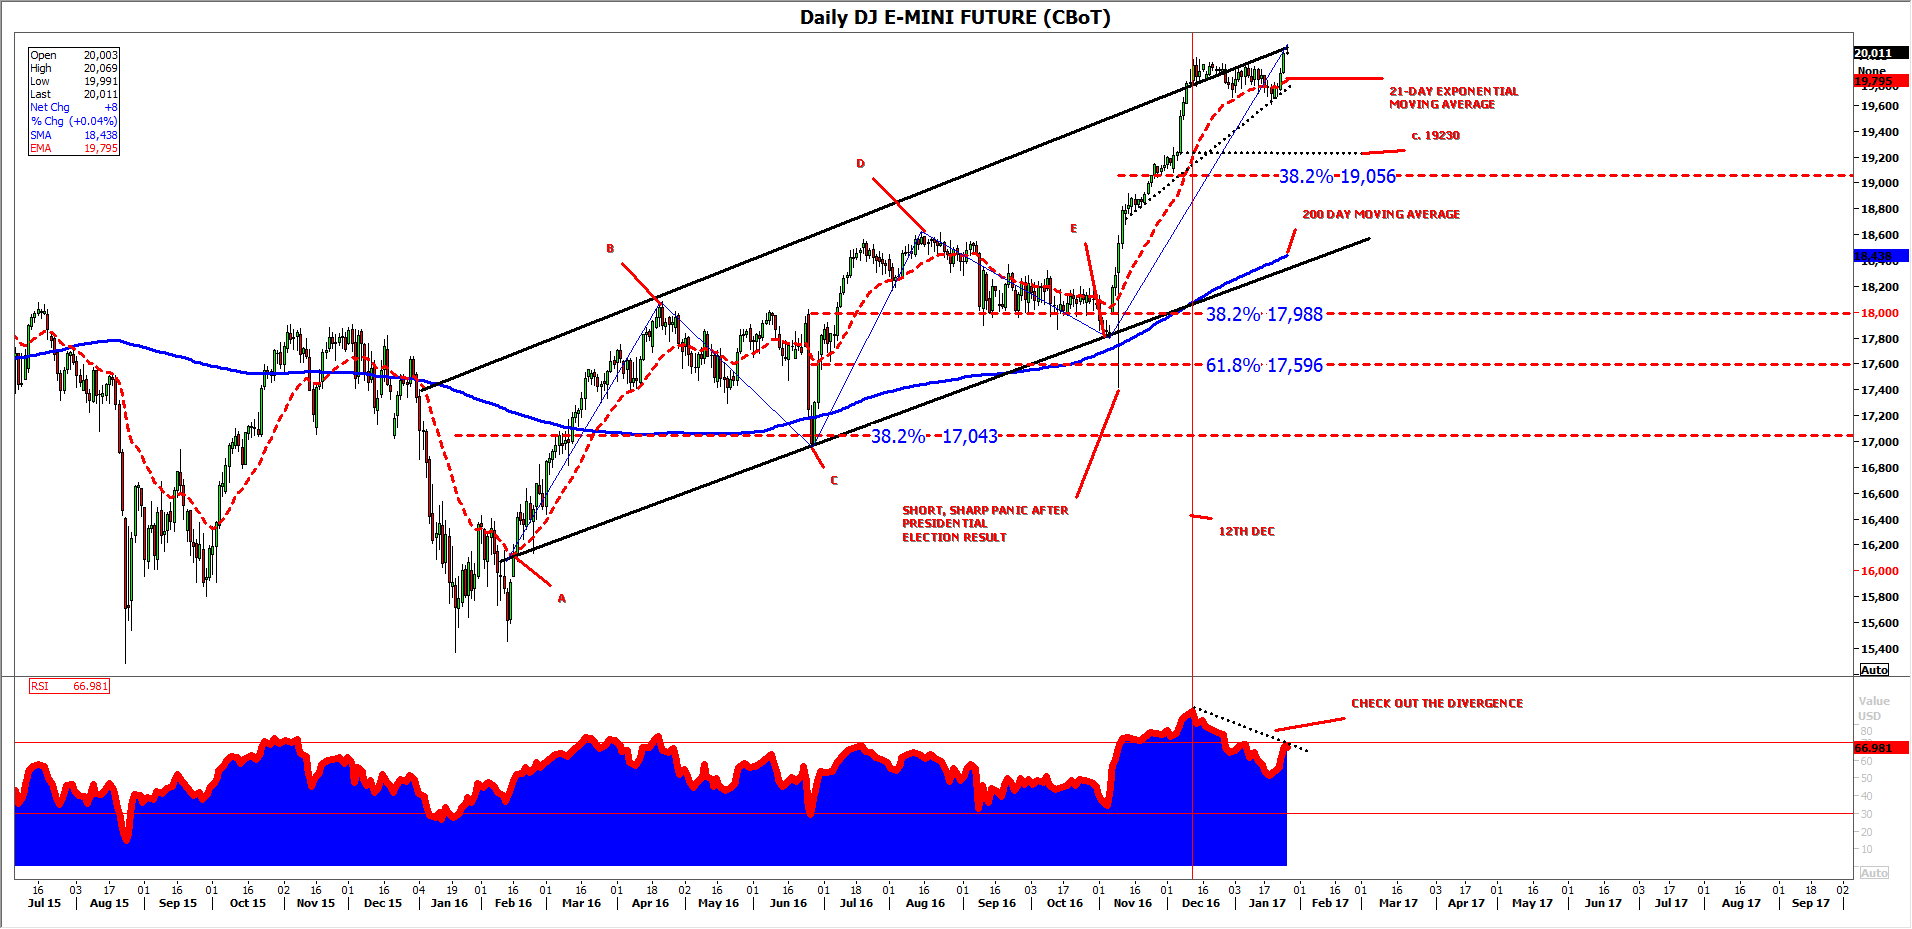
We can partly get round the slight pointlessness of technically analysing DJIA by looking at traded derivatives. Chicago Board of Trade’s e-mini future, charted below, is the closest corollary.
Like the underlying, the contract’s retracements within a reasonably clean channel since February 2016 have been sufficiently symmetrical and less than 100% of the preceding legs. (I am inclined to disregard the manic and short-lived breach of the parallel channel equating to the market’s flash of panic on the morning of the 9th November, when it became clear Donald Trump had won the election.)
With 38.2% retracements at B-C and D-E, the market (mostly!) gives the impression of orderly proceedings, backed by tests, or near tests of the closely watched gauge of annual health, the 200-day moving average.
The question of overbought momentum is less easy to sidestep, though the index’s incursion above the upper bound of its current rising channel looks more irrepressible than exhausted. Even here though, a rising wedge formed of the upper trend and a shorter-term line since 10th November would normally be expected to presage a break lower were it not theoretically misplaced in a rising trend.
A divergent Relative Strength Index (RSI), clear to the naked eye since 12th December, can be interpreted as momentum (or ‘sentiment’ or ‘conviction’) weakening, even as prices run higher. The market can of course continue to advance even when technically overbought and, as I write, the unwinding of the RSI from that state since mid-December can buy the rally more time.
The first sign that this time has run out might well be the triangle break out (as in break down) we mentioned earlier. Further confirmation would be its inability to capitalise on support implied by the impulsive up leg beginning around 19230, with better probability of more downside from a deeper retracement than 38.2%.
DAILY CHART
Please click image to enlarge; source: Thomson Reuters and City Index
StoneX Financial Ltd (trading as “City Index”) is an execution-only service provider. This material, whether or not it states any opinions, is for general information purposes only and it does not take into account your personal circumstances or objectives. This material has been prepared using the thoughts and opinions of the author and these may change. However, City Index does not plan to provide further updates to any material once published and it is not under any obligation to keep this material up to date. This material is short term in nature and may only relate to facts and circumstances existing at a specific time or day. Nothing in this material is (or should be considered to be) financial, investment, legal, tax or other advice and no reliance should be placed on it.
No opinion given in this material constitutes a recommendation by City Index or the author that any particular investment, security, transaction or investment strategy is suitable for any specific person. The material has not been prepared in accordance with legal requirements designed to promote the independence of investment research. Although City Index is not specifically prevented from dealing before providing this material, City Index does not seek to take advantage of the material prior to its dissemination. This material is not intended for distribution to, or use by, any person in any country or jurisdiction where such distribution or use would be contrary to local law or regulation.
For further details see our full non-independent research disclaimer and quarterly summary.
CFDs are complex instruments and come with a high risk of losing money rapidly due to leverage. 69% of retail investor accounts lose money when trading CFDs with this provider. You should consider whether you understand how CFDs work and whether you can afford to take the high risk of losing your money. CFD and Forex Trading are leveraged products and your capital is at risk. They may not be suitable for everyone. Please ensure you fully understand the risks involved by reading our full risk warning.
City Index is a trading name of StoneX Financial Ltd. Head and Registered Office: 1st Floor, Moor House, 120 London Wall, London, EC2Y 5ET. StoneX Financial Ltd is a company registered in England and Wales, number: 05616586. Authorised and regulated by the Financial Conduct Authority. FCA Register Number: 446717.
City Index is a trademark of StoneX Financial Ltd.
The information on this website is not targeted at the general public of any particular country. It is not intended for distribution to residents in any country where such distribution or use would contravene any local law or regulatory requirement.
© City Index 2024