Weekly Technical Outlook on Stock Indices Potential multi week corrective decline in progress
S&P 500 – Medium-term top in place
click to enlarge charts
Key Levels (1 to 3 weeks)
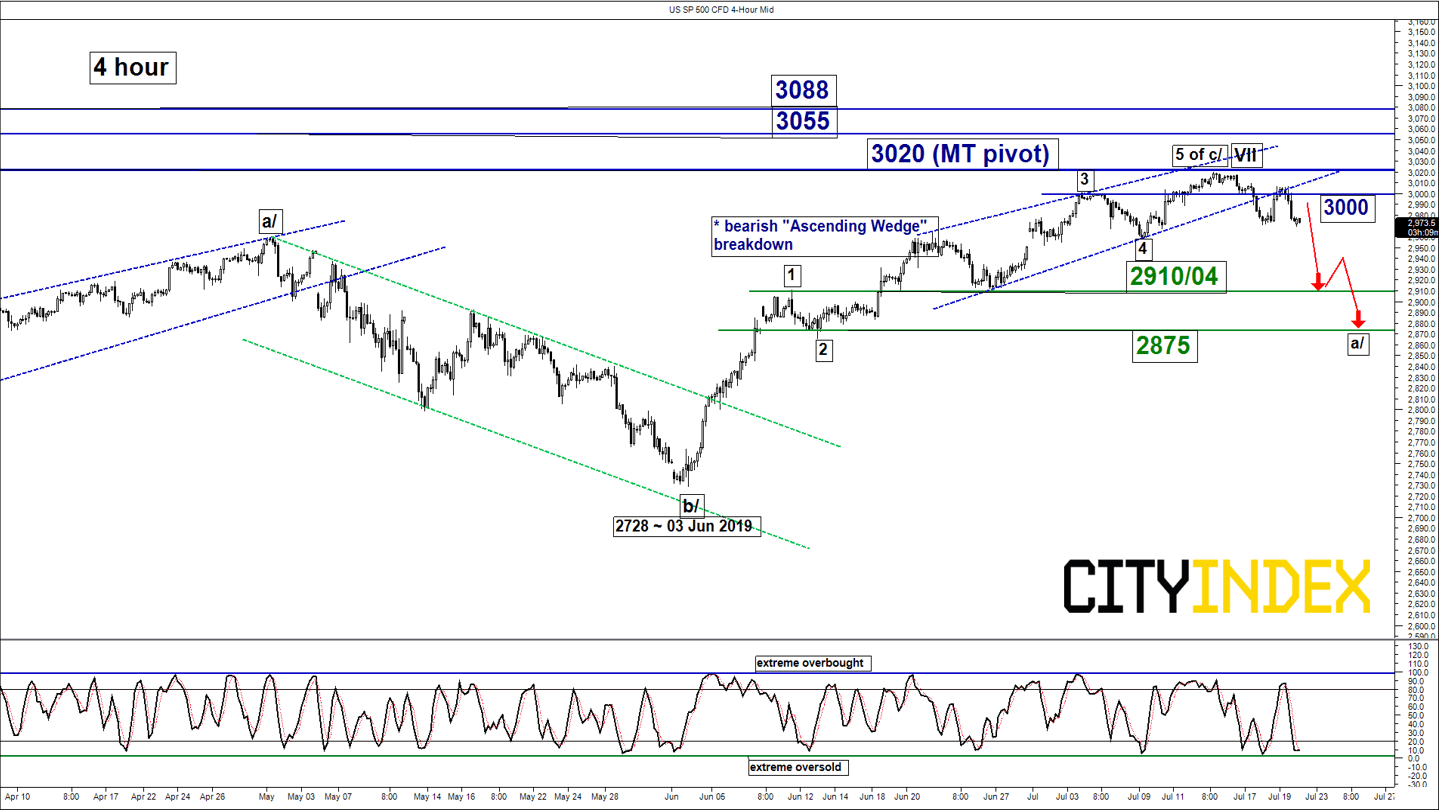
Intermediate resistance: 3000
Pivot (key resistance): 3020
Supports: 2910/04 & 2875
Next resistance: 3055 & 3088 (Fibonacci expansions)
Medium-term (1 to 3 weeks) Outlook
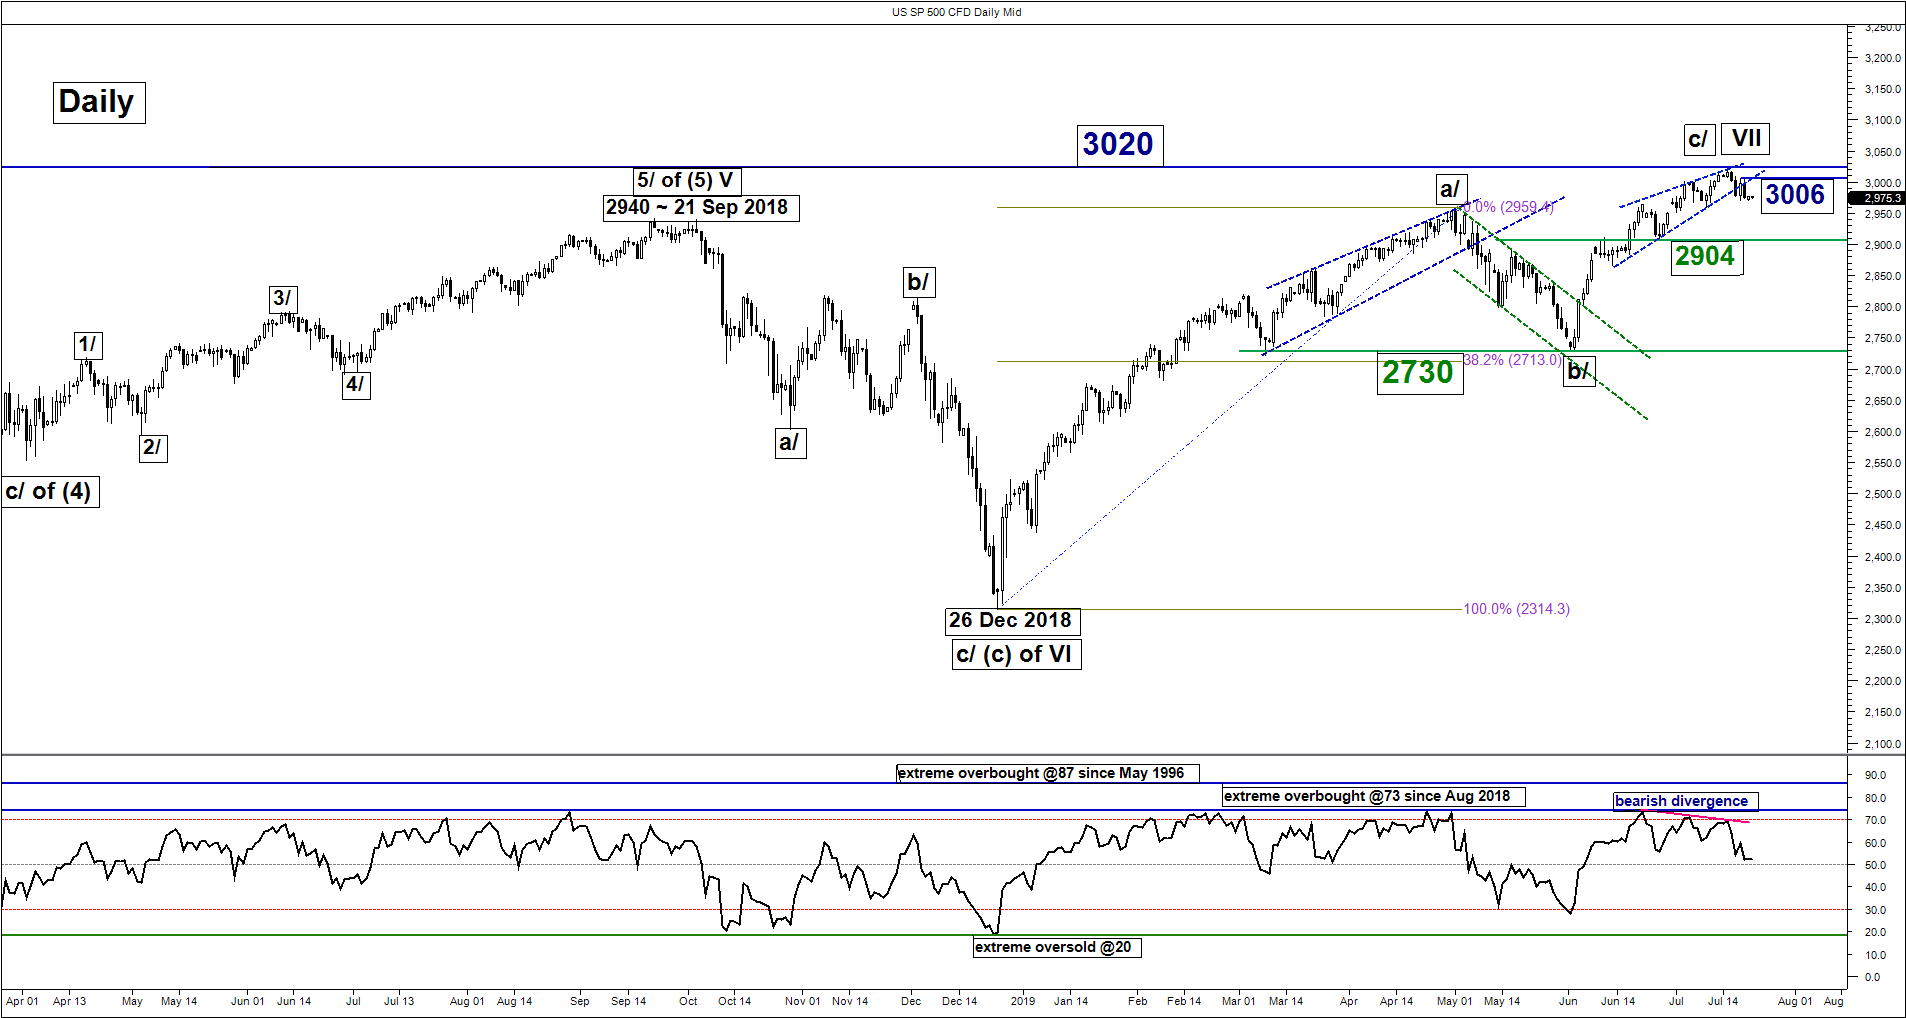
Last week, the SP 500 Index (proxy for the S&P 500 futures) has shed -1.2% and broke its prior two weeks of positive closes. Also, it has failed to stage the residual push up towards 3045/55 to complete the primary degree impulsive up move sequence in place since Dec 2018 low (Elliot Wave/fractal analysis).
In our previous weekly outlook report (click here for a recap), we have highlighted the risk of a medium-term top in the making and the Index has indeed shaped the expected bearish breakdown from the “Ascending Wedge” range configuration support, retested its pull-back resistance of 3006 on last Fri, 19 Jul before it tumbled to retest its weekly low of 2971. Key elements remain negative;
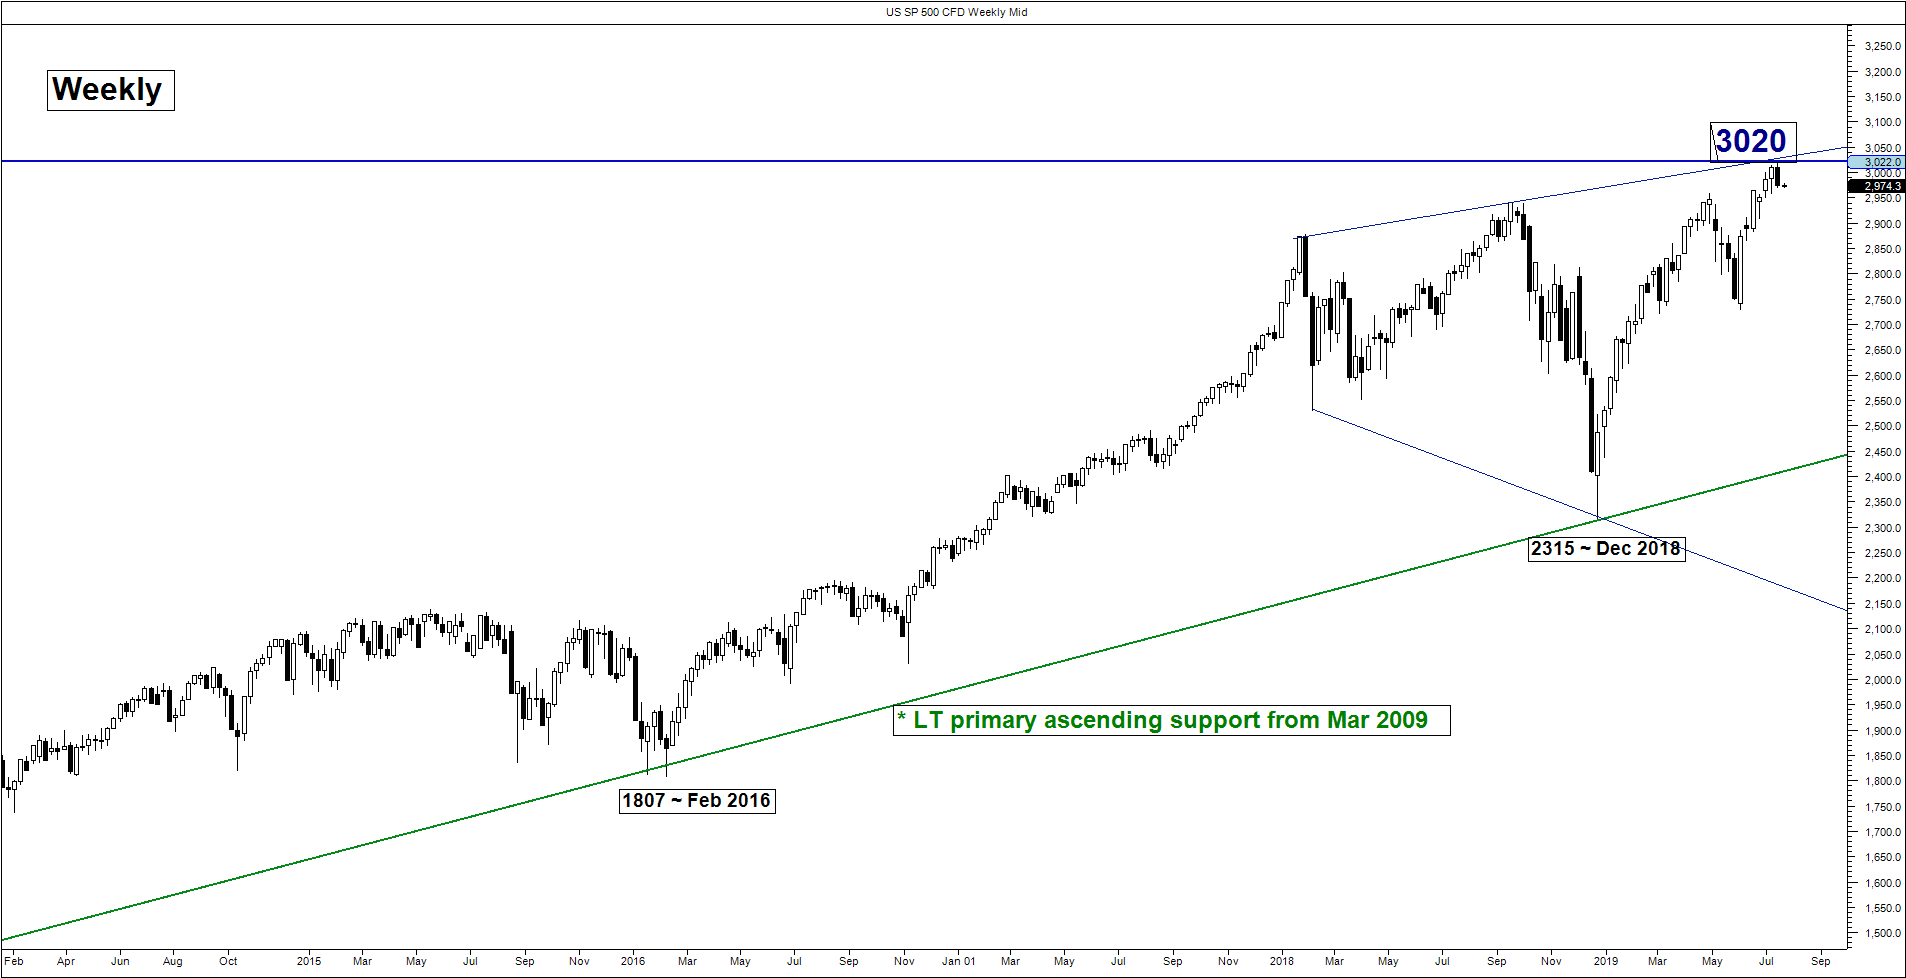
- Last week’s losses in price action of the Index has occurred right on the upper boundary of a major “Expanding Wedge” configuration in place since Jan 2018.
- The daily RSI oscillator has traced out a bearish divergence signal at an extreme overbought level of 73 which indicates a slow-down in medium-term upside momentum of price action.
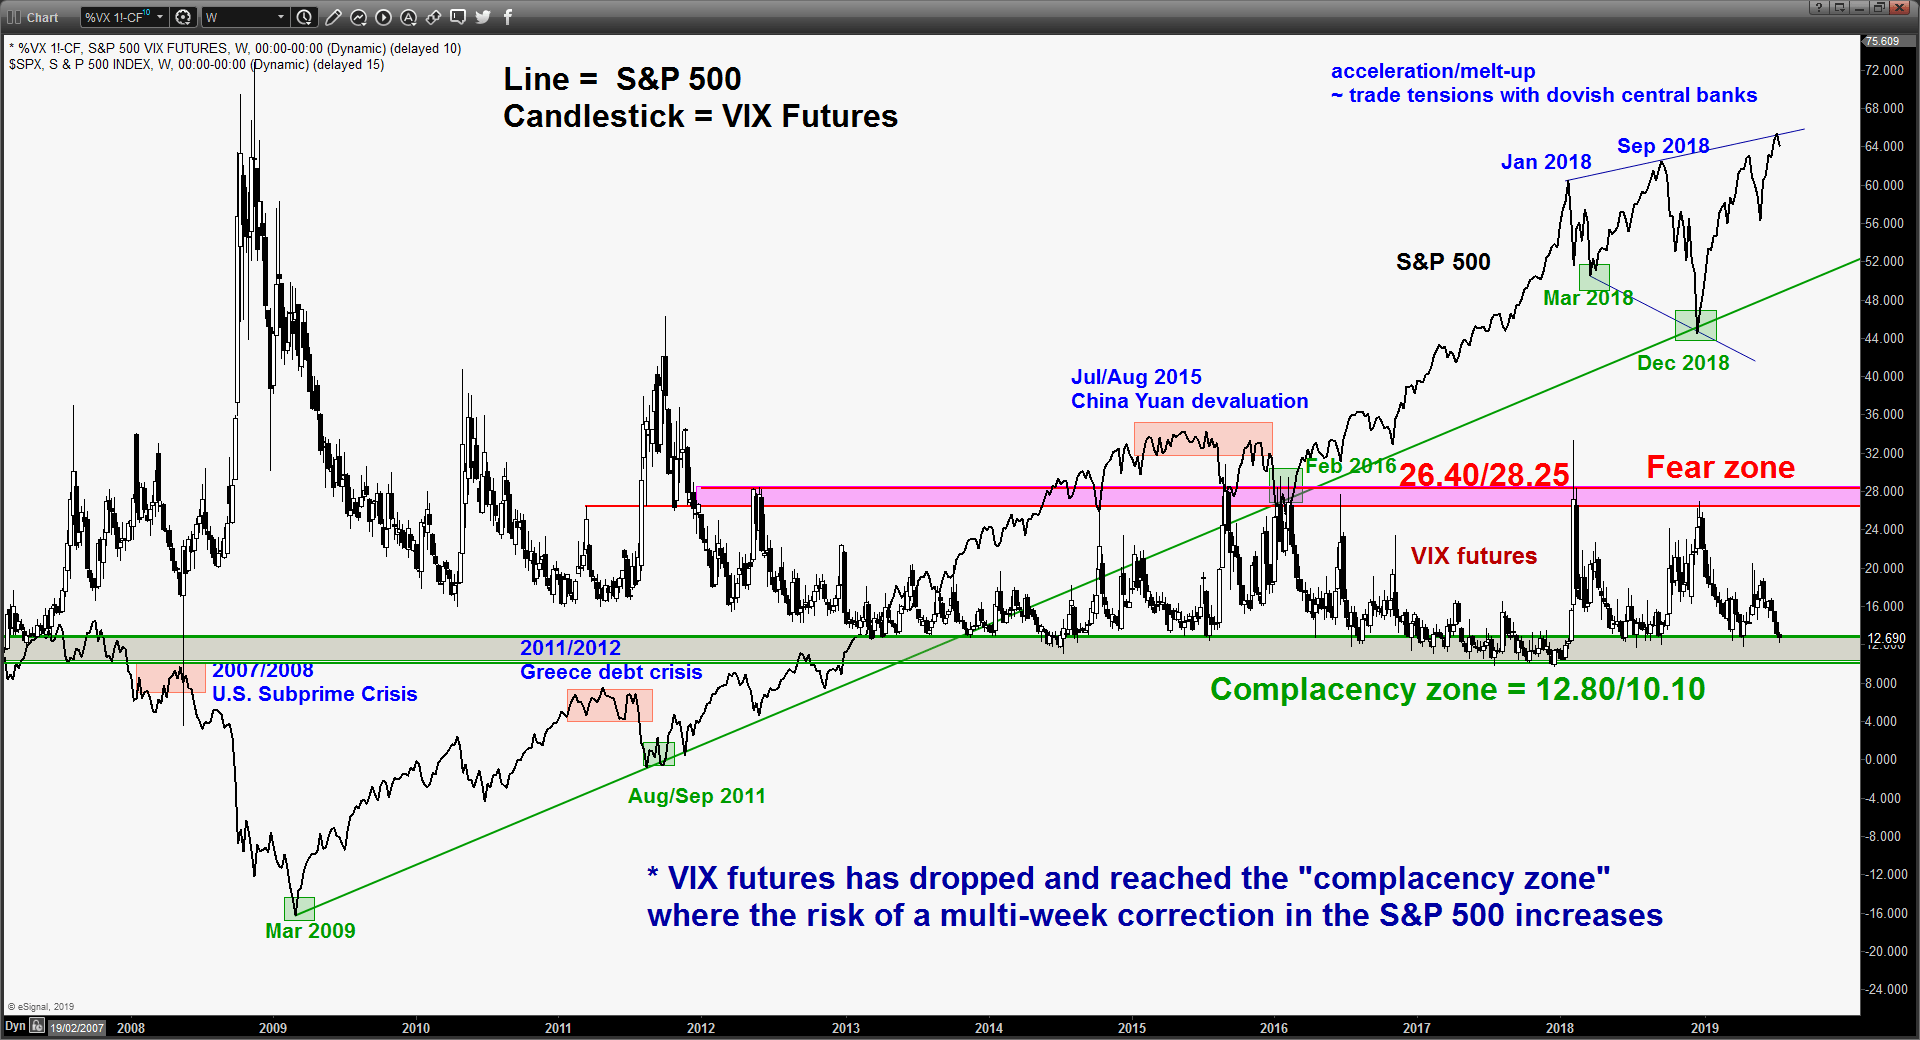
- From a contrarian opinion perspective, the VIX futures has dropped and reached a “complacency zone” of 12.80/10.10 where the risk of a multi-week corrective decline in the S&P 500 increases at this juncture.
Therefore, we maintain the bearish bias in any bounces below an adjusted key medium-term pivotal at 3020 for a further potential corrective down move to target the 2910/04 support follow by 2875 next (also the 50% Fibonacci retracement of the recent up move from 03 Jun low to 15 Jul 2019 high).
However, a clearance with a daily close above 3020 invalidates the bearish scenario for a squeeze up towards 3055 and even 3088.
Nikkei 225 – Corrective down move in progress within range configuration
click to enlarge charts
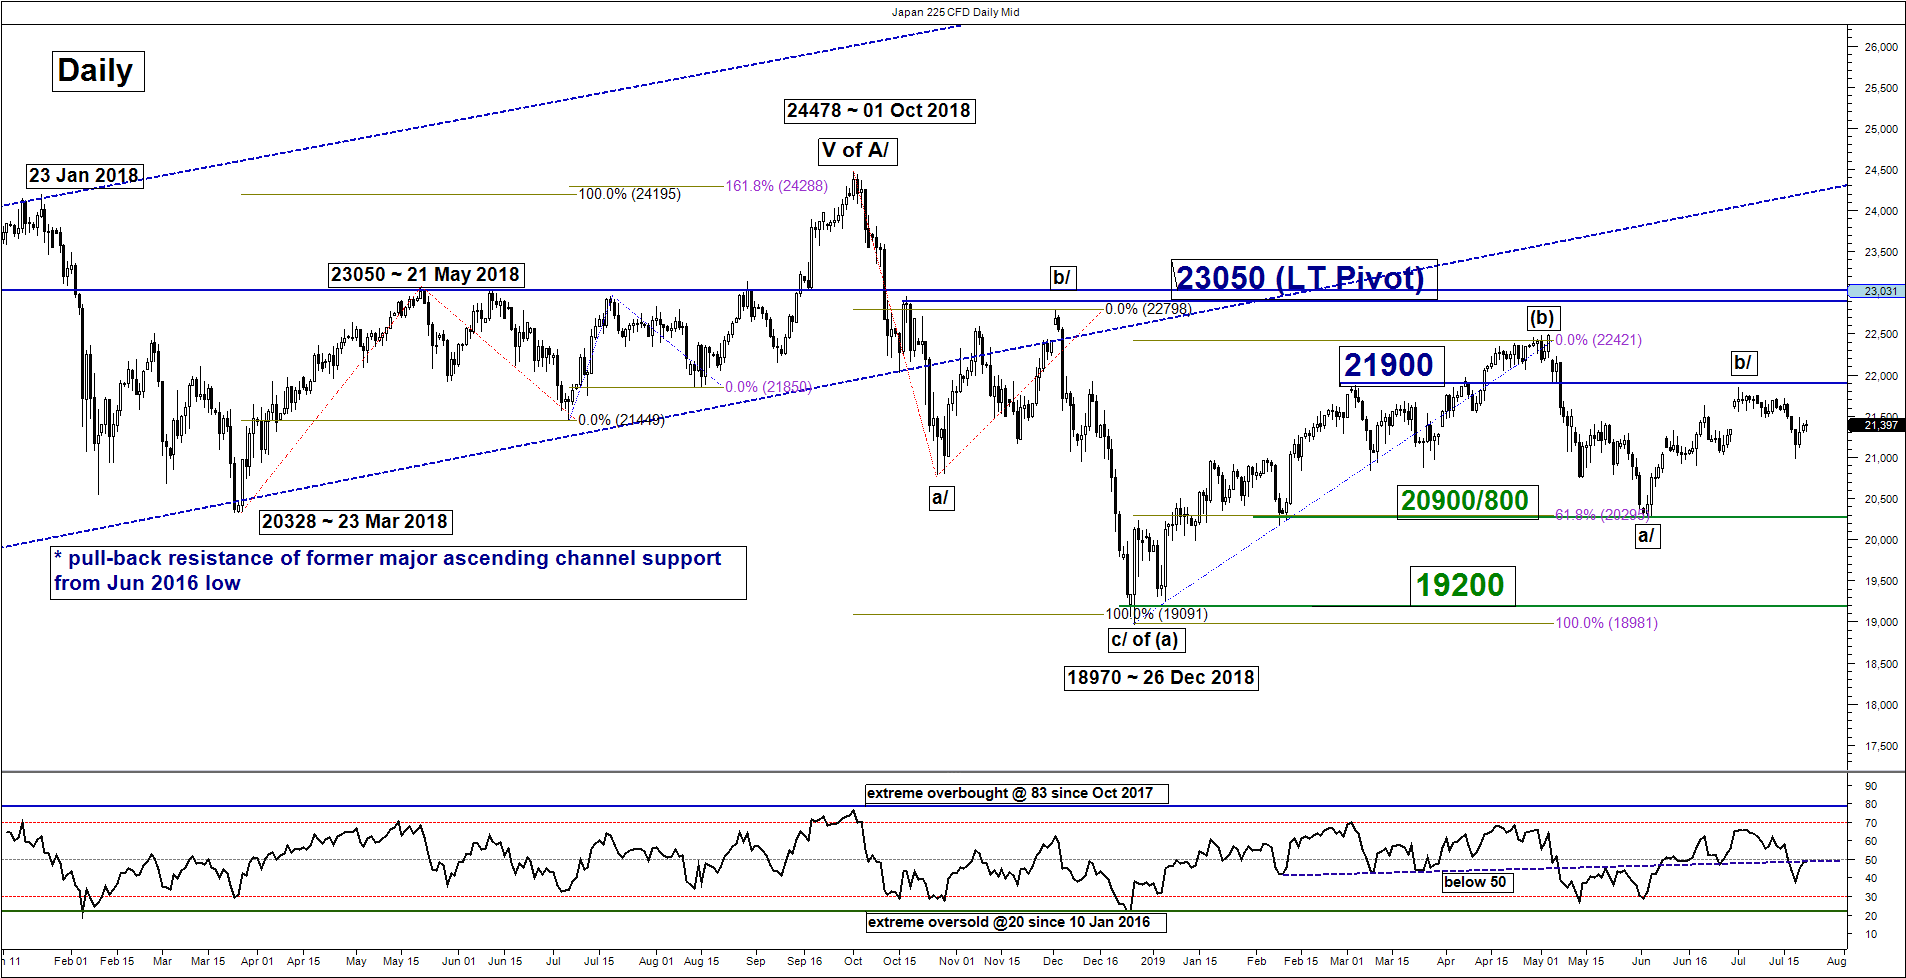
Key Levels (1 to 3 weeks)
Pivot (key resistance): 21540
Support: 20900/800
Next resistance: 21900/22000
Medium-term (1 to 3 weeks) Outlook
Last week, the Japan 225 Index (proxy for the Nikkei 225 futures) has broken below the 21500 key medium-term pivotal support and the bearish Ascending Wedge” range support where the residual push up scenario towards 219000/22000 has been invalidated.
Right now, the Index is likely to be undergoing a corrective decline within a major complex range configuration in place since Oct 2018 high of 24478. We flip to a bearish bias below the 21540 key medium-term pivotal resistance for a further potential push down to retest the 20900/800 support in the first step.
However, a daily close above 21540 invalidates the push down scenario to revive the bulls for a squeeze up towards the 21900/22000 resistance (also Fibonacci retracement/projection cluster).
Hang Seng – Mix elements, turn neutral
click to enlarge charts
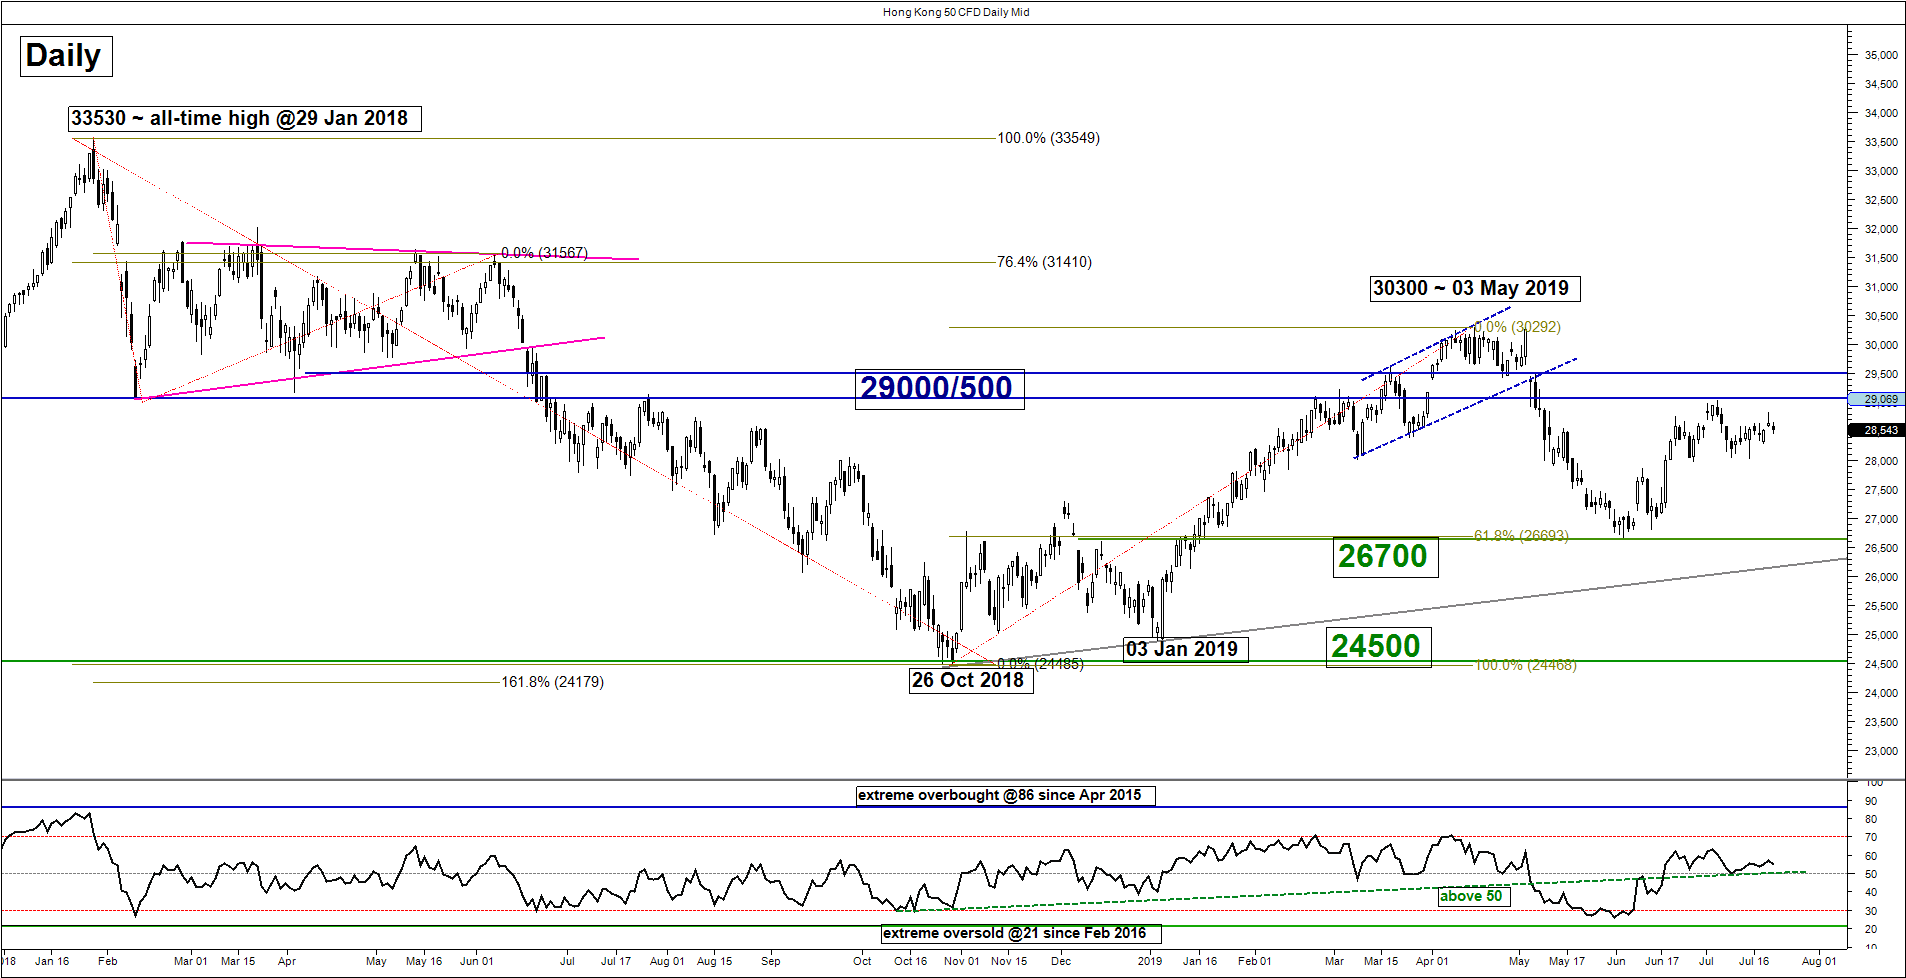
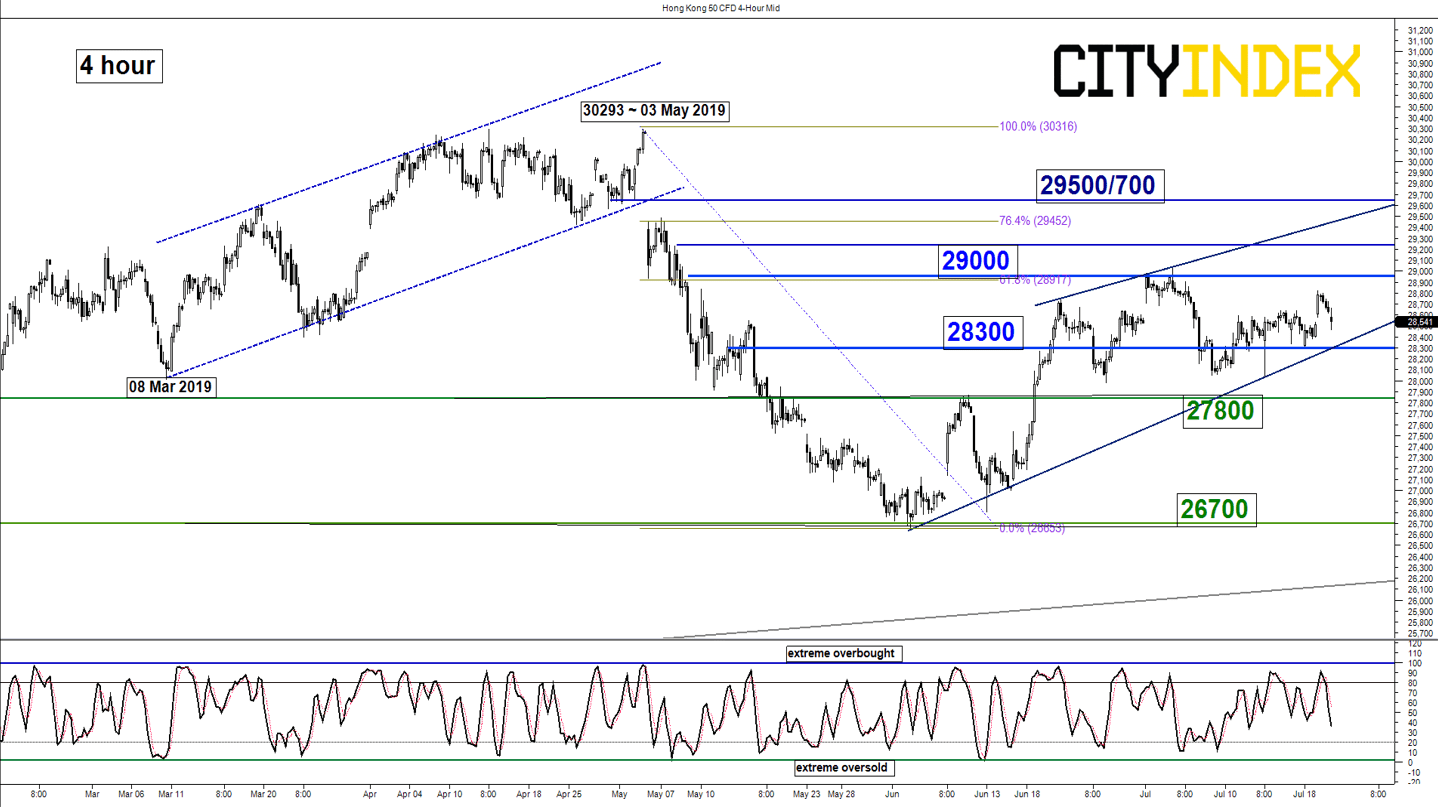
Key Levels (1 to 3 weeks)
Resistances: 29000 & 29500/700
Supports: 28300, 27800 & 26700
Medium-term (1 to 3 weeks) Outlook
Even though, the Hong Kong 50 Index (proxy for Hang Seng Index futures) has managed to hold the 28000 key medium-term pivotal support in the prior week but low conviction to stage the residual push up towards the 29500/700 resistance zone due to the bearish configuration seen in the S&P 500.
Therefore, we prefer to turn neutral now between 29000 and 28300. Only a daily close above 29000 revives the residual push up scenario to target 29500/700 next. On the flipside, a break with a daily close below 28300 opens up scope for a corrective decline towards the next support at 27800 follow by a further potential drop to retest 26700 (04 Jun 2019 swing low).
ASX 200 – Residual push up in progress
click to enlarge charts
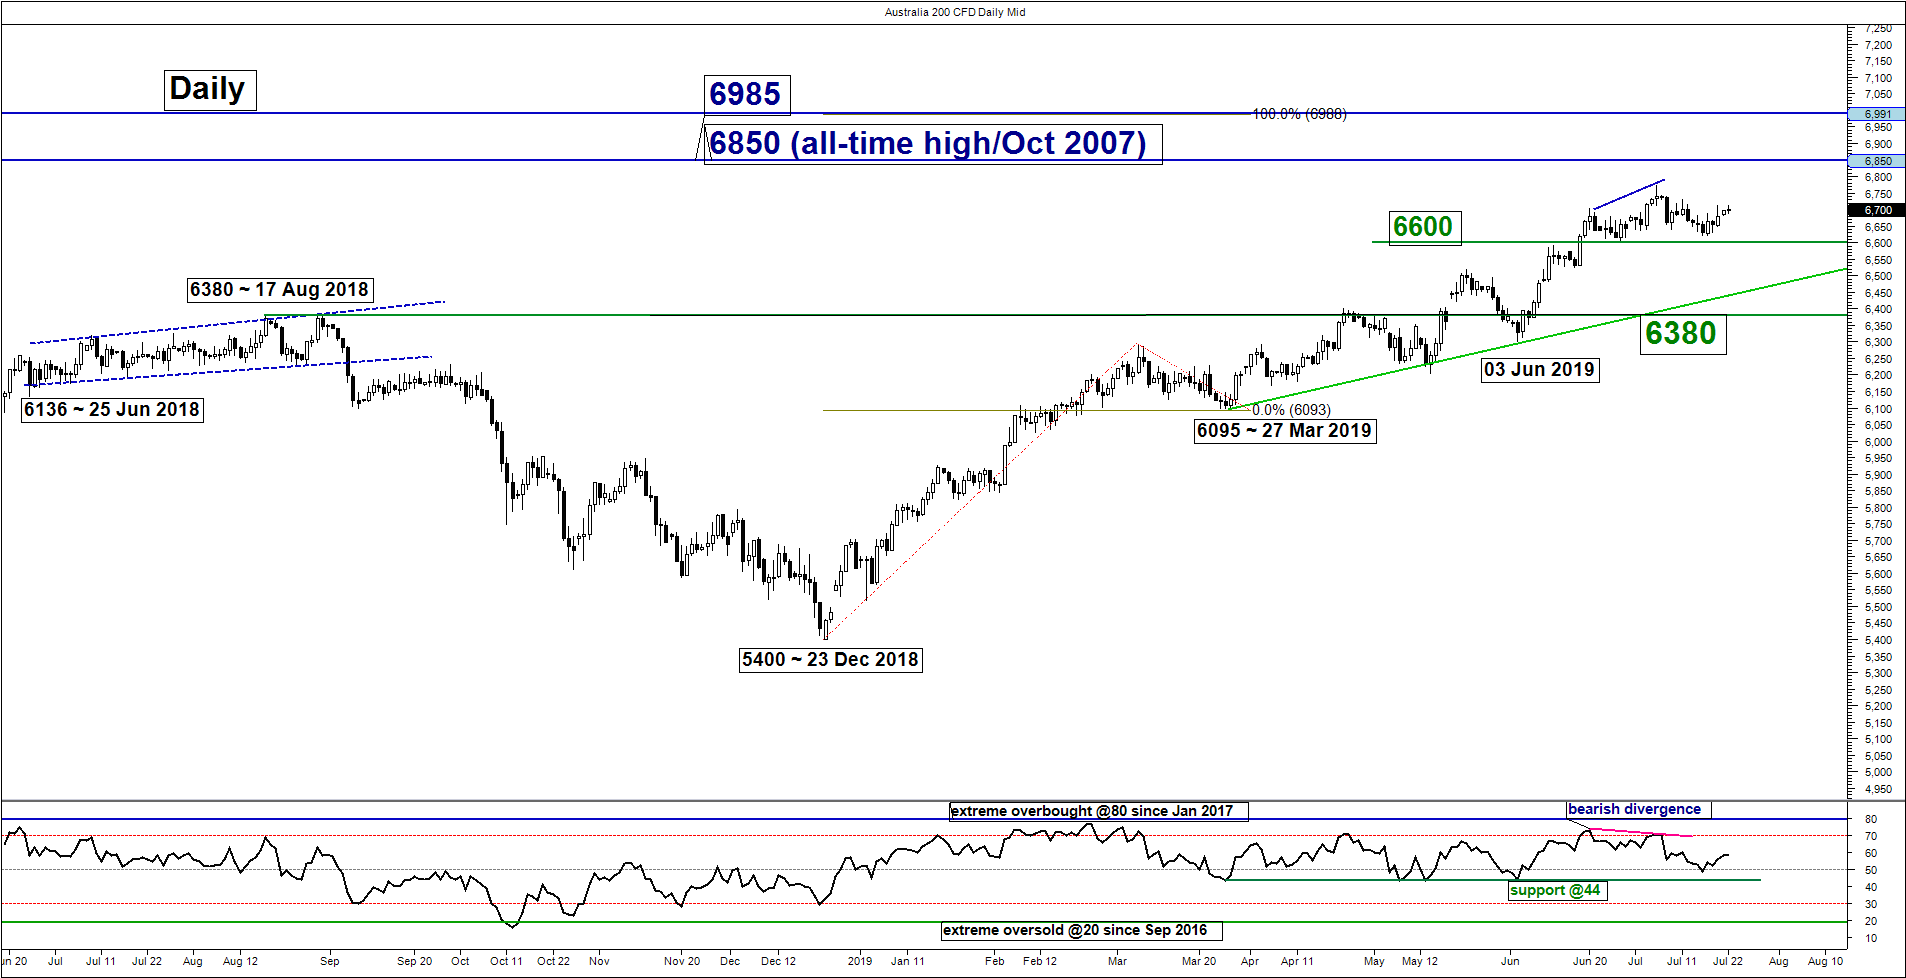
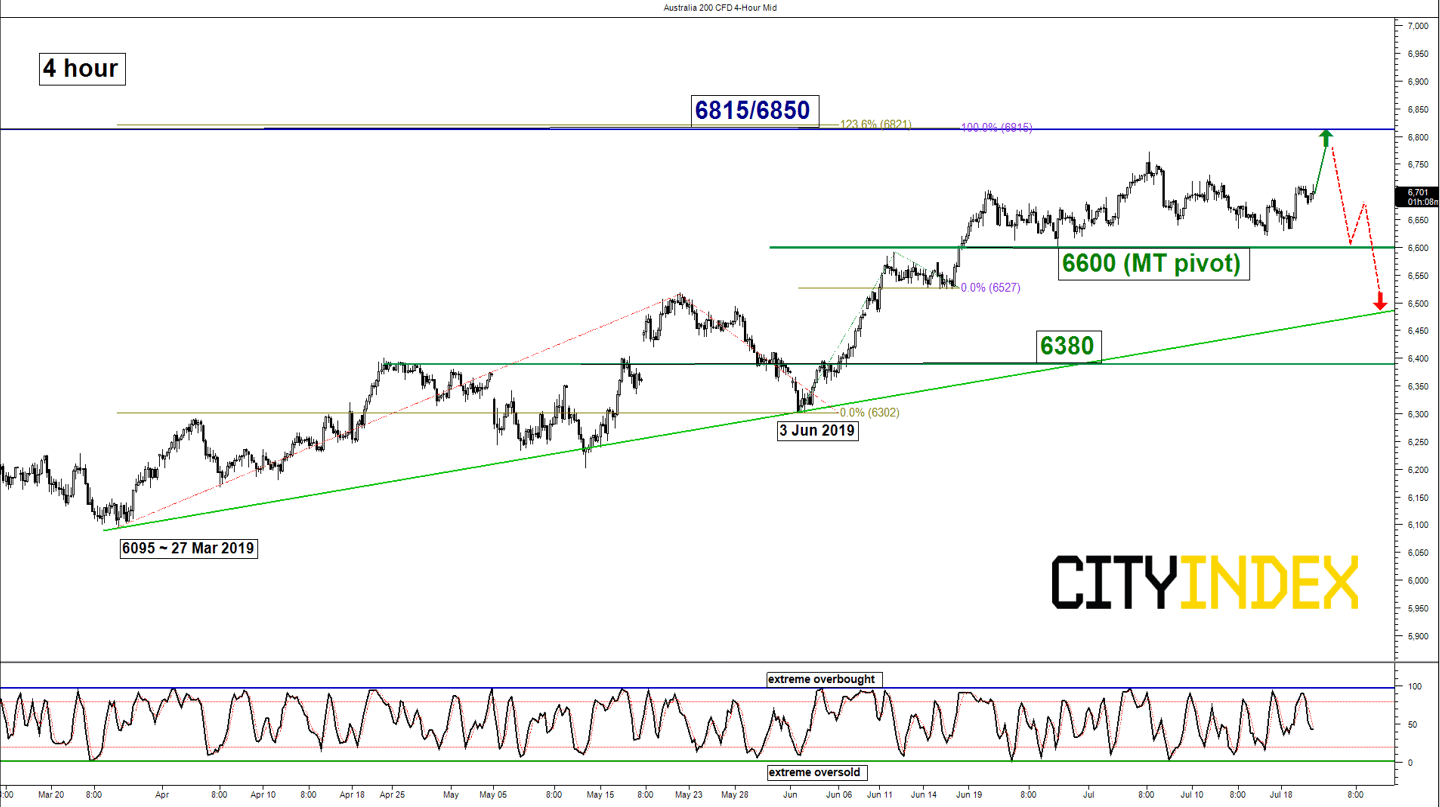
Key Levels (1 to 3 weeks)
Pivot (key support): 6600
Resistance: 6815/6850
Next support: 6380
Medium-term (1 to 3 weeks) Outlook
Last week, the Australia 200 Index (proxy for the ASX 200 futures) has traded sideways above the 6590 key medium-term pivotal support.
No change on its key elements, we maintain the bullish bias with the adjusted key medium-term pivotal support now at 6600 for a potential residual push up to target the next resistance zone at 6815/50 (all-time high & Fibonacci expansion cluster) before a multi-week corrective decline materialises.
However, a break with a daily close below 6600 invalidates the bullish scenario to kick start the multi-week corrective down move sequence towards the next support at 6380.
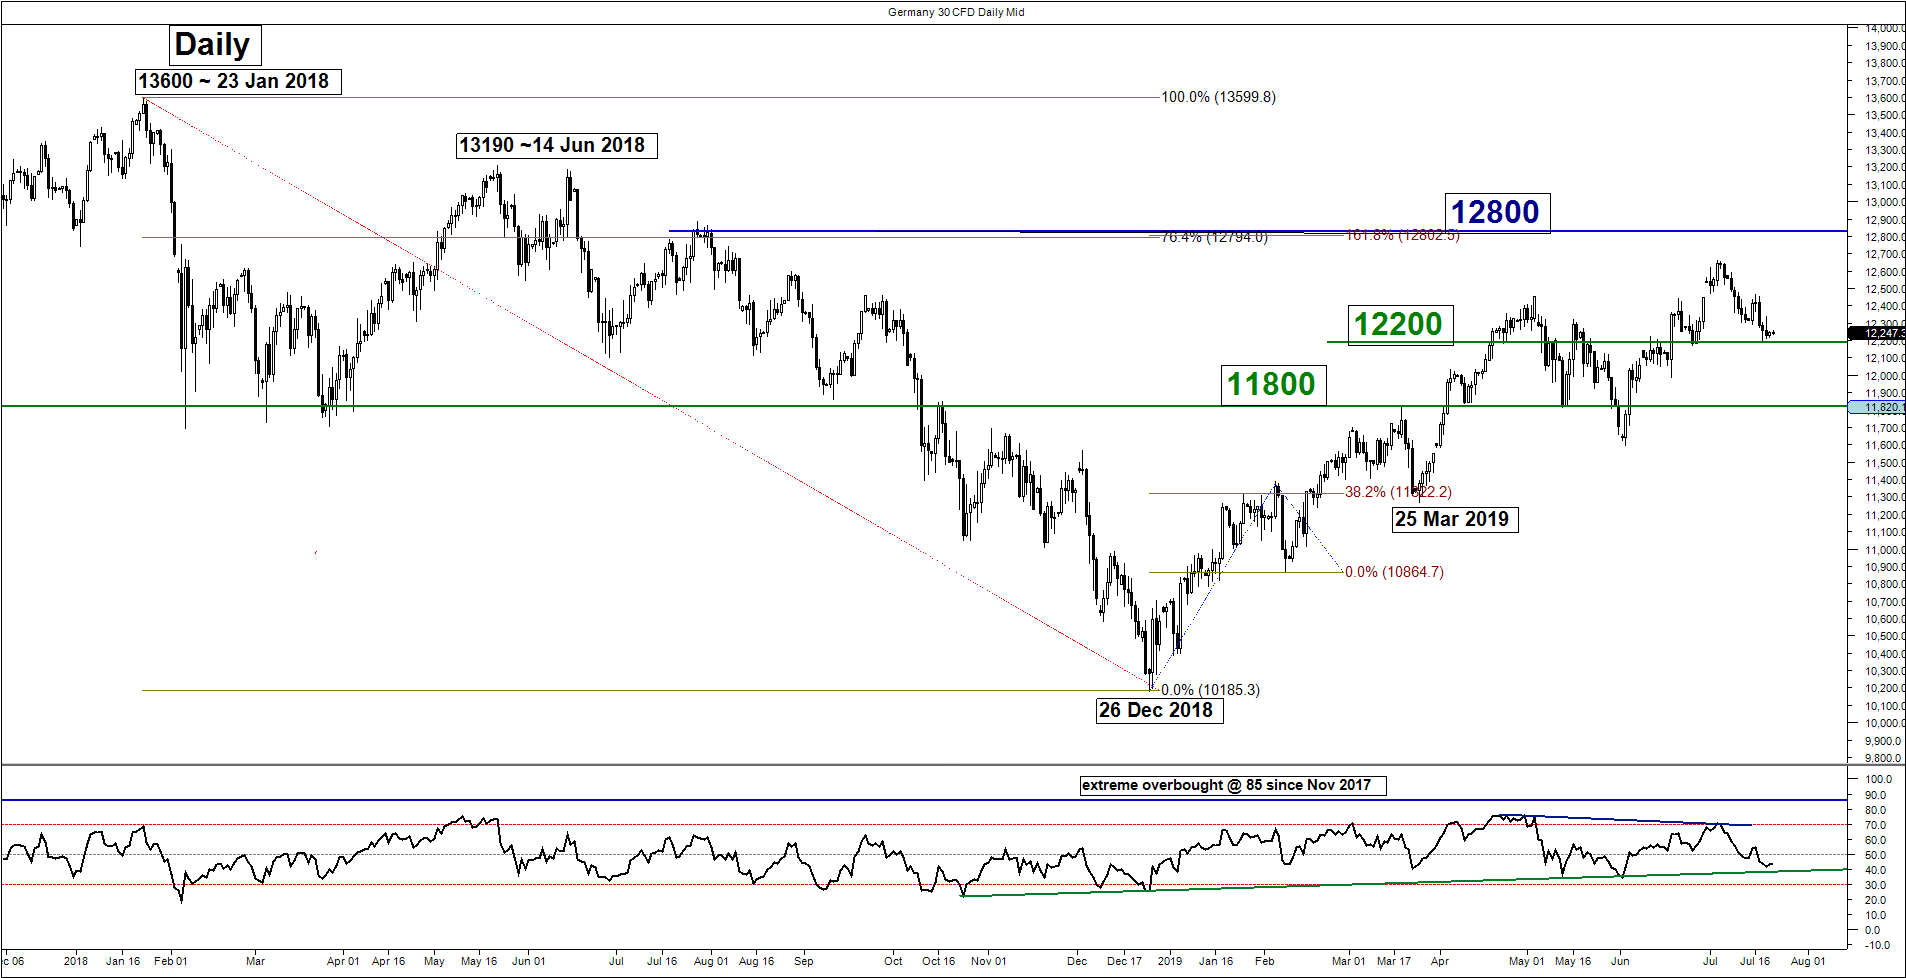
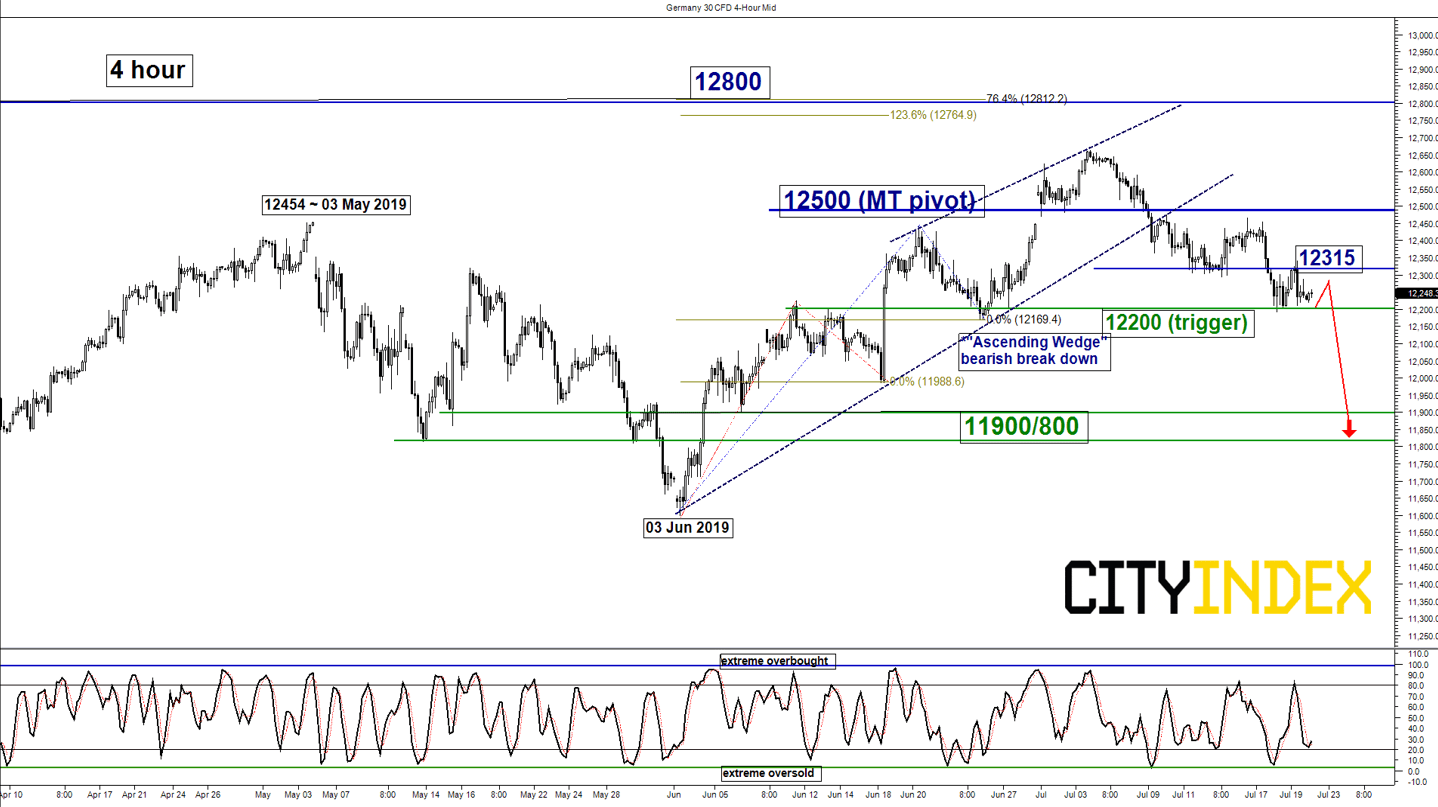
DAX – Corrective down move in progress
click to enlarge charts
Key Levels (1 to 3 weeks)
Intermediate resistance
Pivot (key resistance): 12500
Supports: 12200 (trigger) & 11900/800
Next resistance: 12800 (Fibonacci expansion/retracement cluster)
Medium-term (1 to 3 weeks) Outlook
Last week, the Germany 30 Index (proxy for the DAX futures) has inched lower as expected and right now, it is hovering just above the 12200 downside trigger level.An hourly close below 12200 is likely to reinforce a potential multi-week corrective down move sequence to target the major support zone of 11900/800 in the first step.
However, a clearance with a daily close above the 12500 medium-term pivotal resistance invalidates the bearish scenario for a revival of bulls to set sight on the next resistance at 12800.
Charts are from City Index Advantage TraderPro & eSignal
StoneX Financial Ltd (trading as “City Index”) is an execution-only service provider. This material, whether or not it states any opinions, is for general information purposes only and it does not take into account your personal circumstances or objectives. This material has been prepared using the thoughts and opinions of the author and these may change. However, City Index does not plan to provide further updates to any material once published and it is not under any obligation to keep this material up to date. This material is short term in nature and may only relate to facts and circumstances existing at a specific time or day. Nothing in this material is (or should be considered to be) financial, investment, legal, tax or other advice and no reliance should be placed on it.
No opinion given in this material constitutes a recommendation by City Index or the author that any particular investment, security, transaction or investment strategy is suitable for any specific person. The material has not been prepared in accordance with legal requirements designed to promote the independence of investment research. Although City Index is not specifically prevented from dealing before providing this material, City Index does not seek to take advantage of the material prior to its dissemination. This material is not intended for distribution to, or use by, any person in any country or jurisdiction where such distribution or use would be contrary to local law or regulation.
For further details see our full non-independent research disclaimer and quarterly summary.
CFDs are complex instruments and come with a high risk of losing money rapidly due to leverage. 69% of retail investor accounts lose money when trading CFDs with this provider. You should consider whether you understand how CFDs work and whether you can afford to take the high risk of losing your money. CFD and Forex Trading are leveraged products and your capital is at risk. They may not be suitable for everyone. Please ensure you fully understand the risks involved by reading our full risk warning.
City Index is a trading name of StoneX Financial Ltd. Head and Registered Office: 1st Floor, Moor House, 120 London Wall, London, EC2Y 5ET. StoneX Financial Ltd is a company registered in England and Wales, number: 05616586. Authorised and regulated by the Financial Conduct Authority. FCA Register Number: 446717.
City Index is a trademark of StoneX Financial Ltd.
The information on this website is not targeted at the general public of any particular country. It is not intended for distribution to residents in any country where such distribution or use would contravene any local law or regulatory requirement.
© City Index 2024