Weekly Technical Outlook on Major Stock Indices 29 Apr to 03 May 2019
S&P 500 – Potential residual push up in progress
click to enlarge charts
Key Levels (1 to 3 weeks)
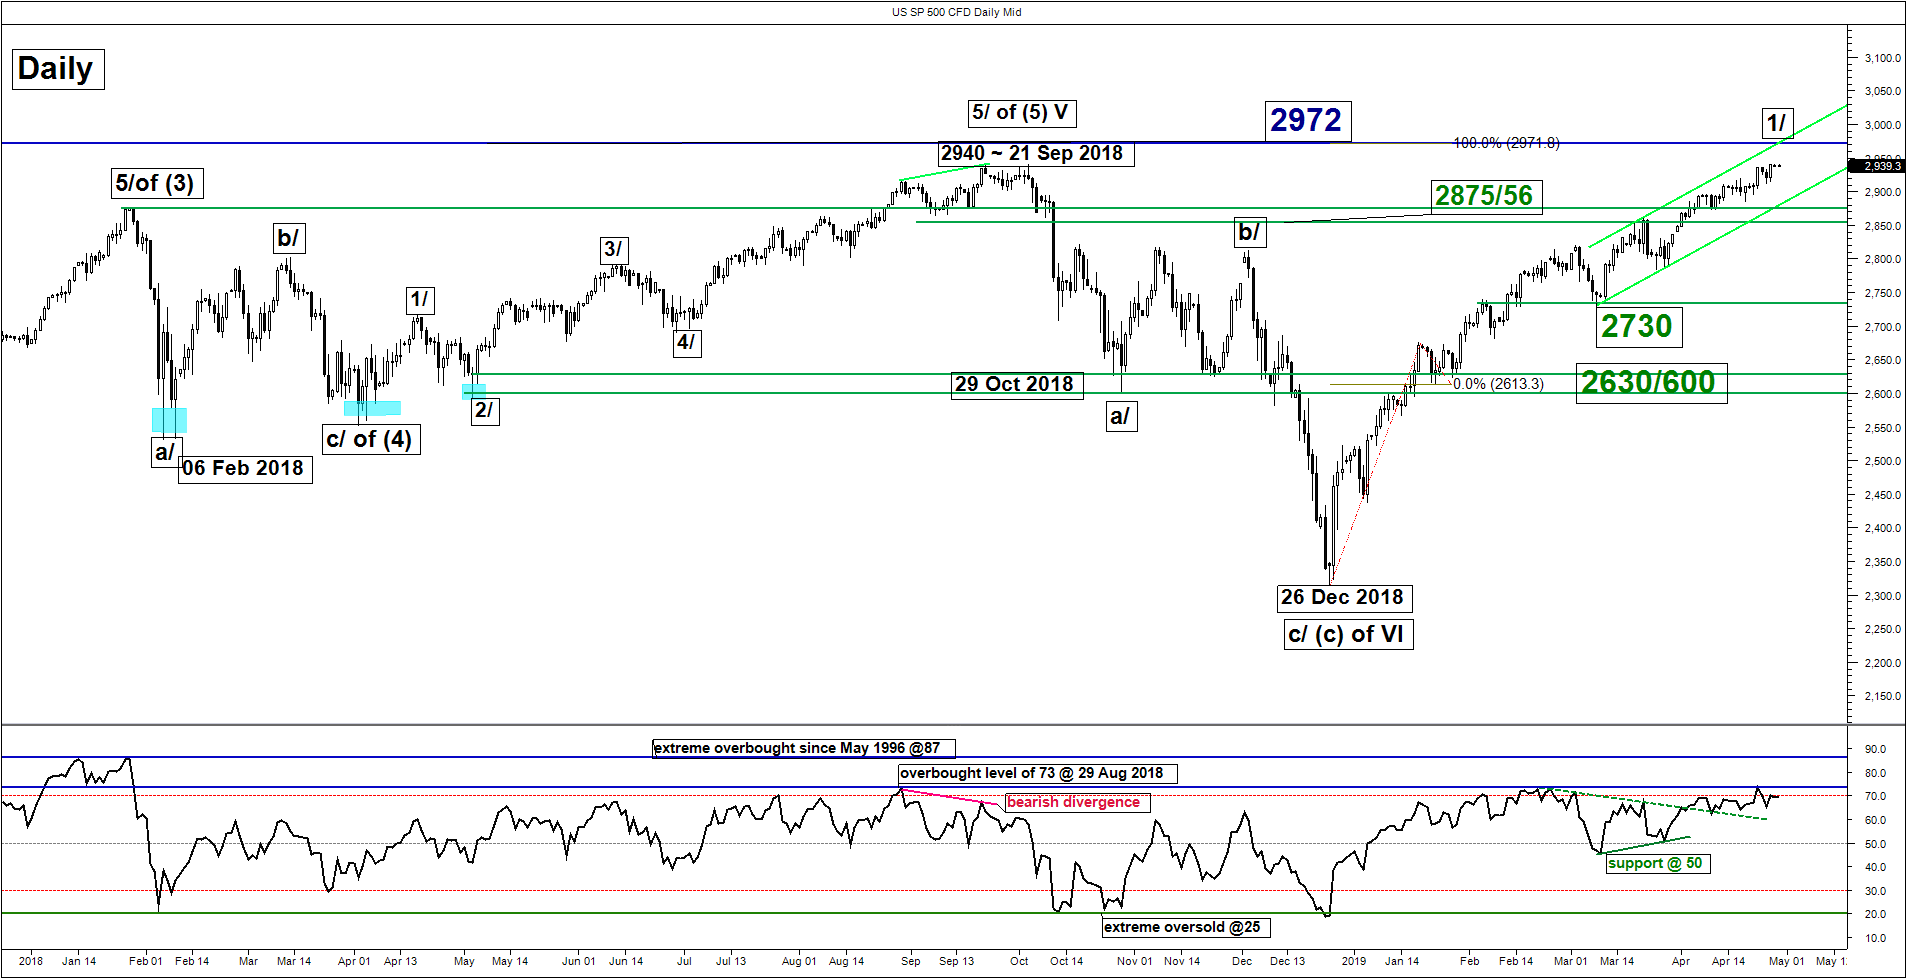
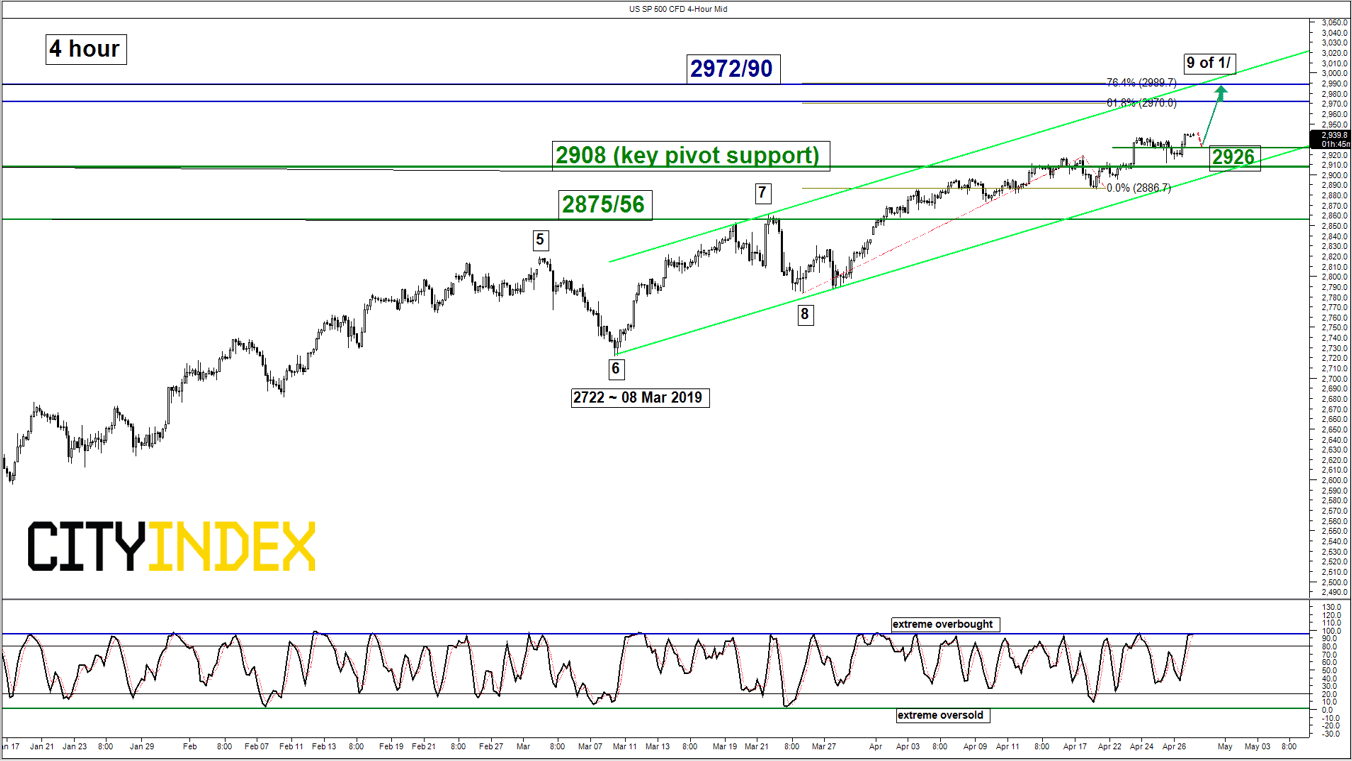
Intermediate support: 2926
Pivot (key support): 2908
Resistances: 2972 & 2990
Next supports: 2875 & 2856
Medium-term (1 to 3 weeks) Outlook
Last week, the SP 500 Index (proxy for the S&P 500 futures) has continued to push higher as expected and almost met the current all-time high level of 2940 printed on 21 Sep 2018. Click here for a recap on our previous weekly outlook report.
Technical elements are still advocating for further potential upside as follow;
- Despite its daily RSI oscillator has reached an overbought level of 74 which is a similar level seen on 29 Aug 2018 before the major swing high of 2940 (the current all-time high), there are no clear signs of a bearish divergence signal yet which suggests that medium-term upside momentum of price action remains intact.
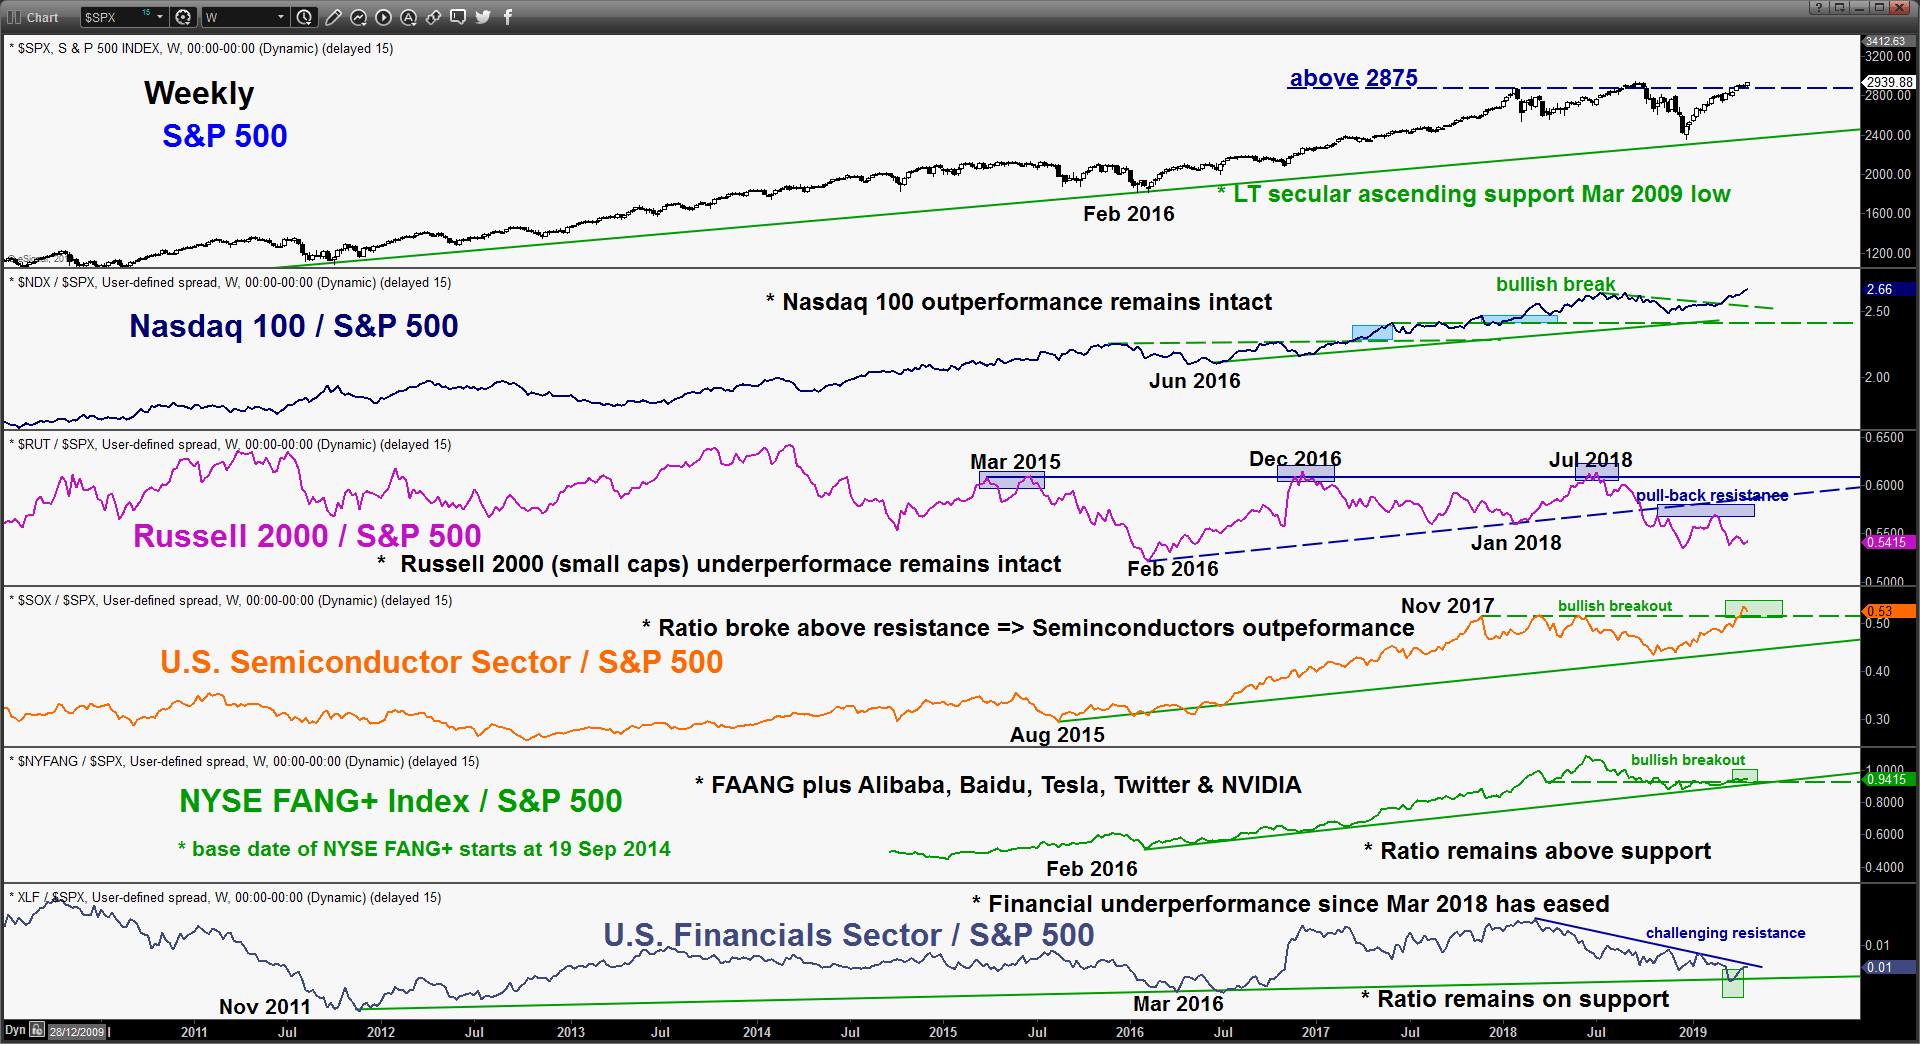
- Relative strength analysis among the highlighted the 5 U.S. “high beta/risk on” sectors/indices are still advocating further outperformance in the Nasdaq 100, Semiconductor sector and NYSE FANG+ Index against the S&P 500. In addition, the underperformance seen in the Financial sector since Mar 2018 has started to ease.
- Price action of the Index has continued to evolve with a medium-term ascending channel since 08 Mar 2019 low of 2722 with the upper boundary now acting as resistance at 2990.
- Elliot Wave/fractal analysis is advocating a potential residual up move to complete the wave 9 of an extended impulsive bullish wave 1/ of an intermediate degree in place since 26 Dec 2018 low before a potential multi-week corrective decline materialises. Potential end target of the wave 1/ stands at the 2972/90 zone as defined by Fibonacci expansion cluster levels.
Therefore, we maintain the bullish bias in any dips with a tightened key medium-term pivotal support at 2908 (also the lower boundary of the medium-term ascending channel support from 08 Mar 2018 low) for a further potential push up to target 2972 and above it opens up scope for a further rally towards 2990 next.
On the other hand, a daily close below 2908 invalidates the bullish scenario to kickstart a multi-week corrective decline towards the next support at 2875/56 in the first step.
Nikkei 225 – Uptrend remains intact
click to enlarge charts
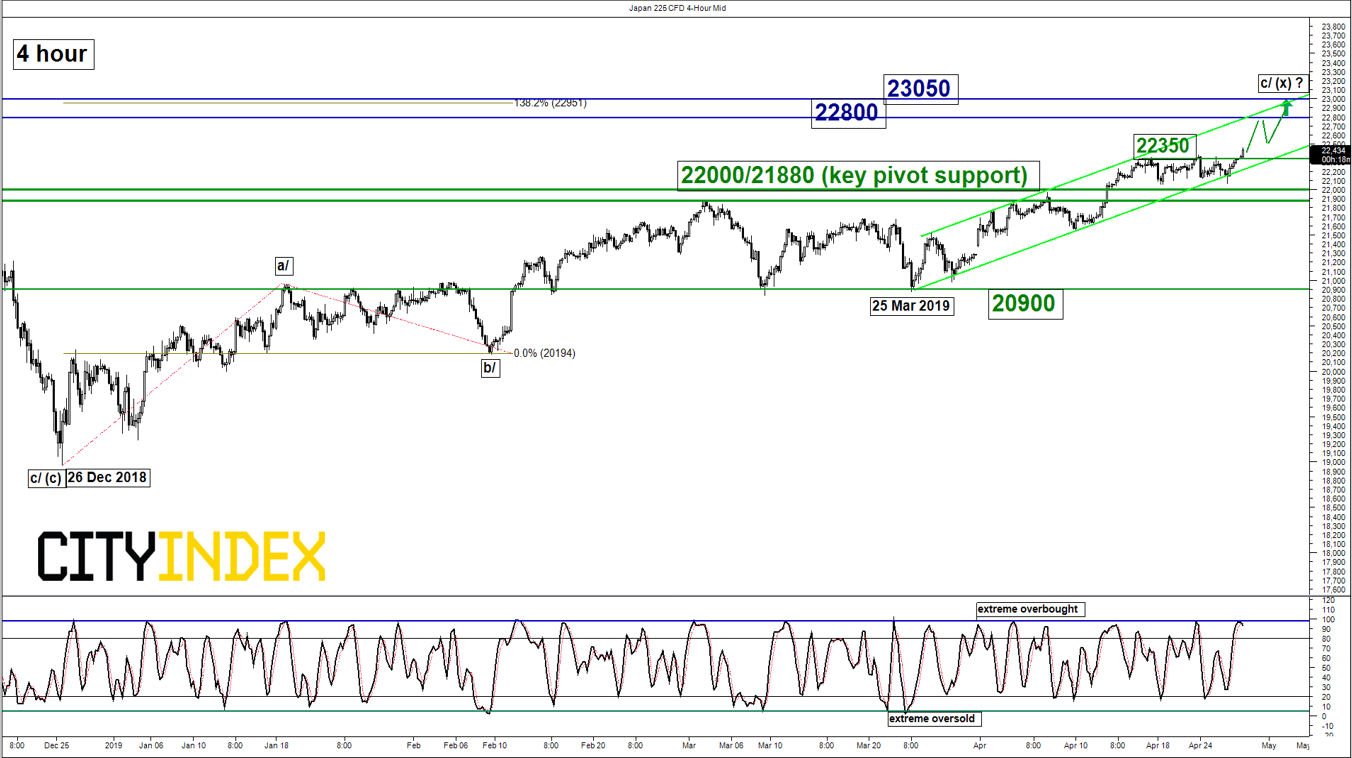
Key Levels (1 to 3 weeks)
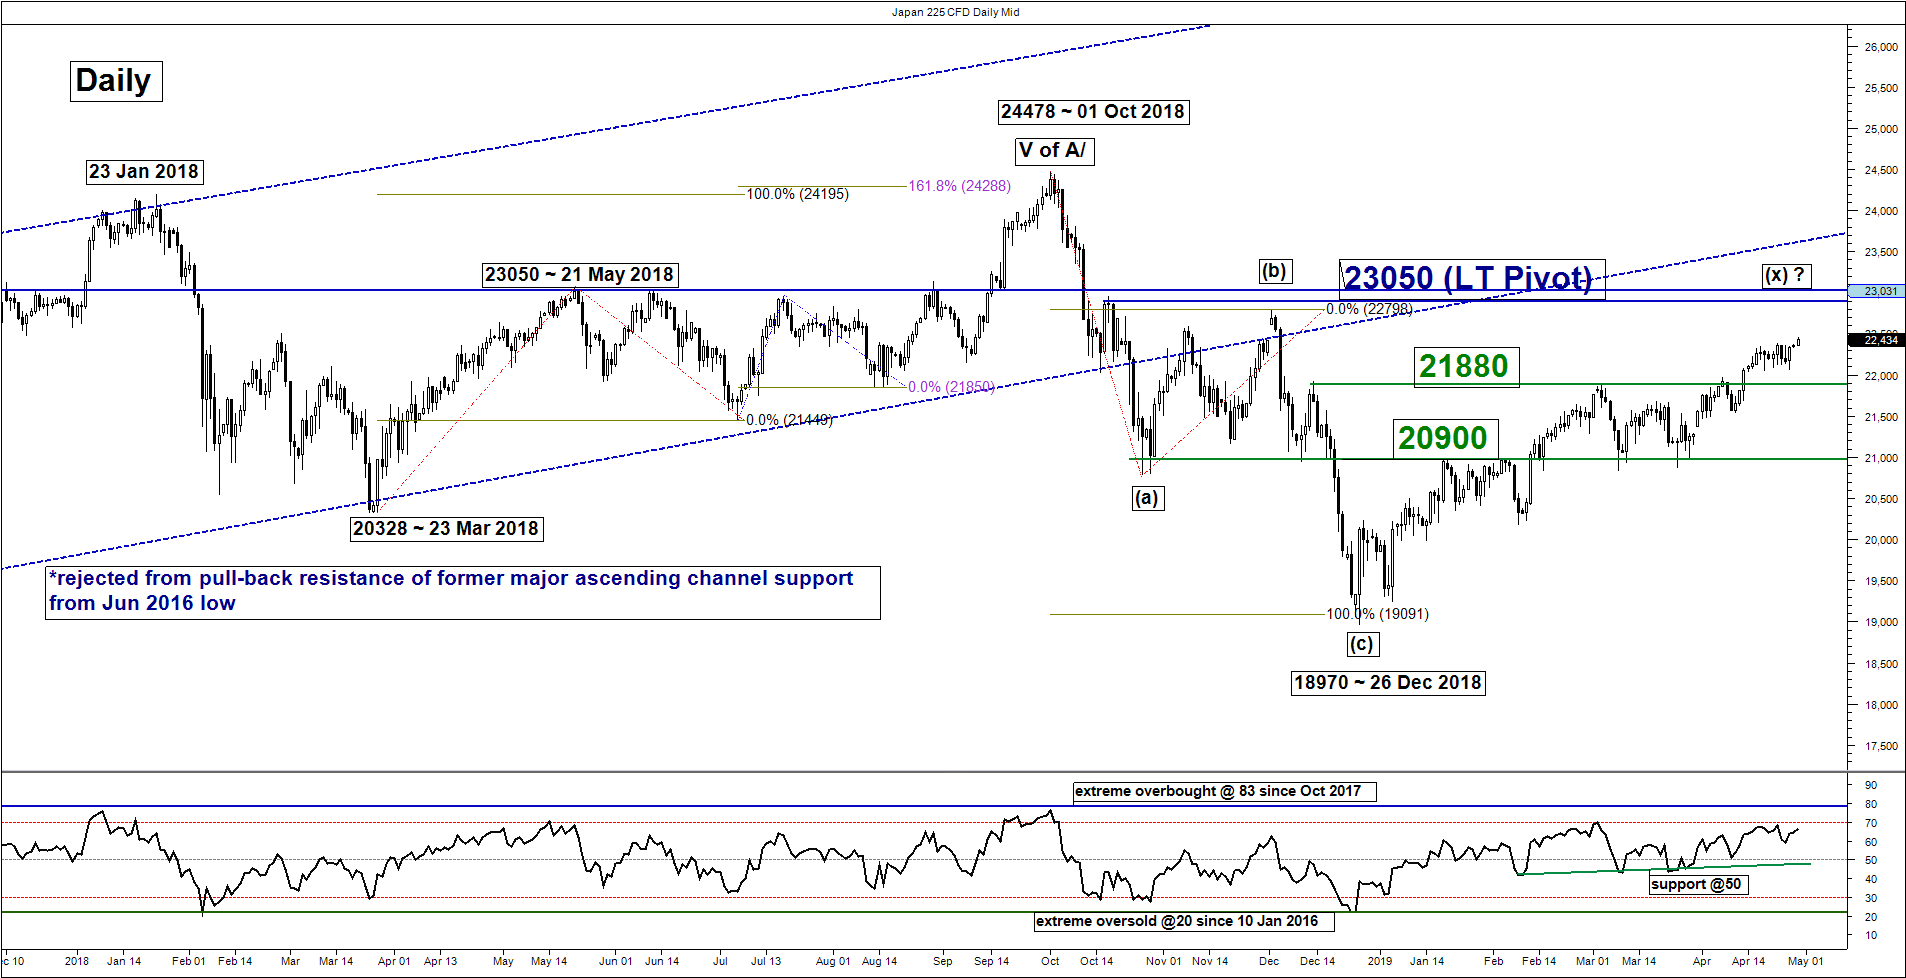
Intermediate support: 22350
Pivot (key support): 22000/21880
Resistances: 22800 & 23050 (LT pivot)
Next support: 20900
Medium-term (1 to 3 weeks) Outlook
The Japan cash stock market will be closed for an extended Golden Week holidays from 29 Apr to 06 May 2019 while the Nikkei 225 futures remains open for trading over in CME Globex.
The Japan 225 Index (proxy for the Nikkei 225 futures) has continued to inch higher as expected and broke above its 22350 minor range resistance in place since 17 Apr 2019 in today, 29 Apr Asian session. No change, maintain bullish bias above the adjusted key medium-term pivotal support at 22000/21880 for a further potential push up to target 22880 before the long-term pivotal resistance at 23050 (close to 76.4% Fibonacci retracement of the previous 3-mont down move from 01 Oct 2018 high to 26 Dec 2018 low & pull-back resistance of the former major ascending channel support from Jun 2016 low).
On the other hand, a daily close below 21880 negates the bullish tone for a slide back to retest 20900 support (08/25 Mar 2019 swing low areas).
Hang Seng – 29500 remains the key support to watch
click to enlarge charts
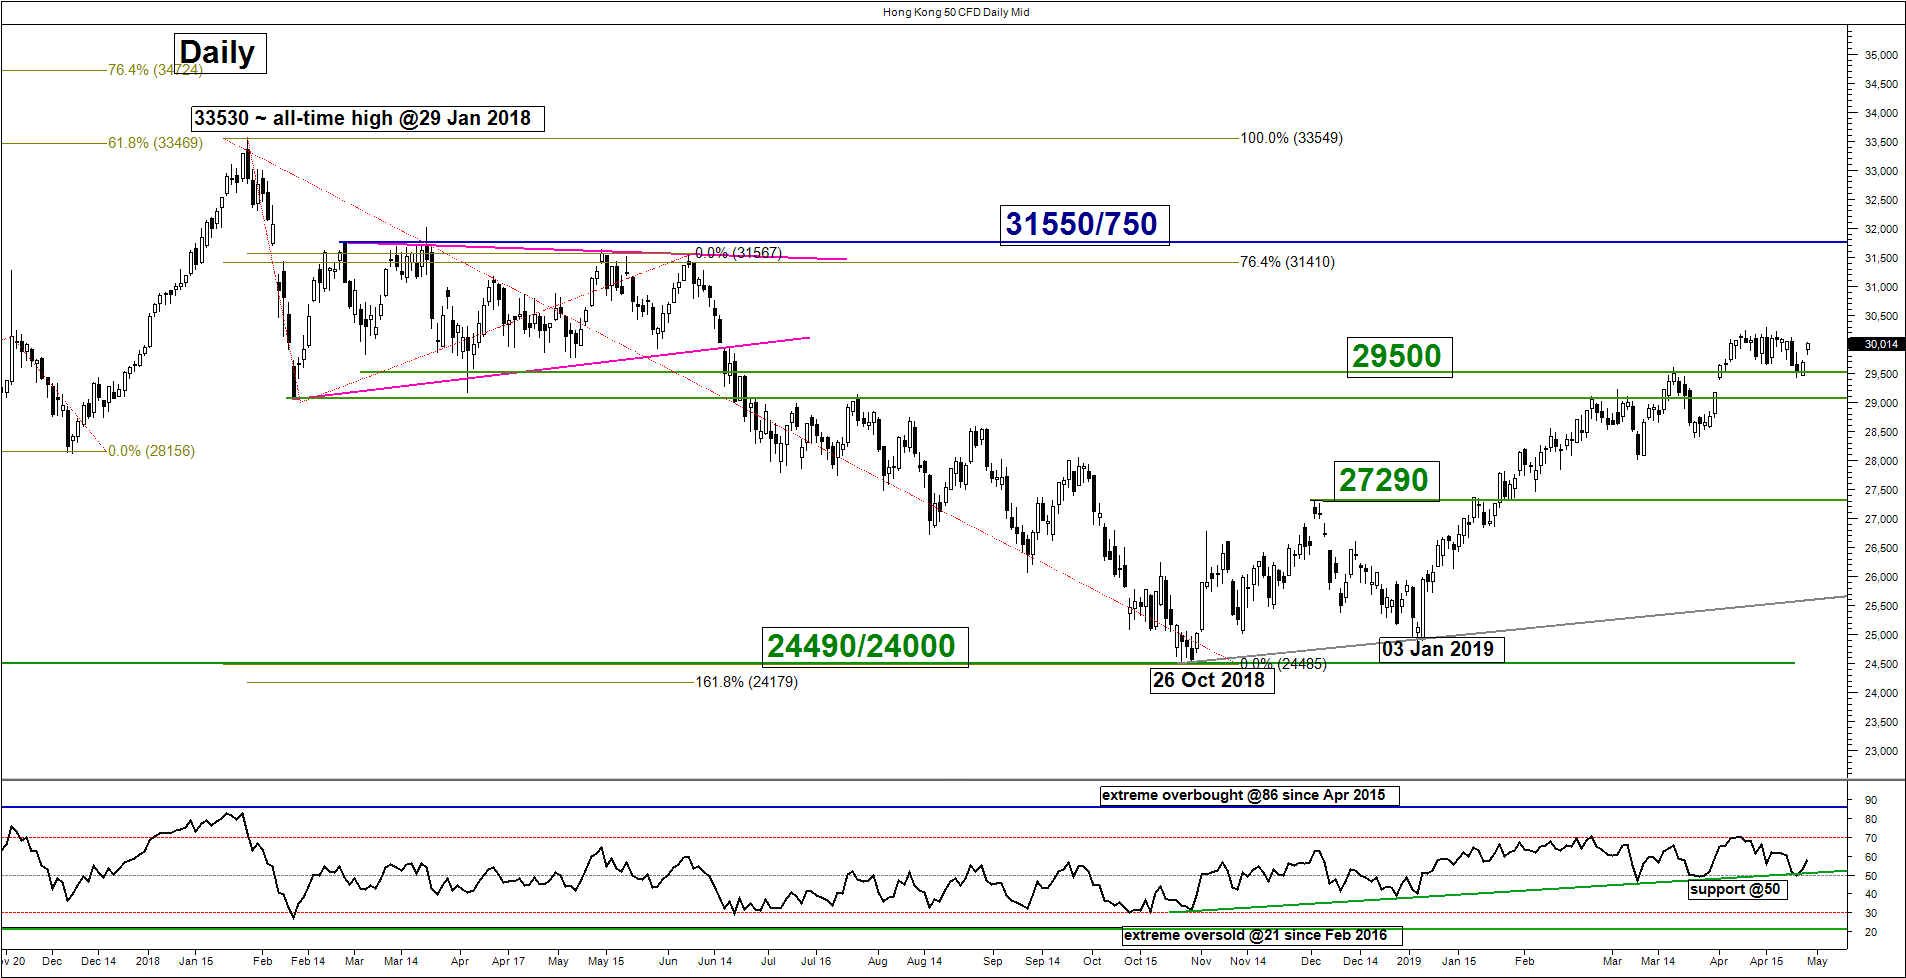
Key Levels (1 to 3 weeks)
Intermediate support: 29830
Pivot (key support): 29500
Resistances: 30500/650 & 31300/550
Next support: 27290
Medium-term (1 to 3 weeks) Outlook
Last week, the Hong Kong 50 Index (proxy for Hang Seng Index futures) has inched lower and tested the 29500 key medium-term pivotal support before it staged a minor bounce on last Fri, 26 Apr. In today, 29 Apr Asia session, it staged an opening gapped up and broke above a minor descending resistance from 15 Apr 2019 high now turns pull-back support at 29830.
Maintain bullish bias with 29500 remains as the key medium-term pivotal support for a further potential push up target the next resistances at 30500/650 and 31300/550.
On the other hand, a daily close below 29500 negates the bullish tone for a deeper pull-back towards the next support at 27290 (former swing high of 03 Dec 2018 & close to 50% Fibonacci retracement of the on-going up move from 03 Jan 2019 low to 09 Apr 2019 high).
ASX 200 – Further potential upside through bullish break above 6290
click to enlarge charts
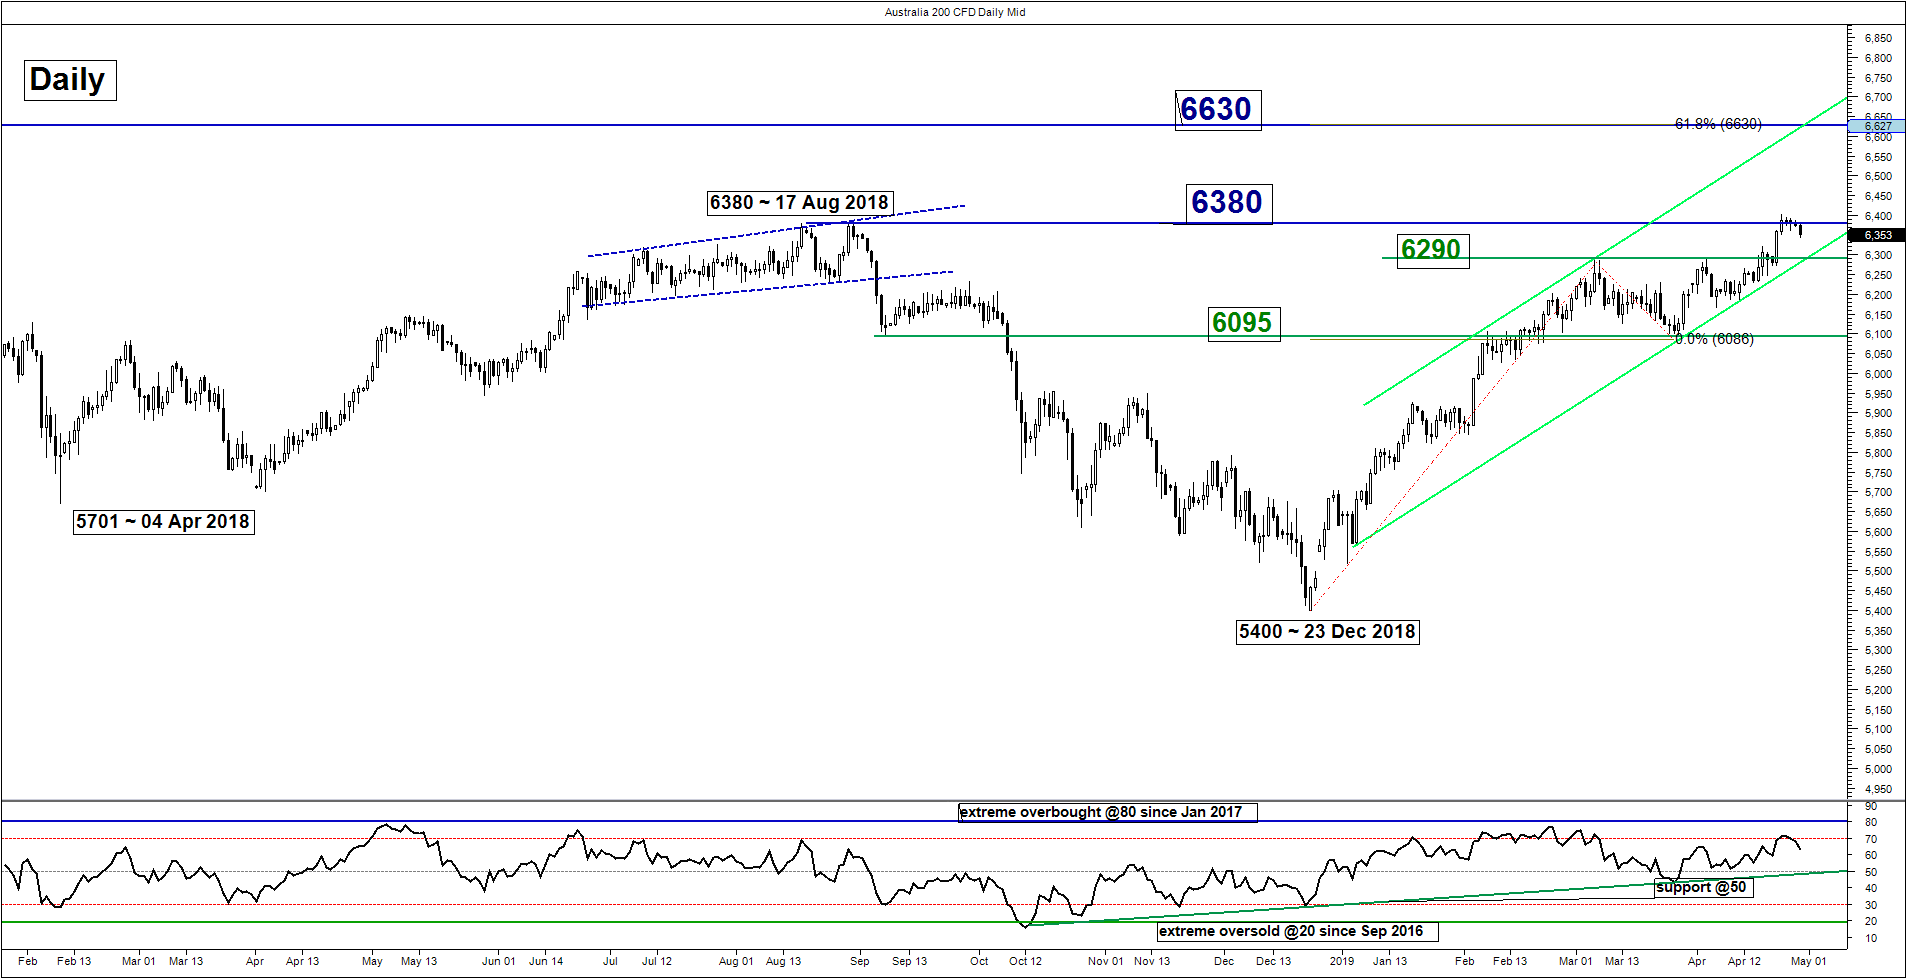
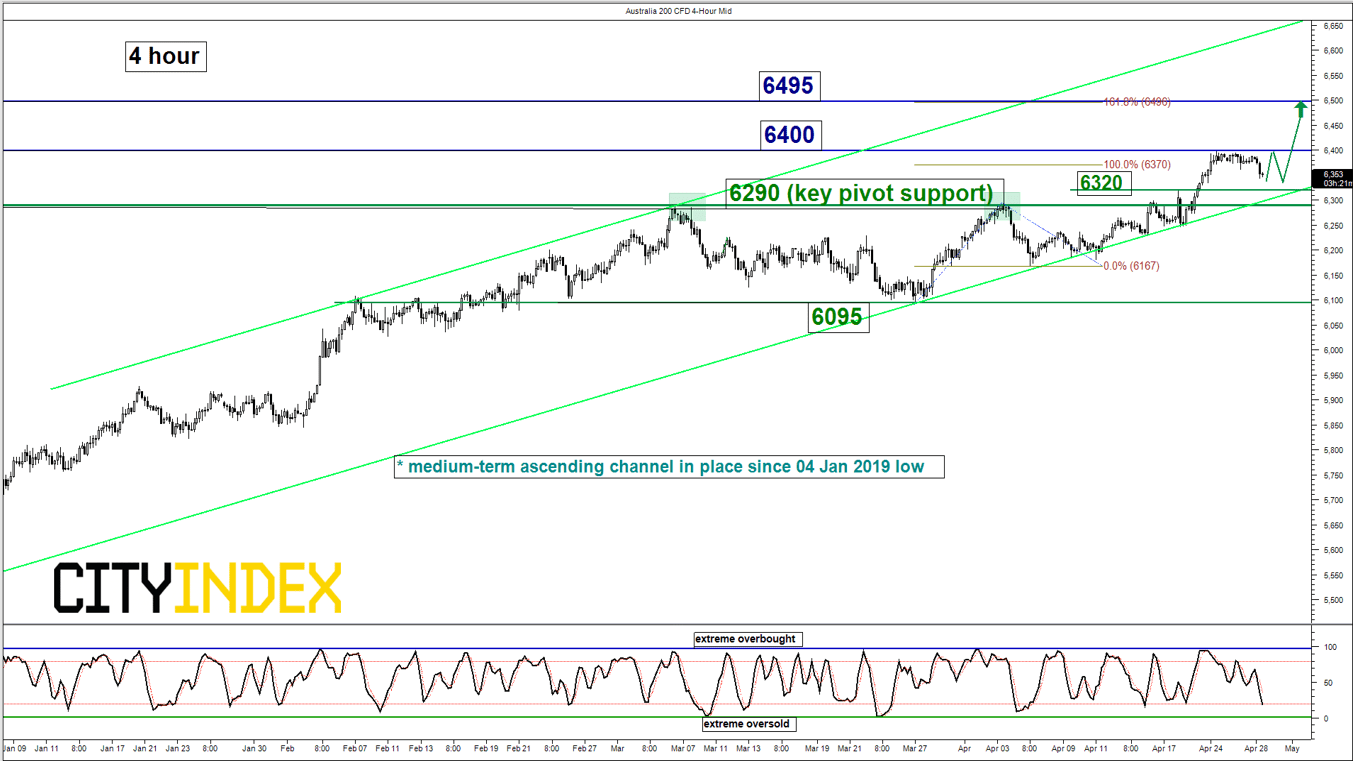
Key Levels (1 to 3 weeks)
Intermediate support: 6320
Pivot (key support): 6290
Resistances: 6400 & 6495
Next support: 6095
Medium-term (1 to 3 weeks) Outlook
The Australia 200 Index (proxy for the ASX 200 futures) has staged a bullish breakout above the 6290 upper limit of the neutrality zone as per highlighted in our previous report. Last week, it traded higher to test its 52-week high at 6380, also the major swing high area of 6380 seen on 17 Aug 2018 before it staged a pull-back of 0.8% to print a current intraday low of 6344 in today, 29 Apr Asian session.
Flip to a bullish bias above 6290 key medium-term pivotal support for a further potential push uo to retest 6380/400 before targeting the next resistance at 6495.
On the other hand, a daily close below 6290 invalidates the bullish scenario to kickstart a corrective decline towards the next support at 6095 in the first step.
DAX – Mix elements, bulls now need to break above 12520
click to enlarge charts
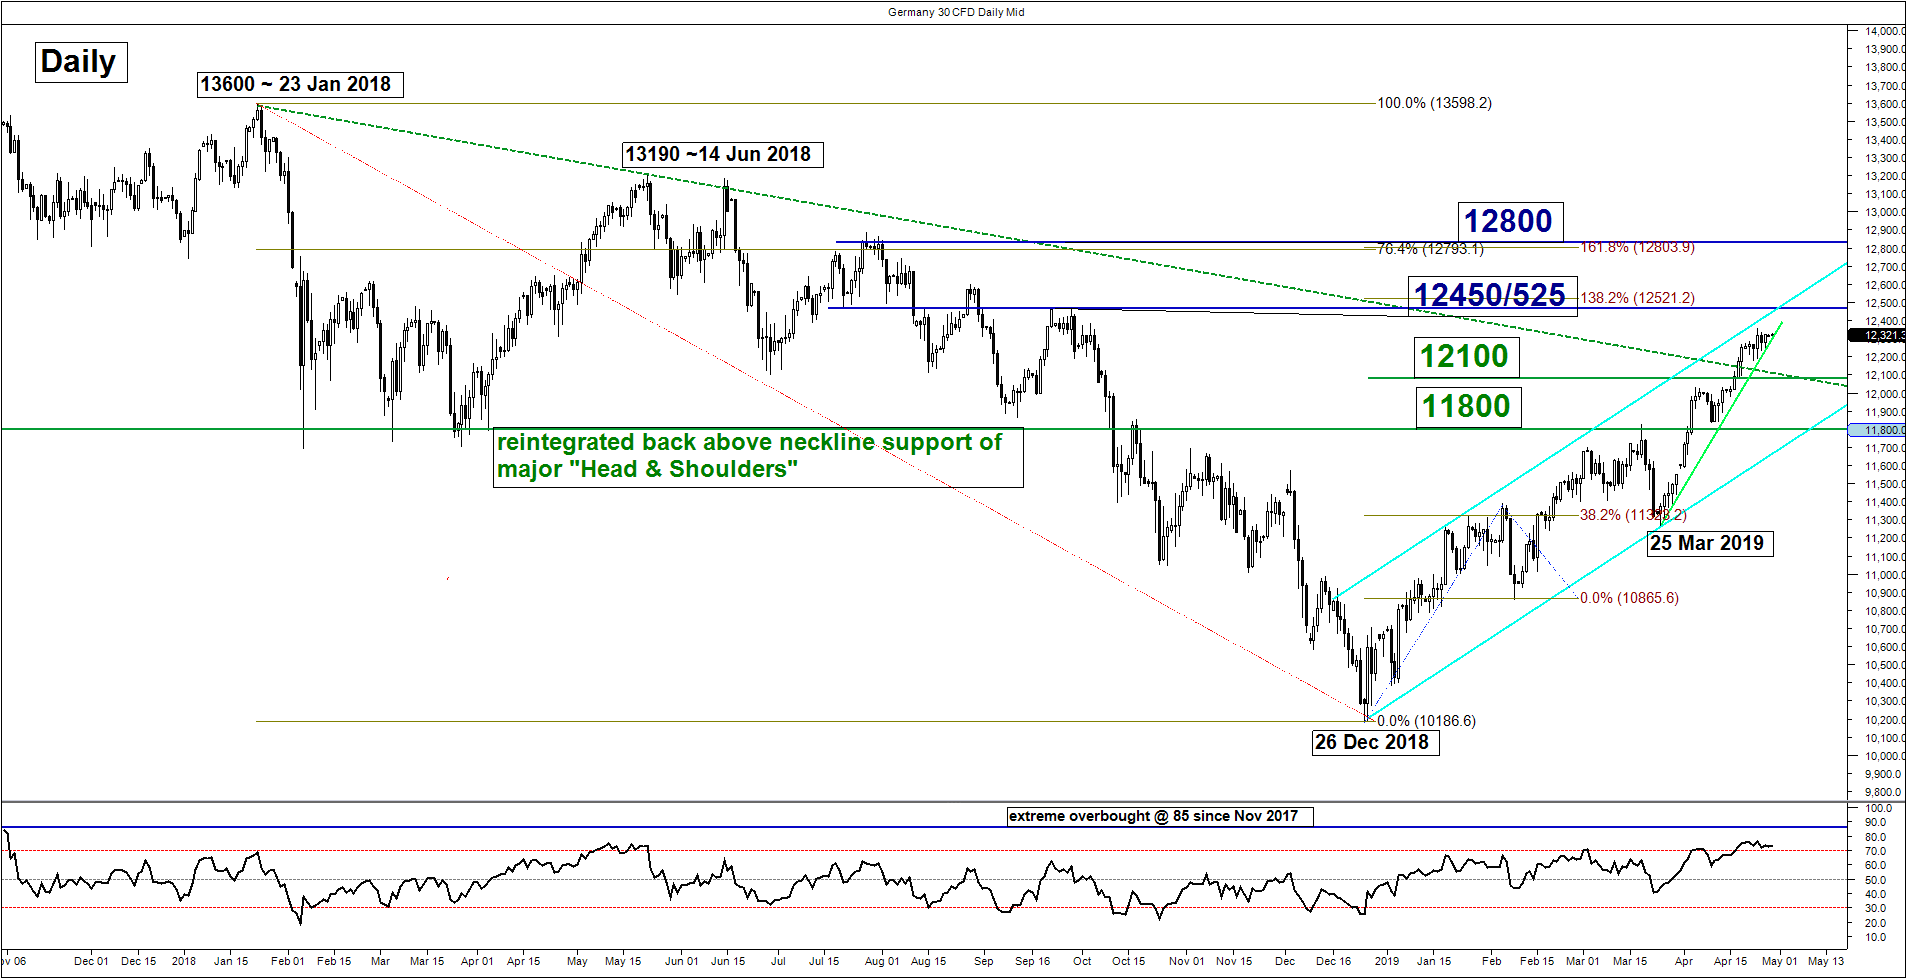
Key Levels (1 to 3 weeks)
Resistances: 12525 & 12800
Supports: 12100 & 11800
Medium-term (1 to 3 weeks) Outlook
The Germany 30 Index (proxy for the DAX futures) has shaped the expected bullish breakout above 12100 (the major descending resistance from its current all-time high printed on 23 Jan 2018) as per highlighted in our previous report. It has now approaching the 12450 medium-term resistance/target which is also just below the upper boundary of the medium-term ascending channel from 26 Dec 2018 low now acting as a resistance at 12525 and the swing high areas of 21/28 Sep 2018.
Mix elements now, prefer to turn neutral between 12525 and 12100. A clearance above 12525 opens up scope for a further potential rally to target the next resistance at 12800.
On the flipside, a daily close below 12100 sees a deeper pull-back to retest 11800.
Charts are from City Index Advantage TraderPro & eSignal
StoneX Financial Ltd (trading as “City Index”) is an execution-only service provider. This material, whether or not it states any opinions, is for general information purposes only and it does not take into account your personal circumstances or objectives. This material has been prepared using the thoughts and opinions of the author and these may change. However, City Index does not plan to provide further updates to any material once published and it is not under any obligation to keep this material up to date. This material is short term in nature and may only relate to facts and circumstances existing at a specific time or day. Nothing in this material is (or should be considered to be) financial, investment, legal, tax or other advice and no reliance should be placed on it.
No opinion given in this material constitutes a recommendation by City Index or the author that any particular investment, security, transaction or investment strategy is suitable for any specific person. The material has not been prepared in accordance with legal requirements designed to promote the independence of investment research. Although City Index is not specifically prevented from dealing before providing this material, City Index does not seek to take advantage of the material prior to its dissemination. This material is not intended for distribution to, or use by, any person in any country or jurisdiction where such distribution or use would be contrary to local law or regulation.
For further details see our full non-independent research disclaimer and quarterly summary.
CFDs are complex instruments and come with a high risk of losing money rapidly due to leverage. 69% of retail investor accounts lose money when trading CFDs with this provider. You should consider whether you understand how CFDs work and whether you can afford to take the high risk of losing your money. CFD and Forex Trading are leveraged products and your capital is at risk. They may not be suitable for everyone. Please ensure you fully understand the risks involved by reading our full risk warning.
City Index is a trading name of StoneX Financial Ltd. Head and Registered Office: 1st Floor, Moor House, 120 London Wall, London, EC2Y 5ET. StoneX Financial Ltd is a company registered in England and Wales, number: 05616586. Authorised and regulated by the Financial Conduct Authority. FCA Register Number: 446717.
City Index is a trademark of StoneX Financial Ltd.
The information on this website is not targeted at the general public of any particular country. It is not intended for distribution to residents in any country where such distribution or use would contravene any local law or regulatory requirement.
© City Index 2024