Weekly Technical Outlook on Major Stock Indices 27 May to 31 May 2019
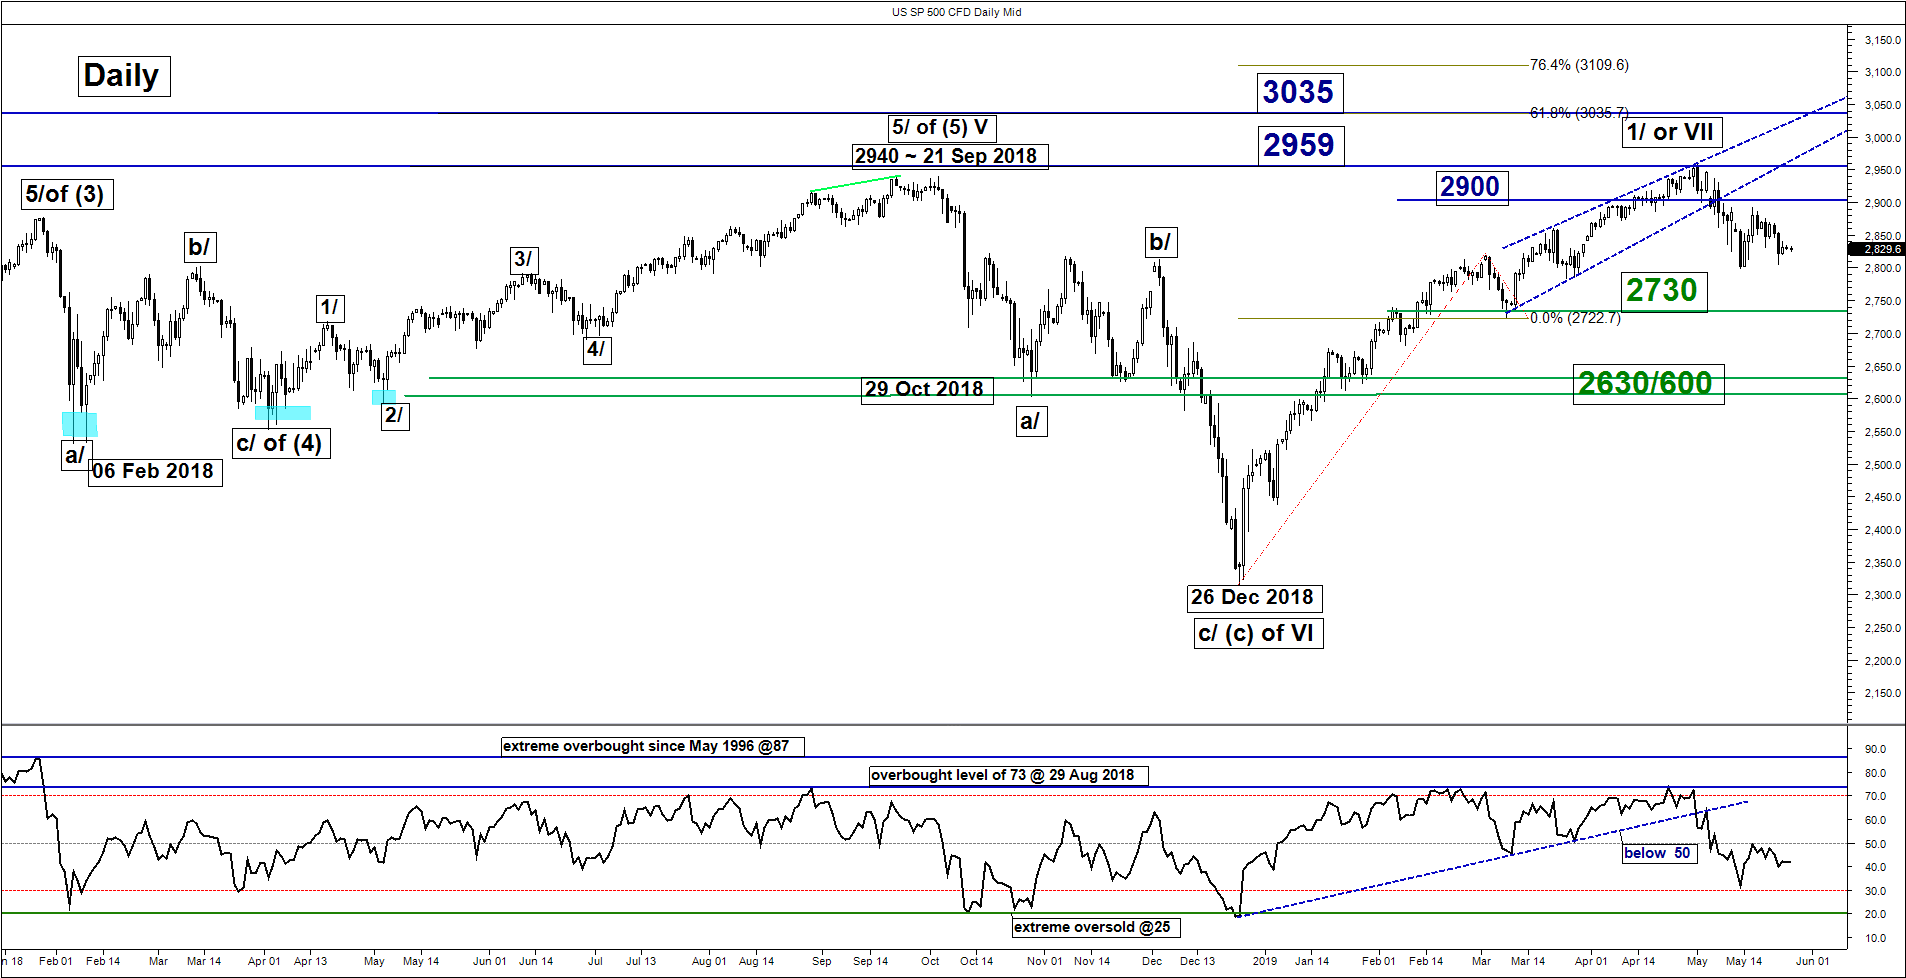
S&P 500 – Further potential corrective down move
click to enlarge charts
Key Levels (1 to 3 weeks)
Intermediate resistance: 2857
Pivot (key resistance): 2900
Supports: 2790 & 2730
Next resistance: 2959 & 3007
Medium-term (1 to 3 weeks) Outlook
In our previous weekly technical outlook report, we had highlighted the risk of an impending medium-term/multi-week corrective down move sequence for the SP 500 Index (proxy for the S&P 500 futures) below the 2920 key medium-term pivotal resistance (click here & here to recap).
Indeed, the Index had shaped the first leg of the corrective down move sequence and almost reached the first target/support of 2790 (printed a low of 2798 on 13 May 2019) before it shaped the expected consolidation phase below 2900 as per highlighted in our previous report.
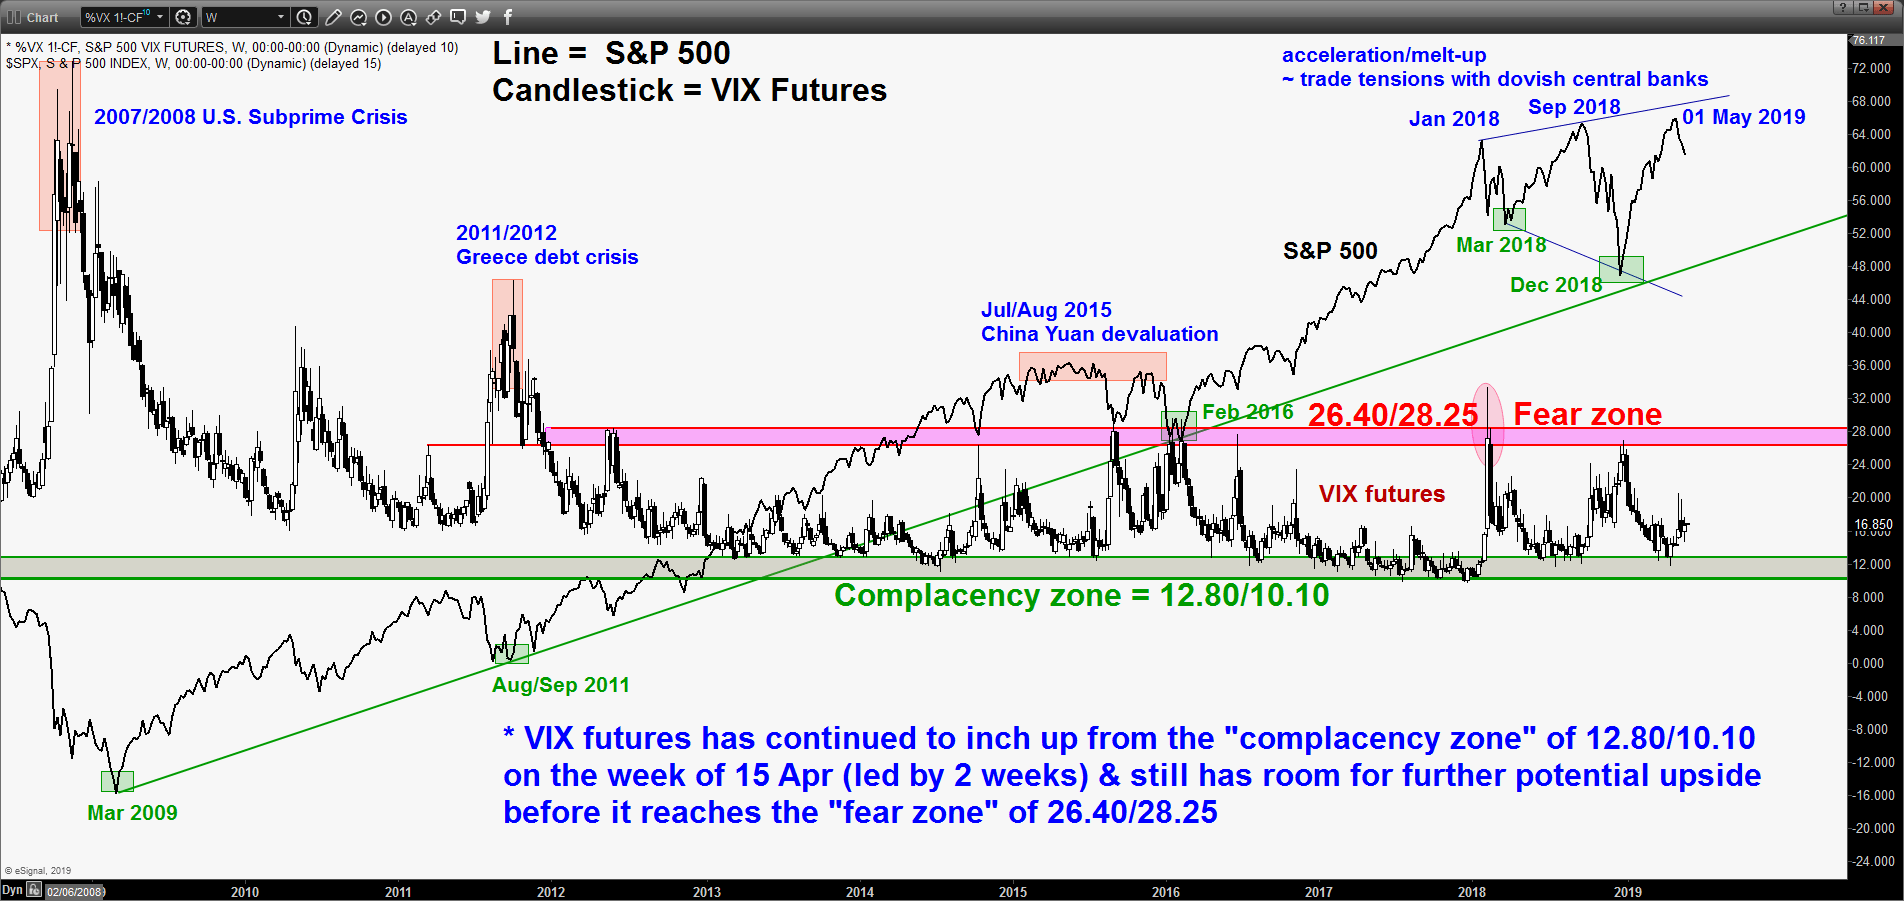
Current technical elements are still negative where the daily RSI oscillator remains below the 50 level and the VIX futures has continued to inch higher above the “complacency zone of 12.80/10.10. Maintain bearish bias with a tightened key medium-term pivotal resistance now at 2900 (close to 16 May swing high & the 61.8% retracement of the previous decline from 01 May high to 13 May 2019 low) for another potential downleg to target 2790 and 2730 next.
However, a clearance with a daily close above 2900 invalidates the bearish scenario for a continuation of the 5-month uptrend to retest its current all-time high at 2959 and even 3007 next (Fibonacci expansion).
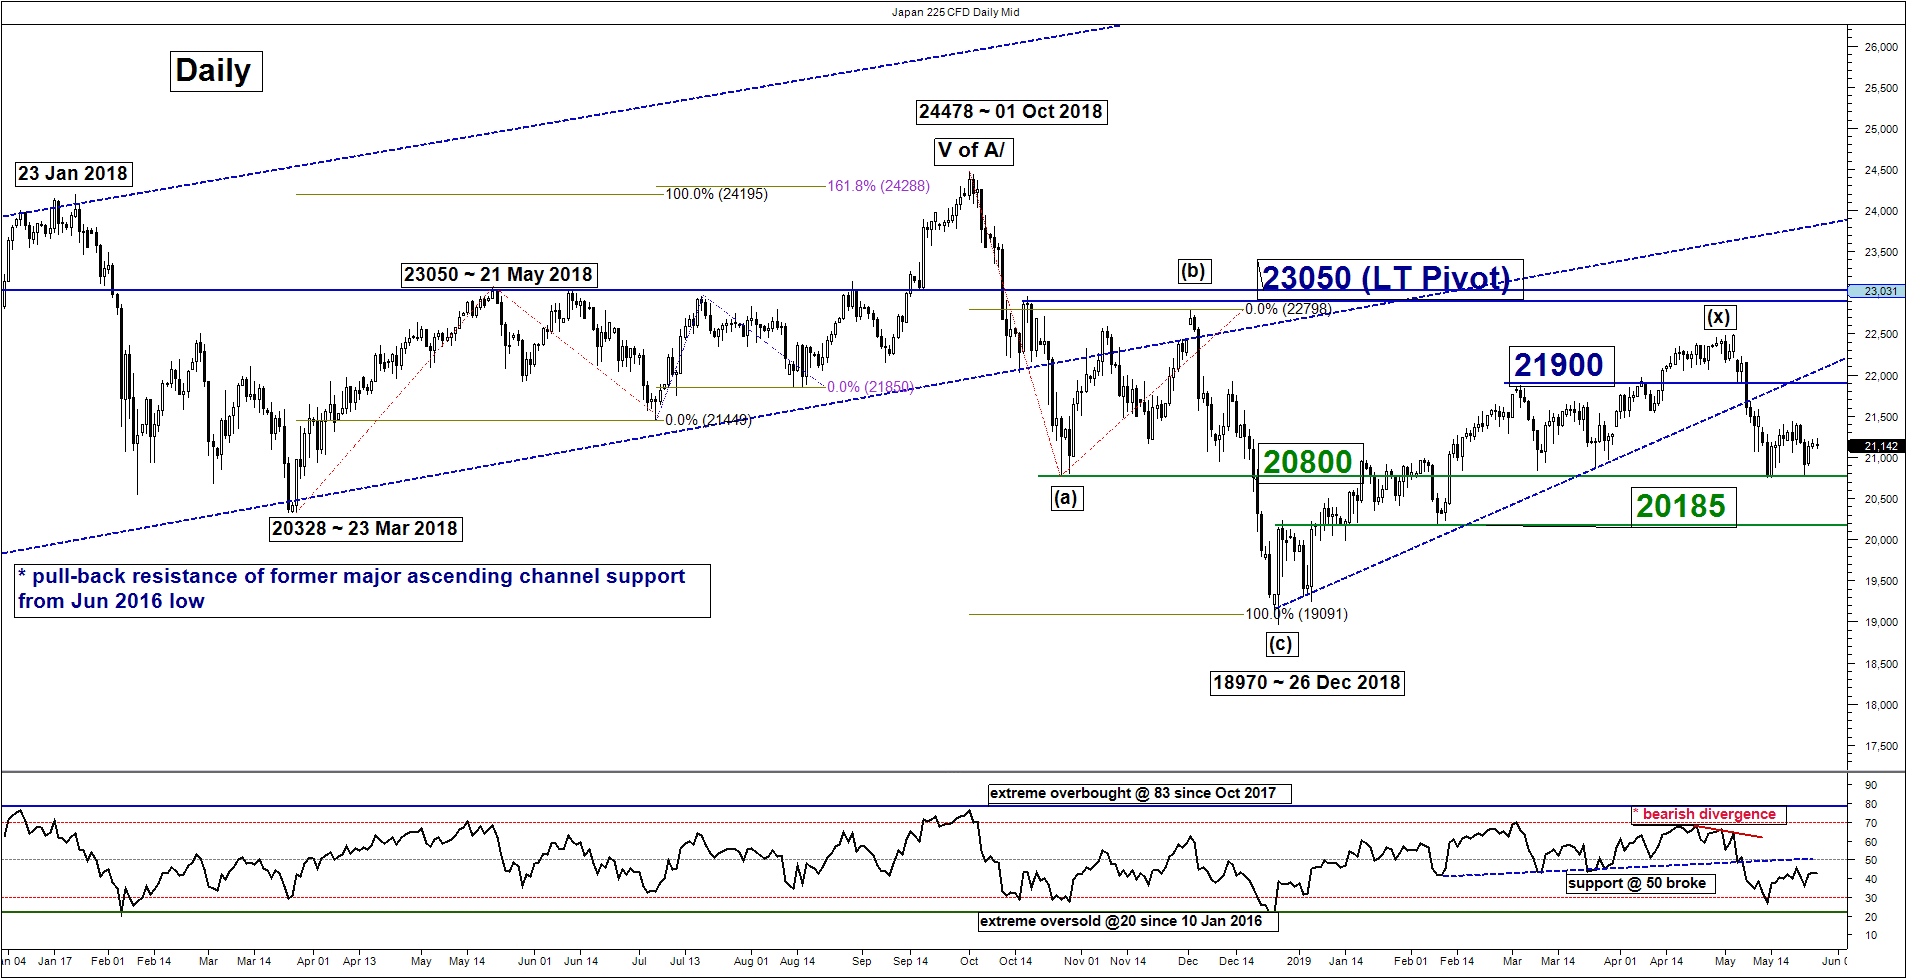
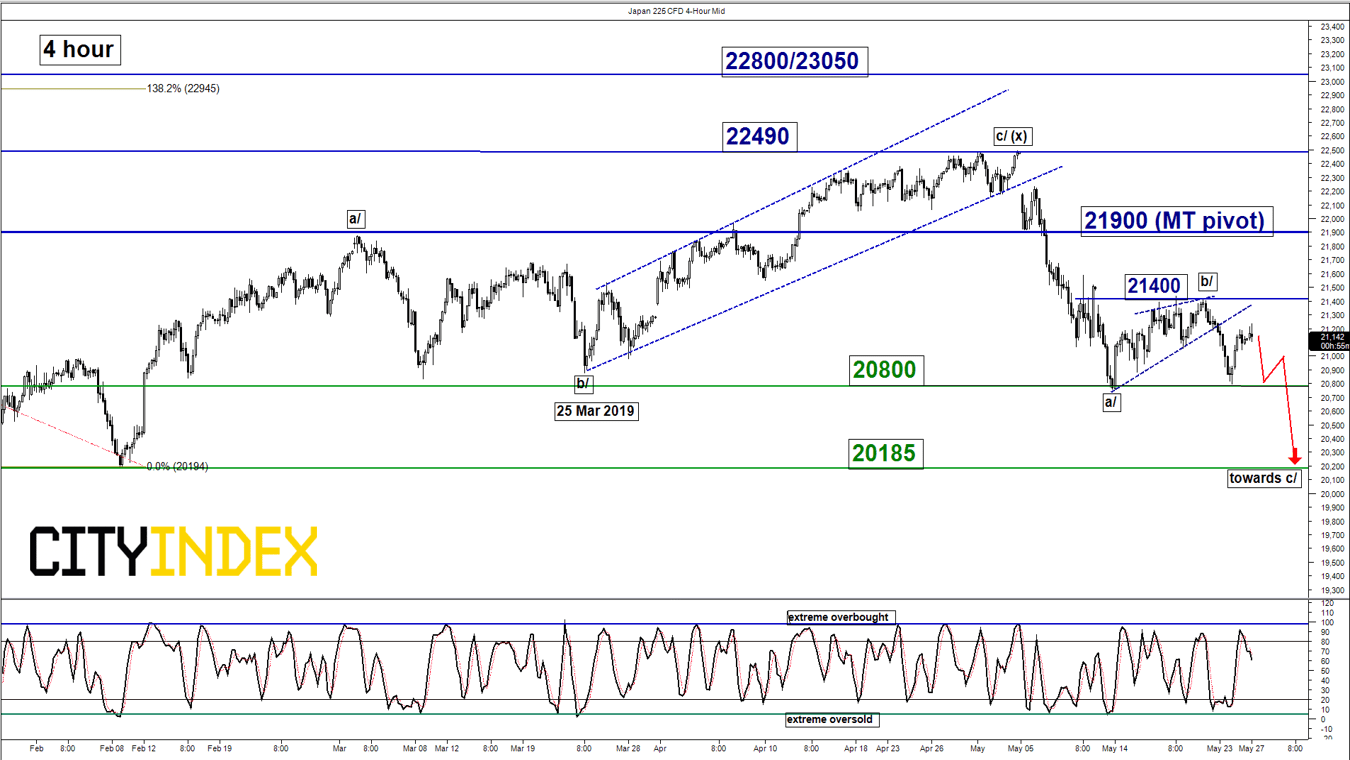
Nikkei 225 – 21900 remains the key resistance to watch
click to enlarge charts
Key Levels (1 to 3 weeks)
Intermediate resistance: 21400
Pivot (key resistance): 21900
Supports: 20800 & 20185
Next resistances: 22490 & 22800/23050
Medium-term (1 to 3 weeks) Outlook
The Japan 225 Index (proxy for the Nikkei 225 futures) had staged the expected push down to hit the first target/support of 21900 (printed a low of 20759 on 13 May 2019) before it traded sideways below 21400 in the past 9 days.
Technical elements remain negative; maintain bearish bias below the 21900 key medium-term pivotal resistance for a potential second downleg of the corrective down move sequence in place since 03 May 2019 to retest 20800 before targeting the next support at 20185.
However, a clearance with a daily close above 21900 invalidates the bearish scenario for a squeeze up towards 22490 and 22800/23050.
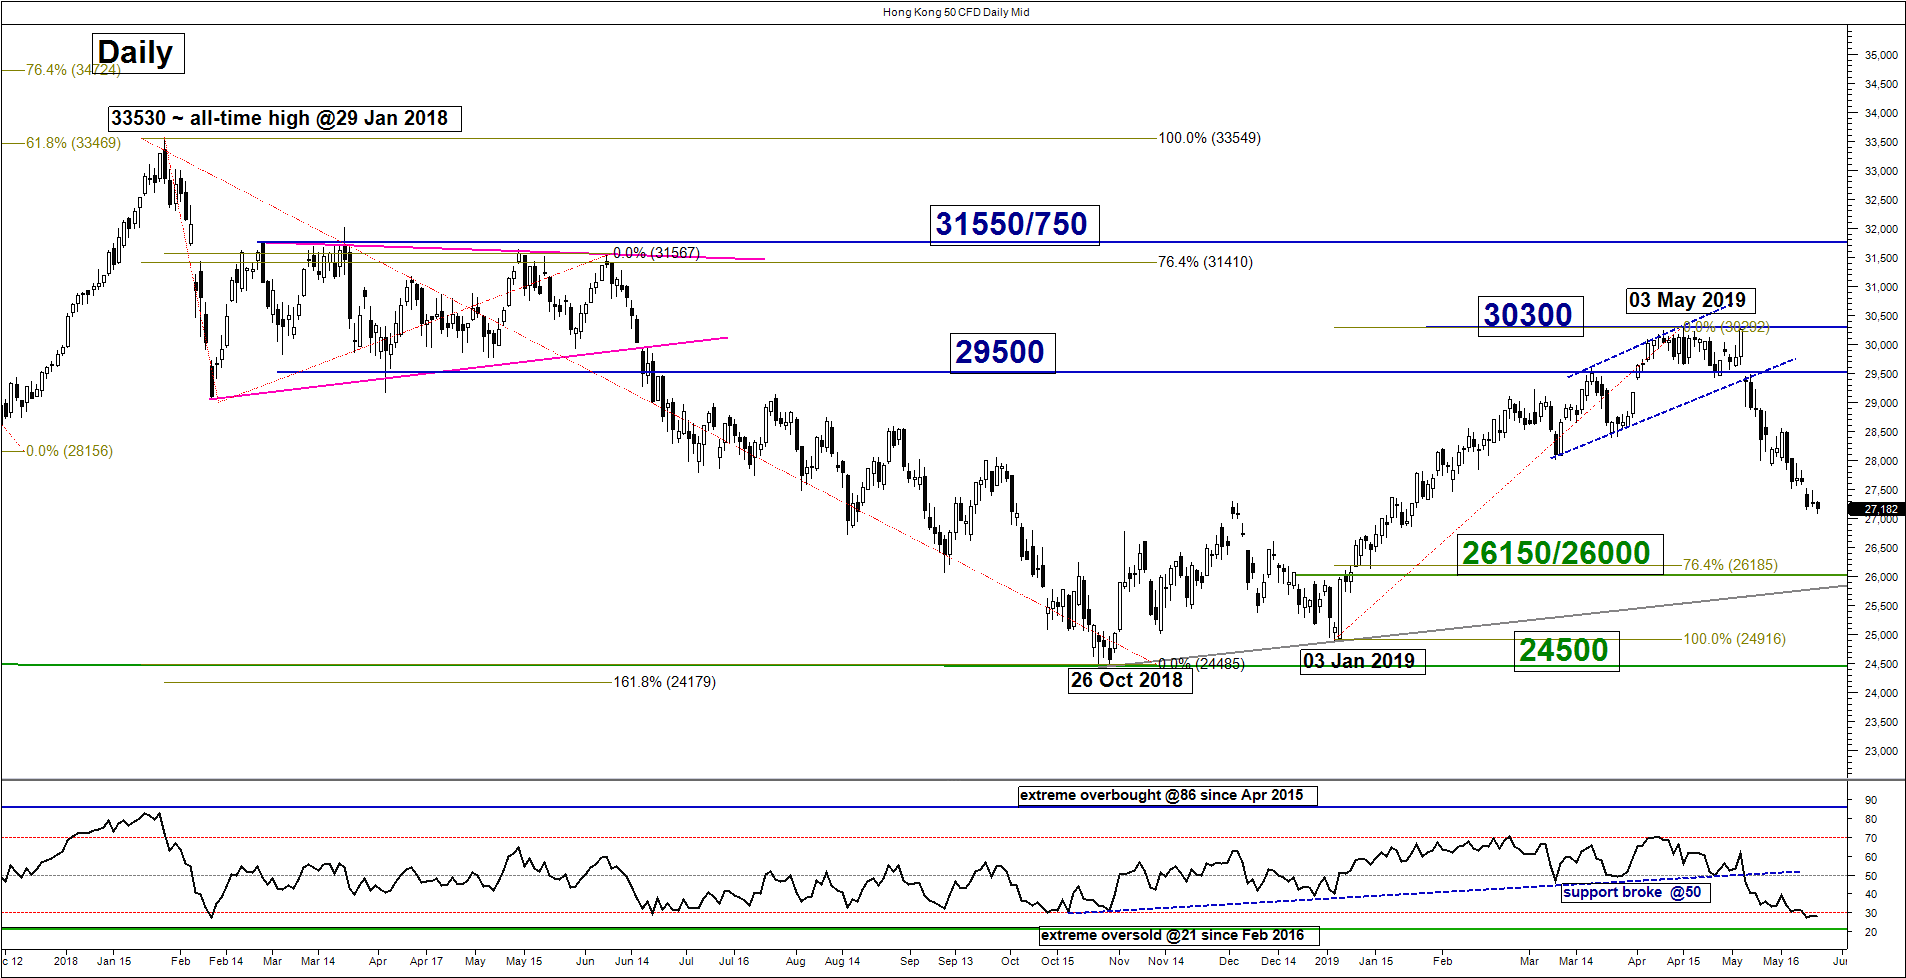
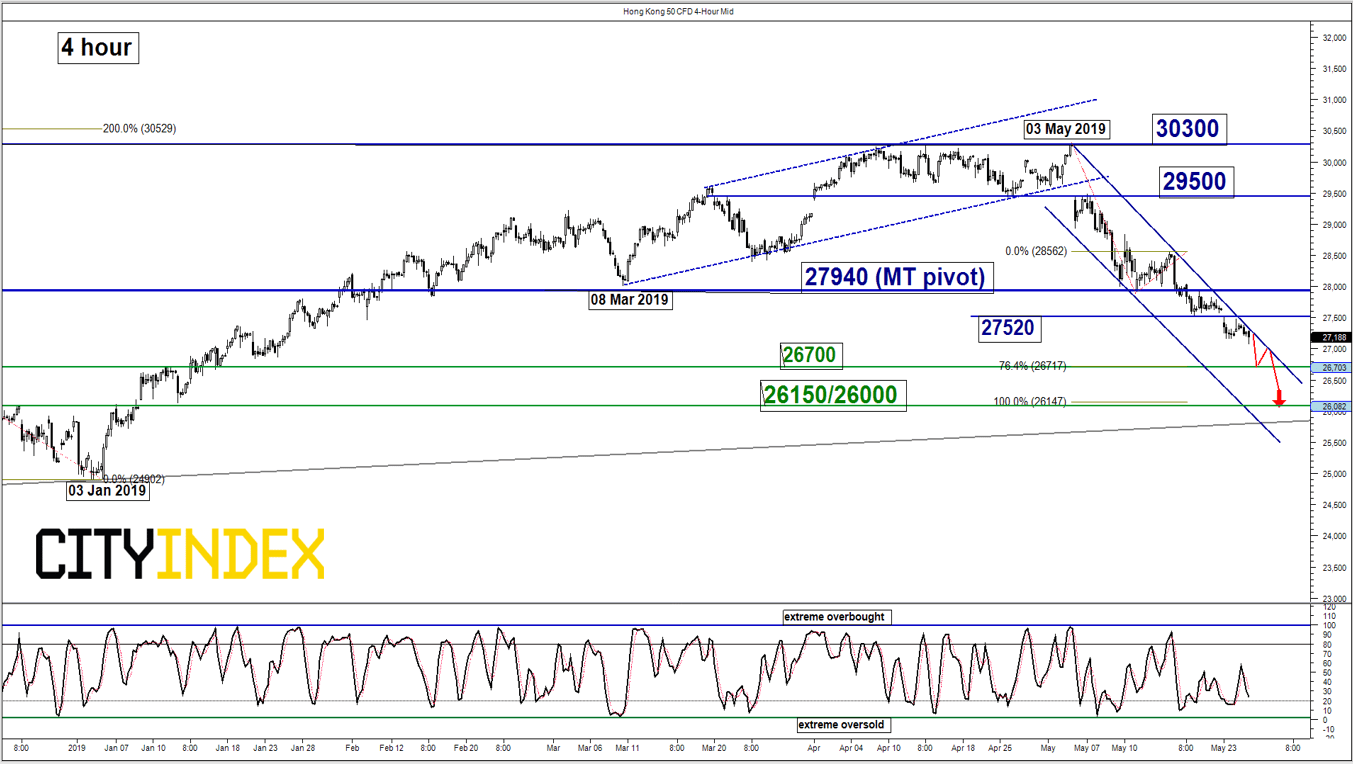
Hang Seng – Further downside pressure below 27940 key resistance
click to enlarge charts
Key Levels (1 to 3 weeks)
Intermediate resistance: 27520
Pivot (key resistance): 27940
Supports: 26700 & 26150/26000
Next resistances: 29500 & 30300
Medium-term (1 to 3 weeks) Outlook
The Hong Kong 50 Index (proxy for Hang Seng Index futures) had tumbled and hit the first target/support of 27290 as expected. Since its 03 May 2019 high of 30300, the Index has evolved within a descending channel with its upper boundary acting as a resistance at 27520. Medium-term momentum as indicated by the daily RSI oscillator is hovering at the oversold region but without any bullish divergence signal yet.
Maintain bearish bias with a tightened key medium-term pivotal resistance now at 27940 for another potential downleg to target 26700 and the key medium-term support at 26150/26000 (Fibonacci retracement/expansion cluster & the ascending support from 26 Oct 2018 low) before a potential recovery materialises.
However, a clearance with a daily close above 27940 negates the bearish tone for a retest on 29500.
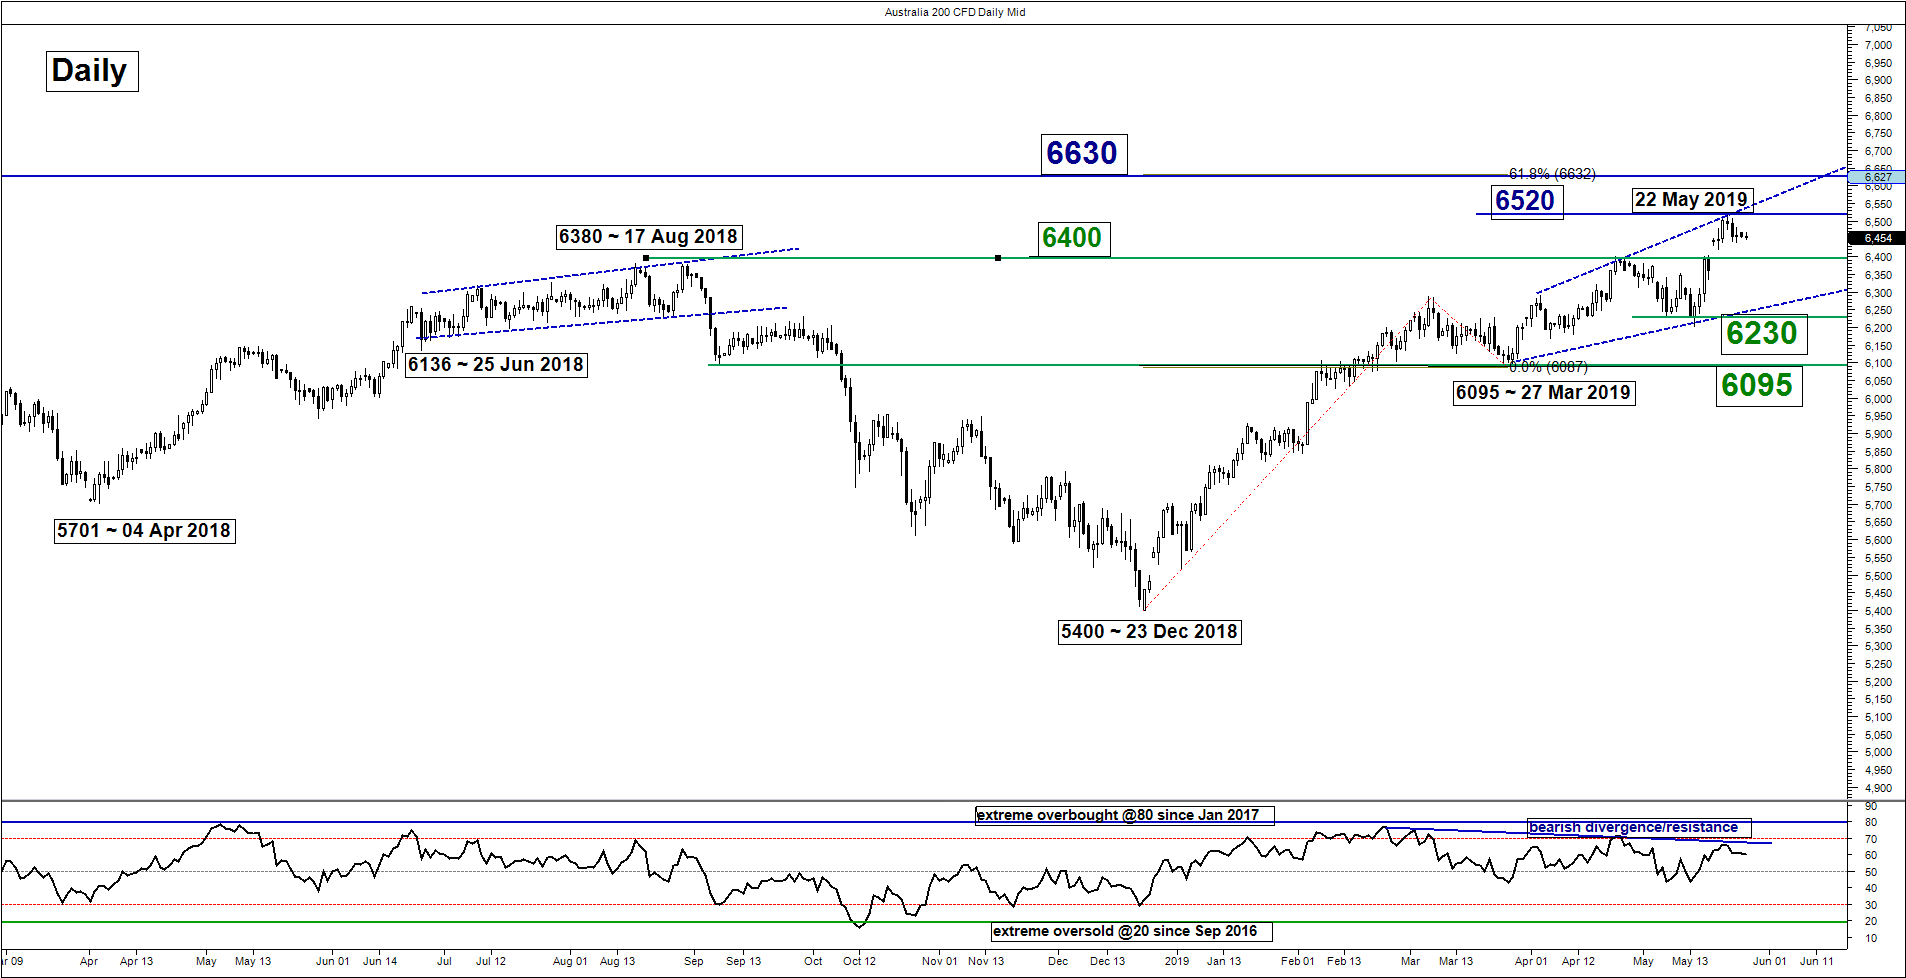
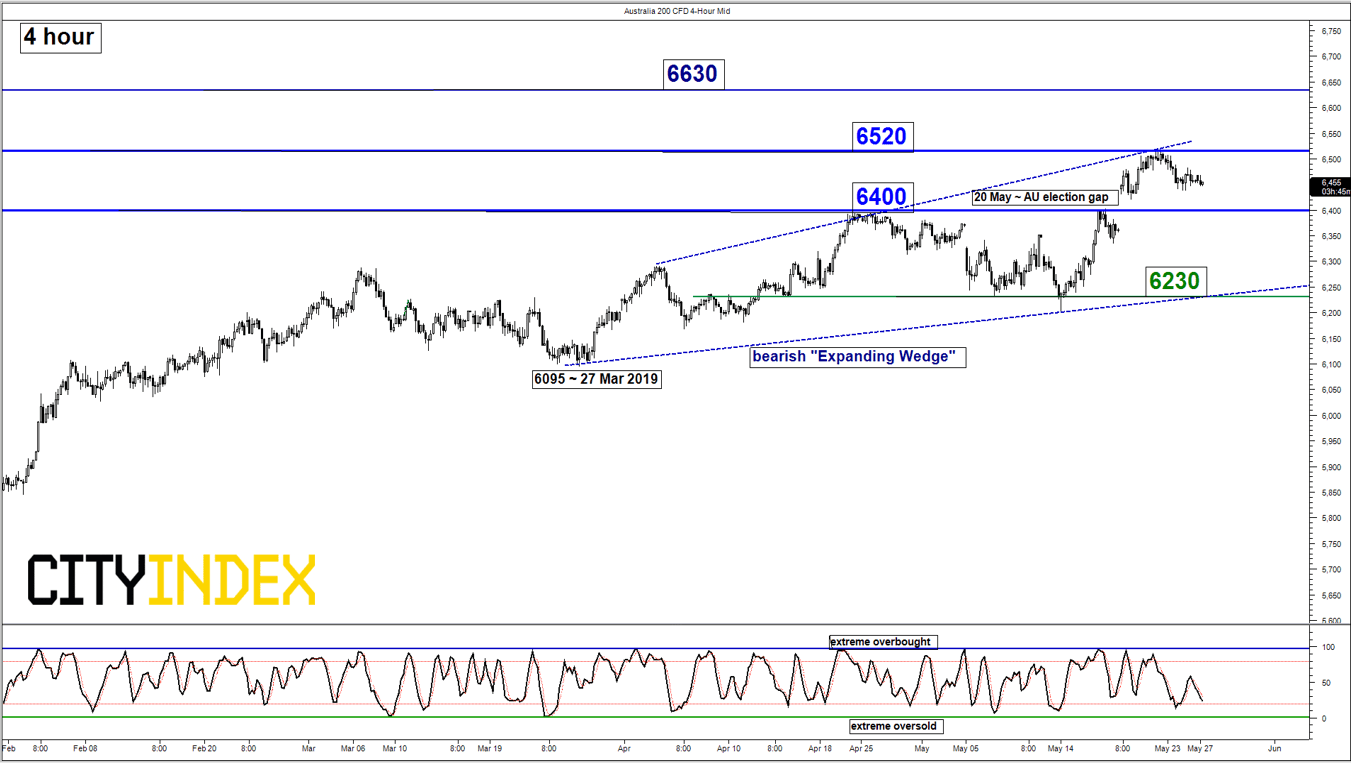
ASX 200 – Bullish exhaustion elements below 6520
click to enlarge charts
Key Levels (1 to 3 weeks)
Resistances: 6520 & 6630
Supports: 6400 & 6230
Medium-term (1 to 3 weeks) Outlook
The Australia 200 Index (proxy for the ASX 200 futures) had gapped up above the 6400 key medium-term resistance after the announcement of the AU election results on 20 May 2019 coupled with a dovish monetary policy stance adopted by the central bank, RBA that had guided market expectations of an interest rate cut in the next RBA meeting on 04 Jun 2019 from a record low of 1.50% since Aug 2016.
Current price action of the Index has started to evolve into a bearish “Expanding Wedge” configuration in place since 27 Mar 2019 with bearish negative momentum observations seen in the daily RSI oscillator. Interestingly, such pattern has been detected in the past price action of the Index from 25 Jun 2018 to 17 Aug 2018 (also a 2-month duration) before a significant correction of 15% took place to print a low 5400 on 23 Dec 2018.
Mix elements; prefer to turn neutral between 6520 and 6400. A break with below 6400 sees a further decline to test the lower boundary of the “Expanding Wedge” at 6230. On the flipside, a clearance above 6520 triggers a further rally towards the next resistance at 6630.
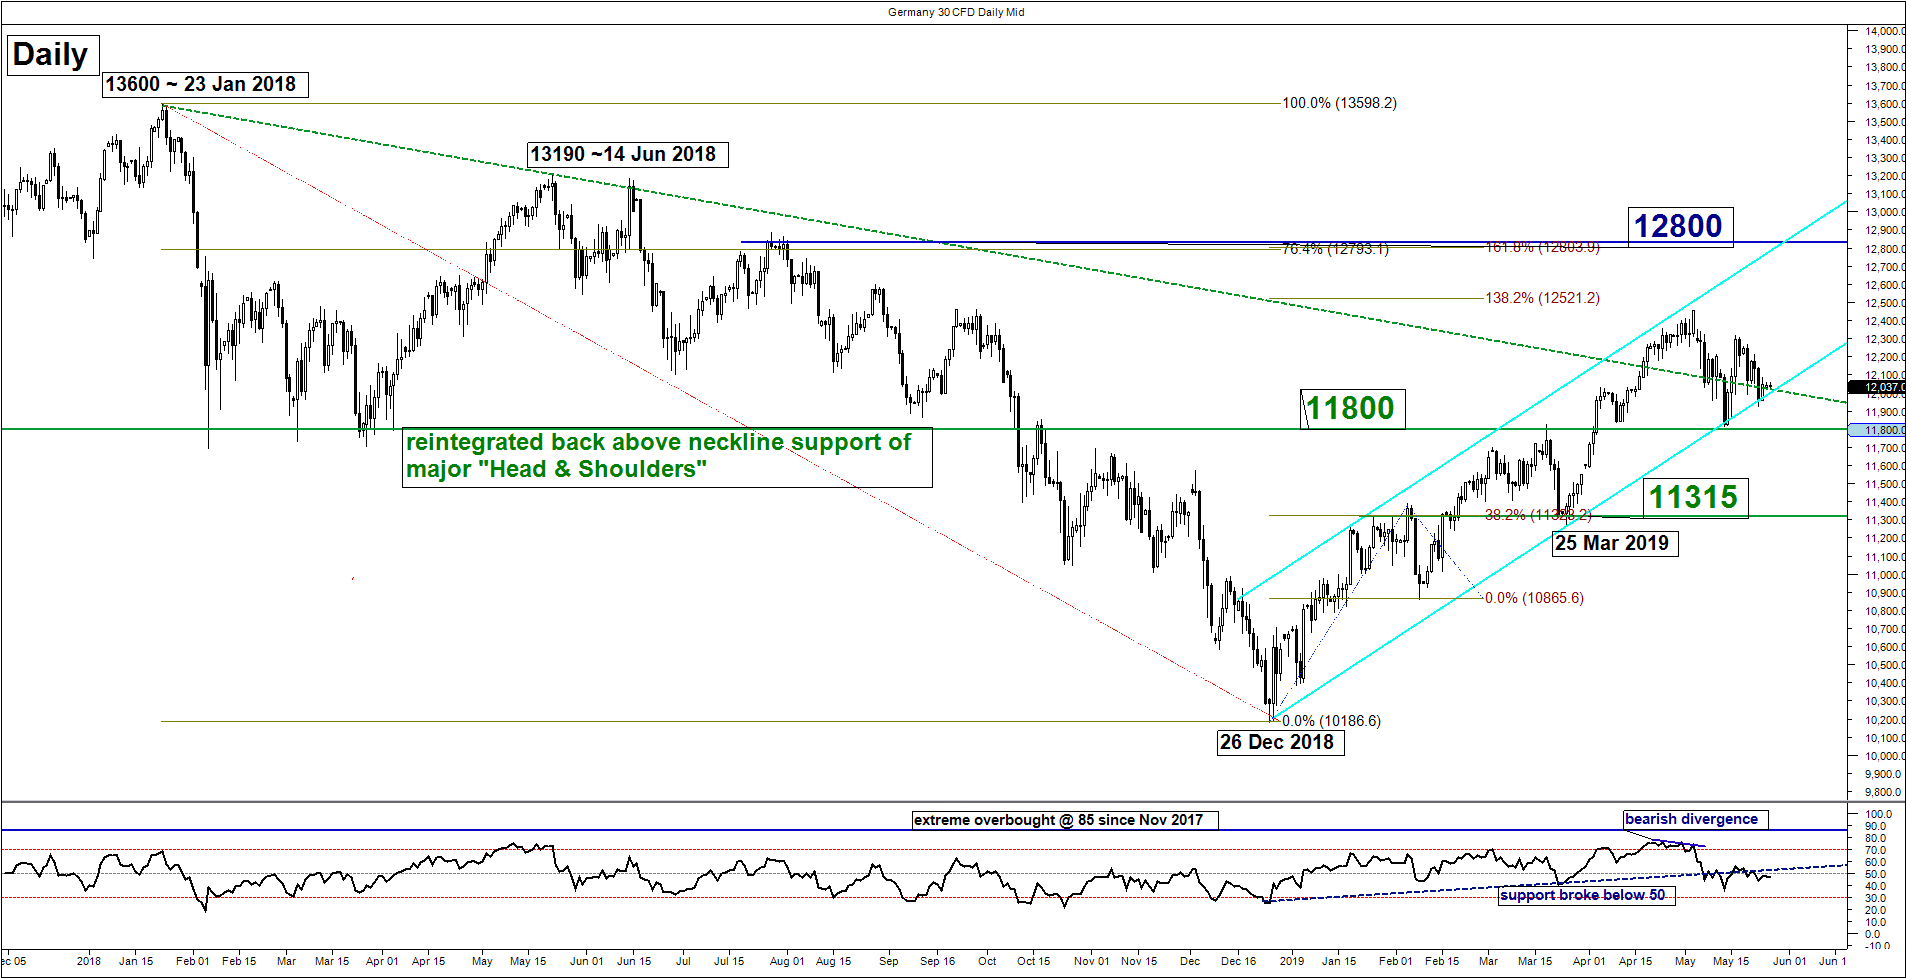
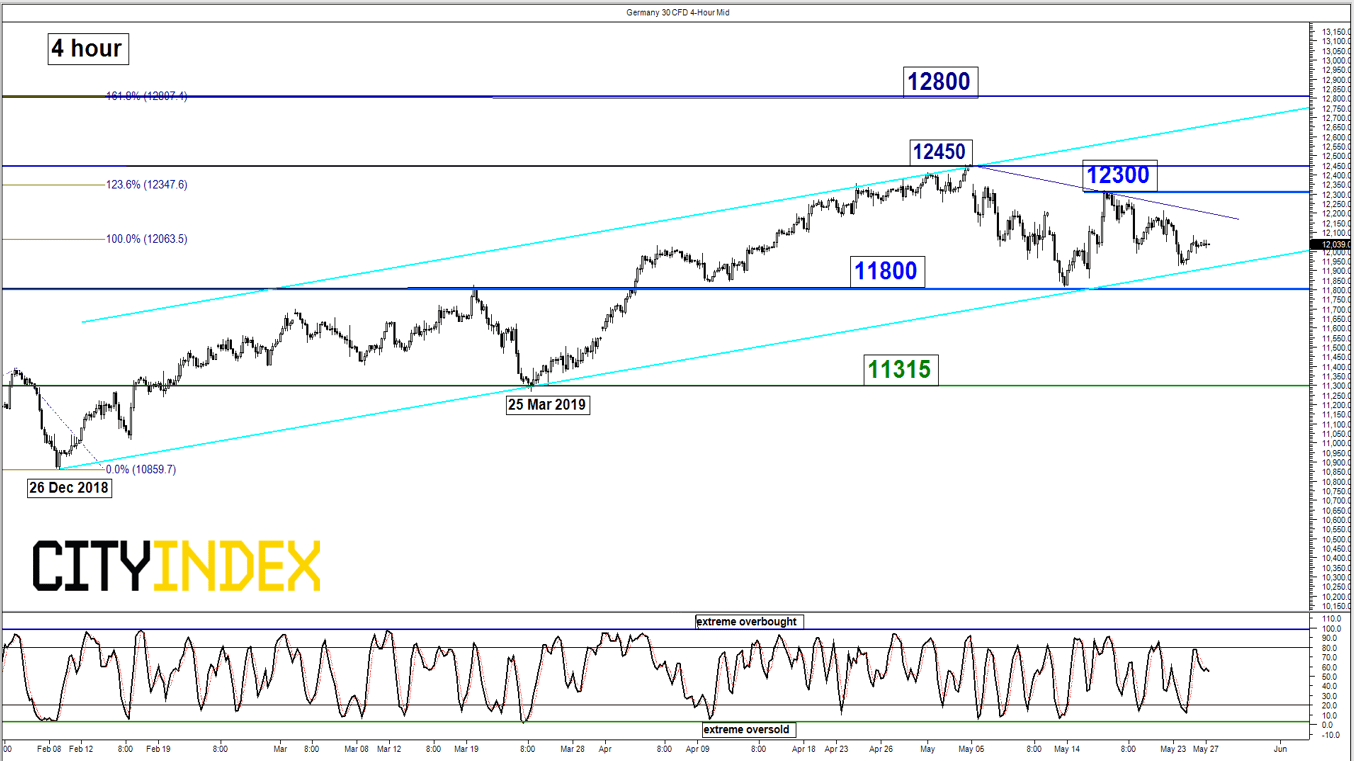
DAX – Bears need to break below 11800
click to enlarge charts
Key Levels (1 to 3 weeks)
Supports: 11800 & 11315
Resistances: 12300, 12450 & 12800
Medium-term (1 to 3 weeks) Outlook
The Germany 30 Index (proxy for the DAX futures) had staged the expected push down and hit the first target/support of 11800 (also the lower boundary of a medium-term ascending channel in place since 26 Dec 2018 low).
The Index has started to trade sideways below 12300 for the past 8 days with mix elements. Prefer to turn neutral between 11800 and 12300. A break with a daily close below 11800 opens up scope for a second downleg of the corrective down move sequence to target the next support at 11315 (also the 50% Fibonacci retracement of the entire up move from 26 De 2018 low to 03 May 2019 high).
On the flipside, a clearance above 12300 resumes the medium-term uptrend to retest 03 May 2019 high of 12450 before a further potential rally towards the next resistance at 12800 (swing high of 27/31 Jul 2018 & Fibonacci expansion/retracement cluster).
Charts are from City Index Advantage TraderPro & eSignal
StoneX Financial Ltd (trading as “City Index”) is an execution-only service provider. This material, whether or not it states any opinions, is for general information purposes only and it does not take into account your personal circumstances or objectives. This material has been prepared using the thoughts and opinions of the author and these may change. However, City Index does not plan to provide further updates to any material once published and it is not under any obligation to keep this material up to date. This material is short term in nature and may only relate to facts and circumstances existing at a specific time or day. Nothing in this material is (or should be considered to be) financial, investment, legal, tax or other advice and no reliance should be placed on it.
No opinion given in this material constitutes a recommendation by City Index or the author that any particular investment, security, transaction or investment strategy is suitable for any specific person. The material has not been prepared in accordance with legal requirements designed to promote the independence of investment research. Although City Index is not specifically prevented from dealing before providing this material, City Index does not seek to take advantage of the material prior to its dissemination. This material is not intended for distribution to, or use by, any person in any country or jurisdiction where such distribution or use would be contrary to local law or regulation.
For further details see our full non-independent research disclaimer and quarterly summary.
CFDs are complex instruments and come with a high risk of losing money rapidly due to leverage. 69% of retail investor accounts lose money when trading CFDs with this provider. You should consider whether you understand how CFDs work and whether you can afford to take the high risk of losing your money. CFD and Forex Trading are leveraged products and your capital is at risk. They may not be suitable for everyone. Please ensure you fully understand the risks involved by reading our full risk warning.
City Index is a trading name of StoneX Financial Ltd. Head and Registered Office: 1st Floor, Moor House, 120 London Wall, London, EC2Y 5ET. StoneX Financial Ltd is a company registered in England and Wales, number: 05616586. Authorised and regulated by the Financial Conduct Authority. FCA Register Number: 446717.
City Index is a trademark of StoneX Financial Ltd.
The information on this website is not targeted at the general public of any particular country. It is not intended for distribution to residents in any country where such distribution or use would contravene any local law or regulatory requirement.
© City Index 2024