Weekly Technical Outlook on Major Stock Indices 13 May to 17 May 2019 Part 2
Hang Seng – Further potential decline to test key medium-term support
click to enlarge charts
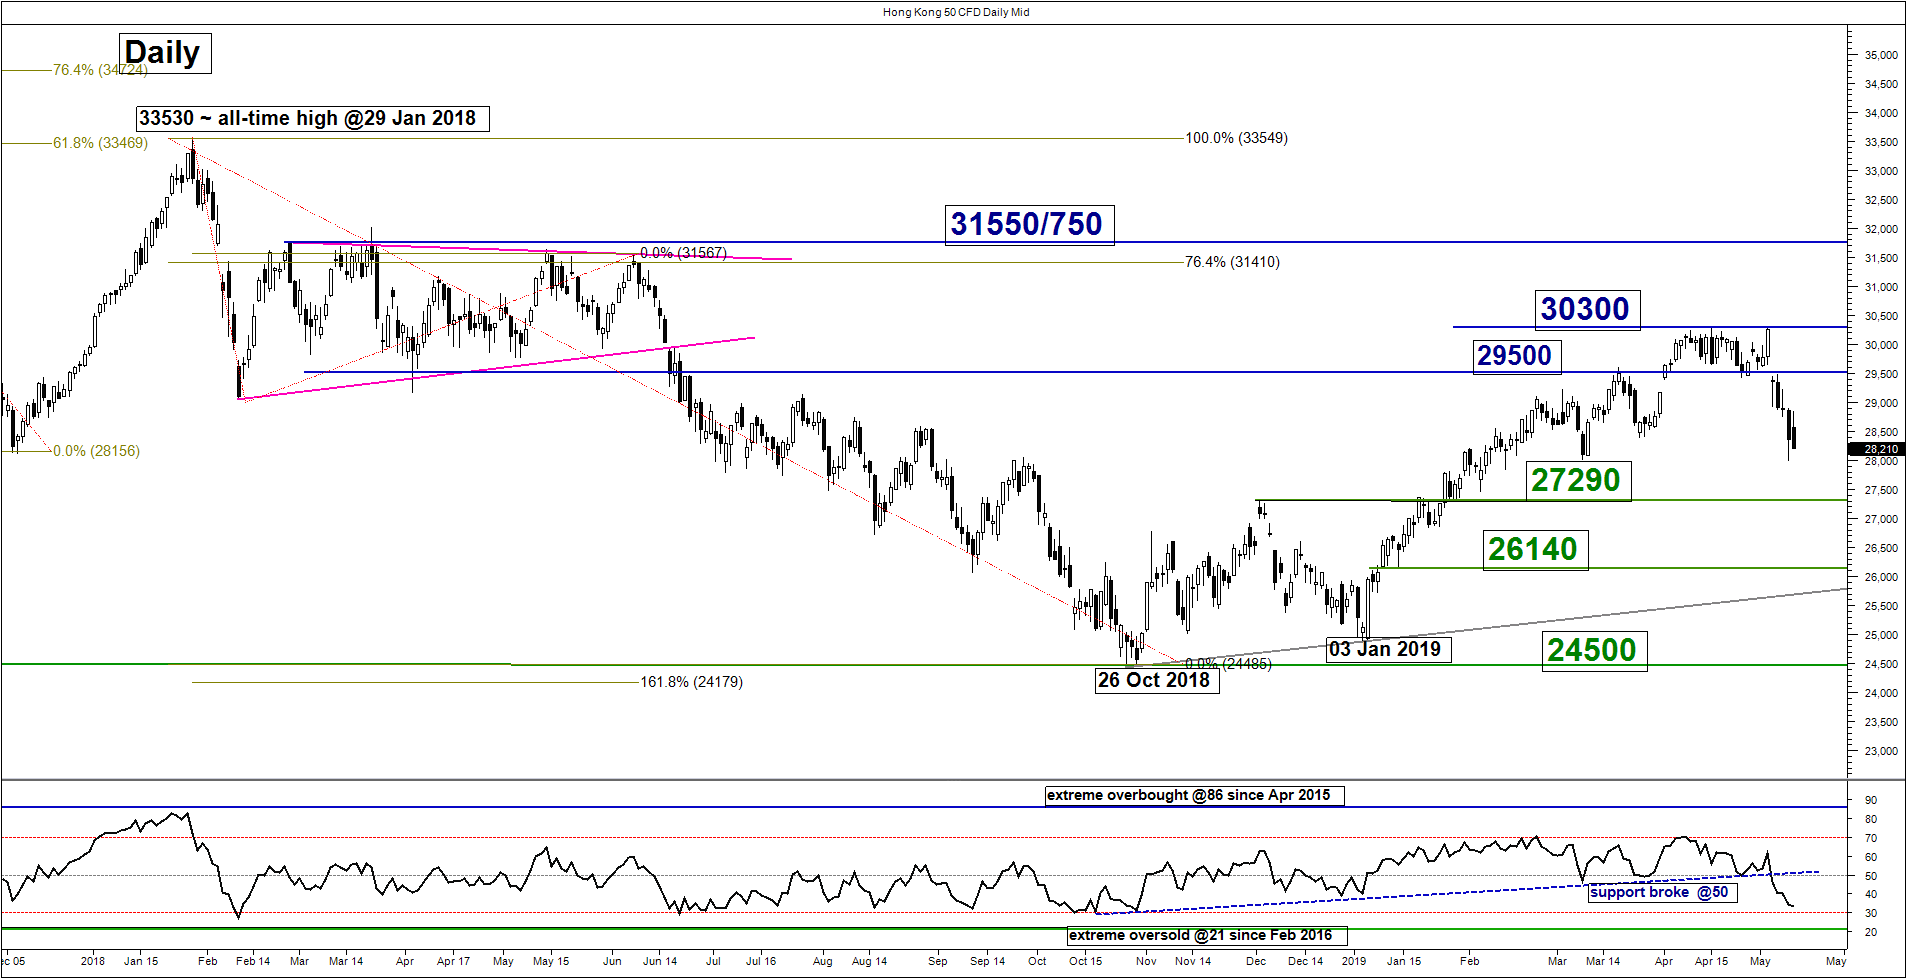
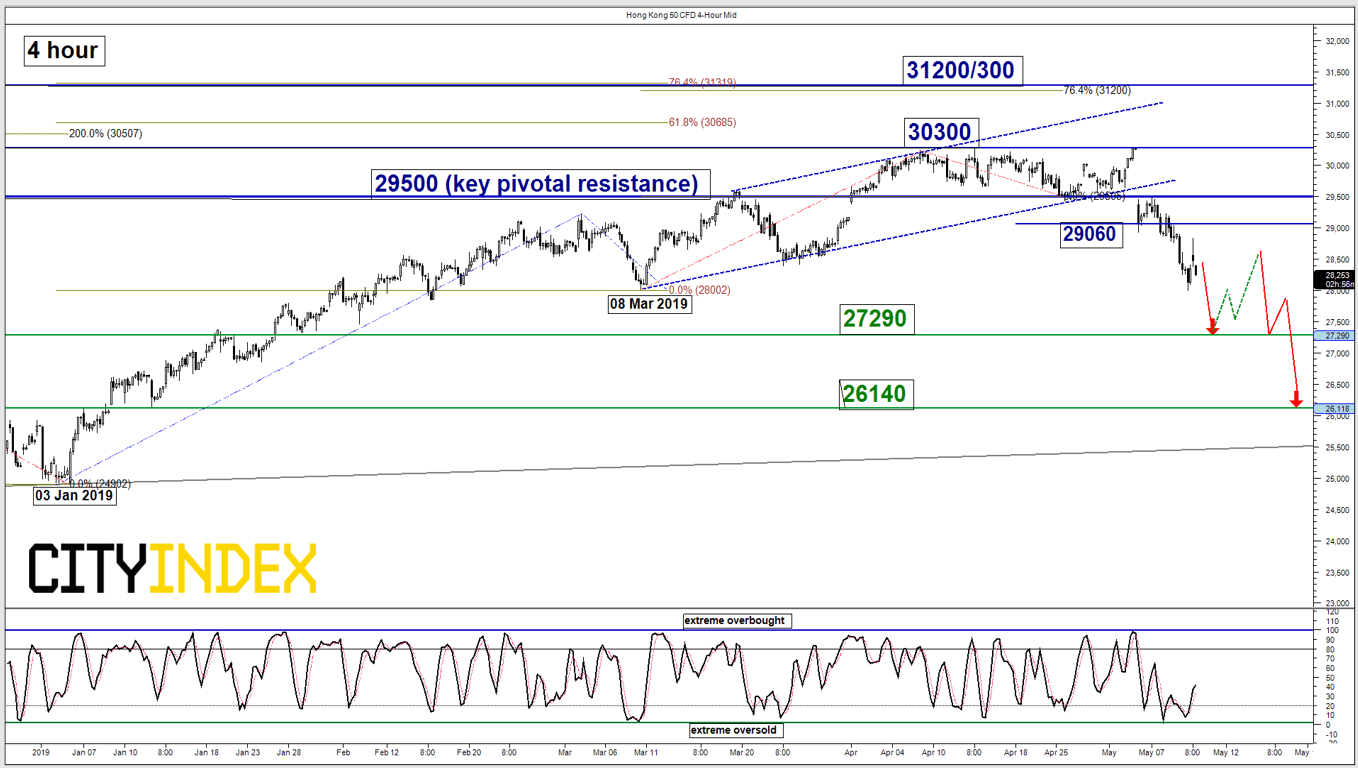
Key Levels (1 to 3 weeks)
Intermediate resistance: 29060
Pivot (key resistance): 29500
Supports: 27290 & 26140
Next resistances: 30300 & 31200/300
Medium-term (1 to 3 weeks) Outlook
The Hong Kong 50 Index (proxy for Hang Seng Index futures) has staged the expected decline and met the first support/target at 28000 as per highlighted in our previous weekly outlook report (click here for a recap).
No change, maintain bearish bias with a tightened key medium-term pivotal resistance at 29500 in any bounces for a further potential decline to target the next supports at 27290 and 26140 (76.4% Fibonacci retracement of the entire up move from 03 Jan 2019 low to 03 May 2019 high & close to the ascending trendline in place since 26 Oct 2018 low).
On the other hand, a clearance with a daily close above 29500 invalidates the bearish scenario for a push up to retest last week high of 30300 and even another impulsive up move towards the next resistance at 31200/300 (Fibonacci expansion cluster).
ASX 200 – 6400 remains the key resistance to watch
click to enlarge charts
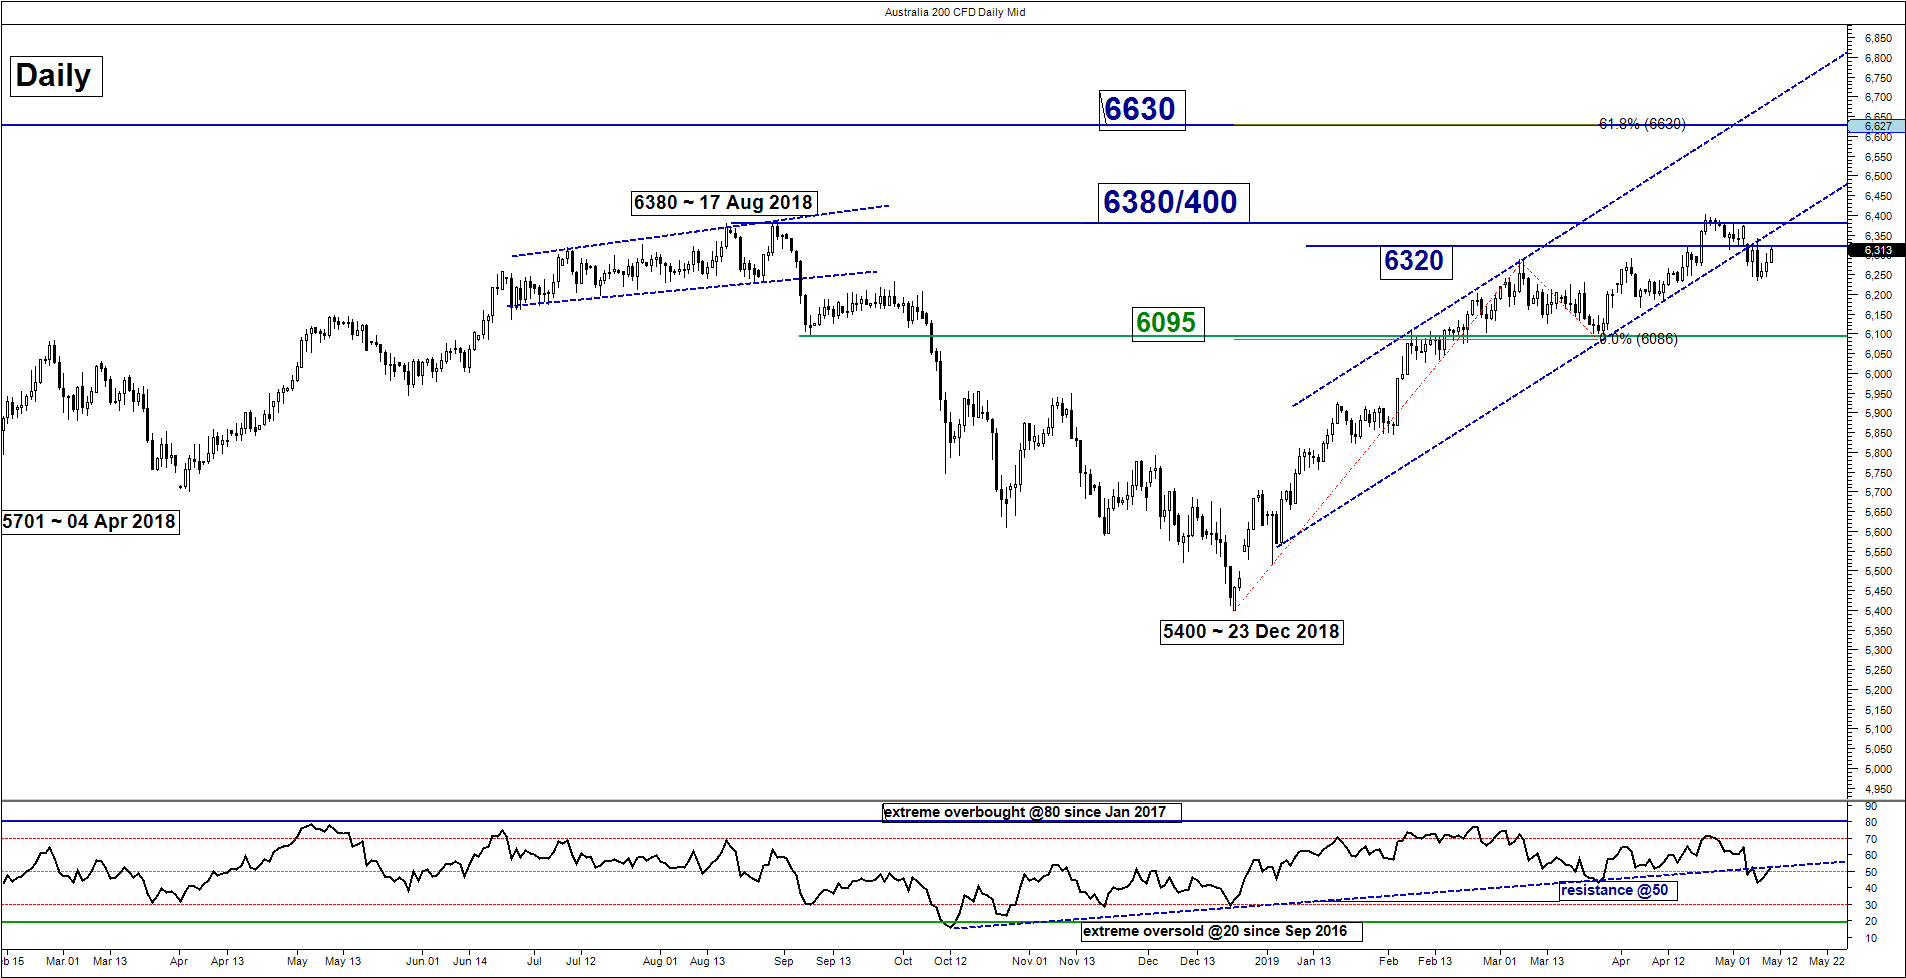
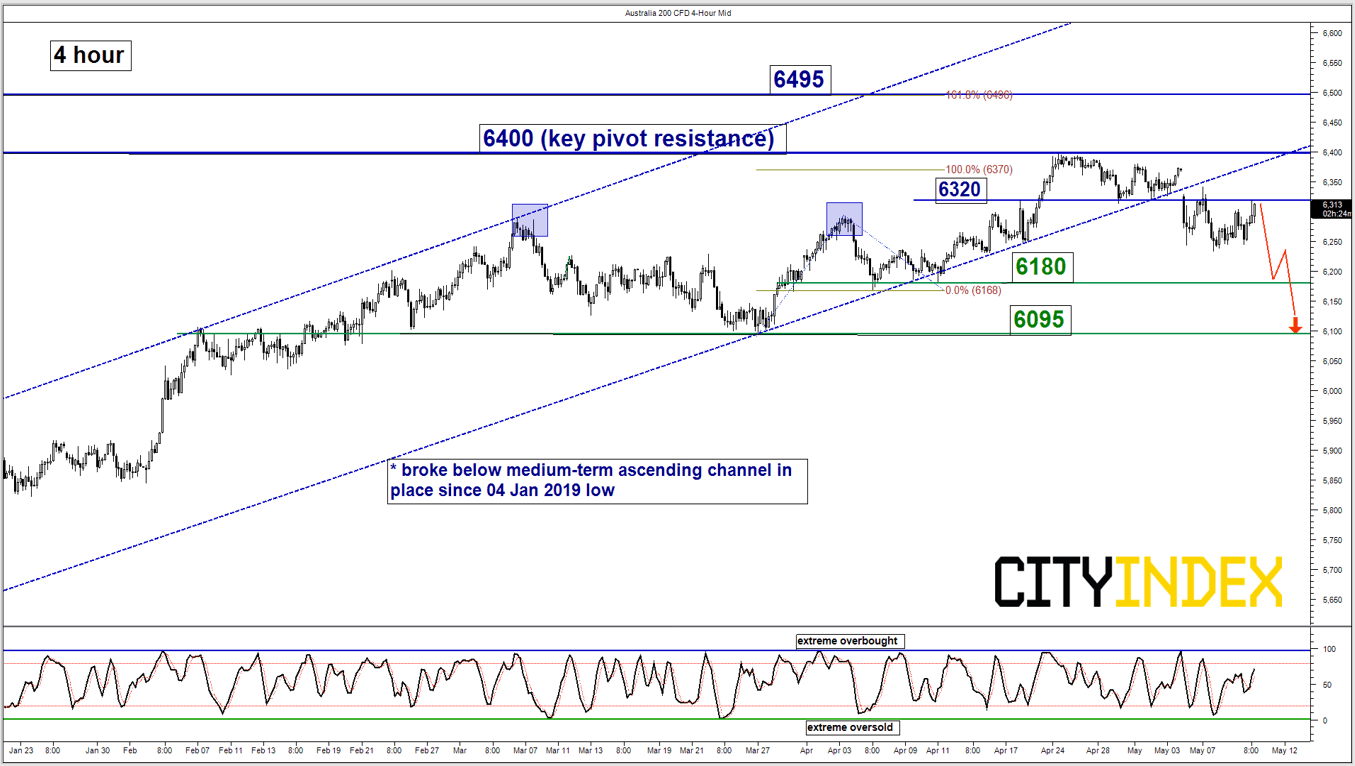
Key Levels (1 to 3 weeks)
Intermediate resistance: 6320
Pivot (key resistance): 6400
Supports: 6180 & 6095
Next resistance: 6495
Medium-term (1 to 3 weeks) Outlook
The Australia 200 Index (proxy for the ASX 200 futures) has traded sideways below the 6320 intermediate resistance as Australia goes to the polls on next Sat, 18 May for her federal election.
No change, 6400 remains as the key medium-term pivotal resistance for the start of a potential multi-week corrective decline to target the next supports at 6180 and 6095 in the first step.
On the other hand, clearance above 6400 with a daily close above invalidates the bearish scenario to revive the bulls for a push to towards the next resistance at 64950
DAX – Medium-term uptrend at jeopardy of reversing down
click to enlarge charts
Key Levels (1 to 3 weeks)
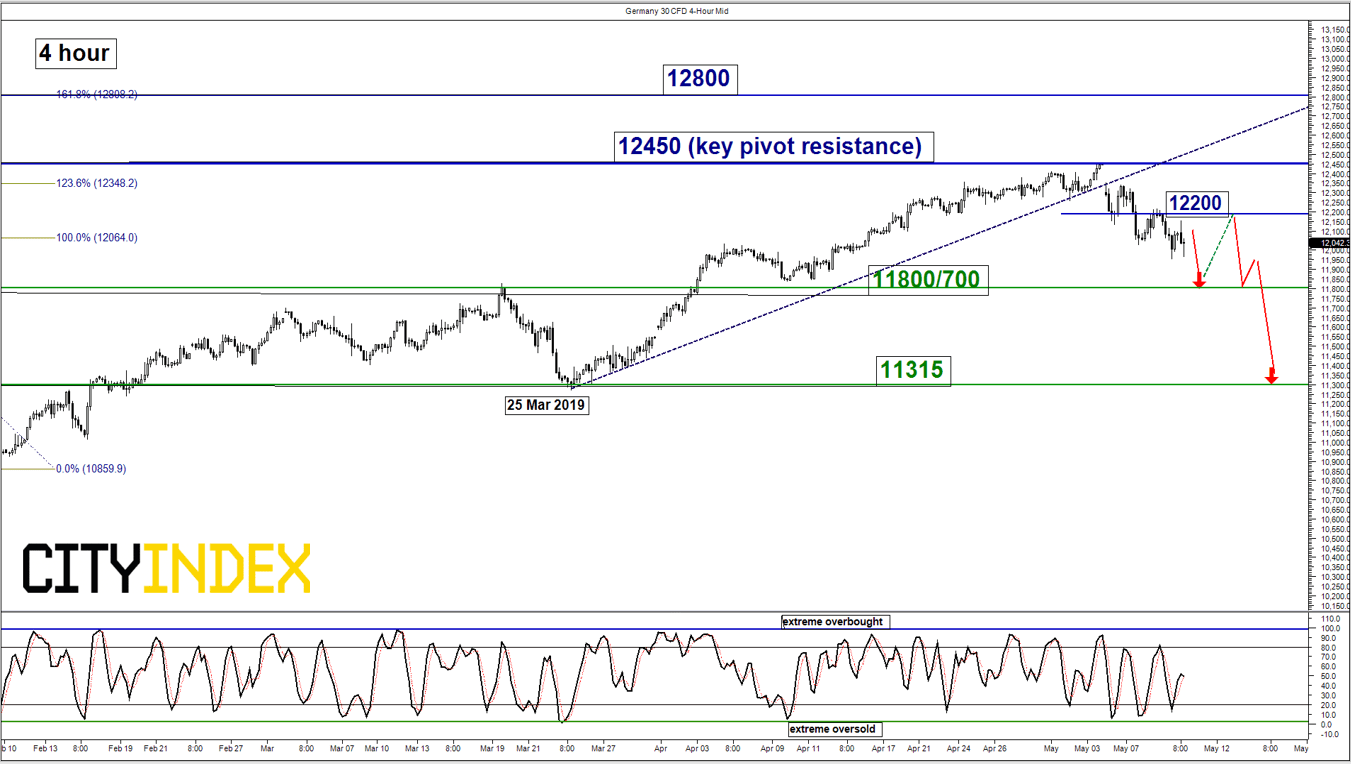
Intermediate resistance: 12200
Pivot (key resistance): 12450
Supports: 11800/700 & 11315
Next resistance: 12800
Medium-term (1 to 3 weeks) Outlook
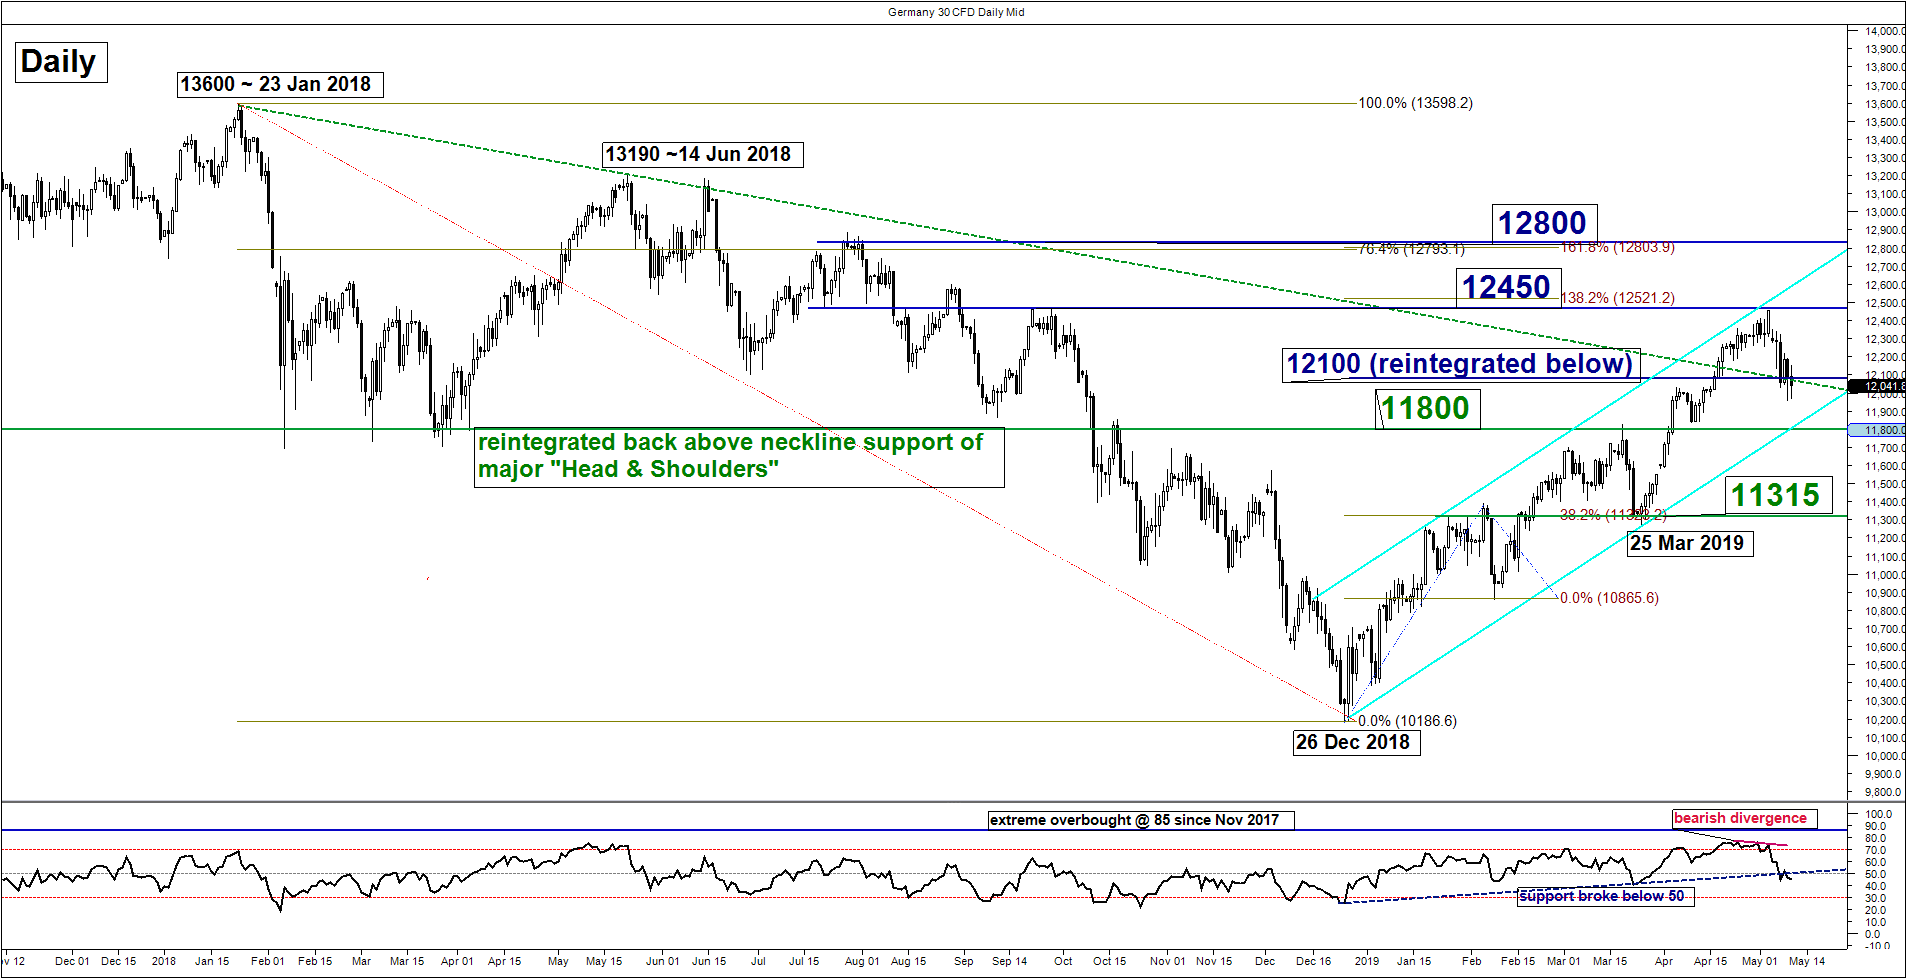
The Germany 30 Index (proxy for the DAX futures) has dropped lower as expected and broke below the 12100 level yesterday, 09 May. The medium-term uptrend of the Index in place since 26 Dec 2018 is now at risk of breaking down. The break below 12100 has led the Index to reintegrate below the major descending resistance from its 23 Jan 2018 all time high that has suggested a potential failure bullish breakout earlier on 17 Apr 2019. In addition, the daily RSI oscillator has broken down below a significant corresponding support at the 50 level which indicates a built-up in medium-term downside momentum.
No change, maintain bearish bias with 12450 as key medium-term pivotal resistance for a further potential push down to test the 11800/700 (also the medium-term ascending channel support from 26 Dec 2018) and a break with a 4-hour close below 11700 opens up scope for a potential multi-week corrective decline to target the next support at 11315 (also the 50% Fibonacci retracement of the entire up move from 26 De 2018 low to 03 May 2019 high).
On the other hand, a clearance with a daily close above 12450 invalidates the bearish scenario for a continuation of the impulsive up move to towards the next resistance at 12800 (swing high of 27/31 Jul 2018 & Fibonacci expansion/retracement cluster).
Charts are from City Index Advantage TraderPro
StoneX Financial Ltd (trading as “City Index”) is an execution-only service provider. This material, whether or not it states any opinions, is for general information purposes only and it does not take into account your personal circumstances or objectives. This material has been prepared using the thoughts and opinions of the author and these may change. However, City Index does not plan to provide further updates to any material once published and it is not under any obligation to keep this material up to date. This material is short term in nature and may only relate to facts and circumstances existing at a specific time or day. Nothing in this material is (or should be considered to be) financial, investment, legal, tax or other advice and no reliance should be placed on it.
No opinion given in this material constitutes a recommendation by City Index or the author that any particular investment, security, transaction or investment strategy is suitable for any specific person. The material has not been prepared in accordance with legal requirements designed to promote the independence of investment research. Although City Index is not specifically prevented from dealing before providing this material, City Index does not seek to take advantage of the material prior to its dissemination. This material is not intended for distribution to, or use by, any person in any country or jurisdiction where such distribution or use would be contrary to local law or regulation.
For further details see our full non-independent research disclaimer and quarterly summary.
CFDs are complex instruments and come with a high risk of losing money rapidly due to leverage. 69% of retail investor accounts lose money when trading CFDs with this provider. You should consider whether you understand how CFDs work and whether you can afford to take the high risk of losing your money. CFD and Forex Trading are leveraged products and your capital is at risk. They may not be suitable for everyone. Please ensure you fully understand the risks involved by reading our full risk warning.
City Index is a trading name of StoneX Financial Ltd. Head and Registered Office: 1st Floor, Moor House, 120 London Wall, London, EC2Y 5ET. StoneX Financial Ltd is a company registered in England and Wales, number: 05616586. Authorised and regulated by the Financial Conduct Authority. FCA Register Number: 446717.
City Index is a trademark of StoneX Financial Ltd.
The information on this website is not targeted at the general public of any particular country. It is not intended for distribution to residents in any country where such distribution or use would contravene any local law or regulatory requirement.
© City Index 2024