Weekly Technical Outlook on Major Stock Indices 13 May to 17 May 2019 Part 1
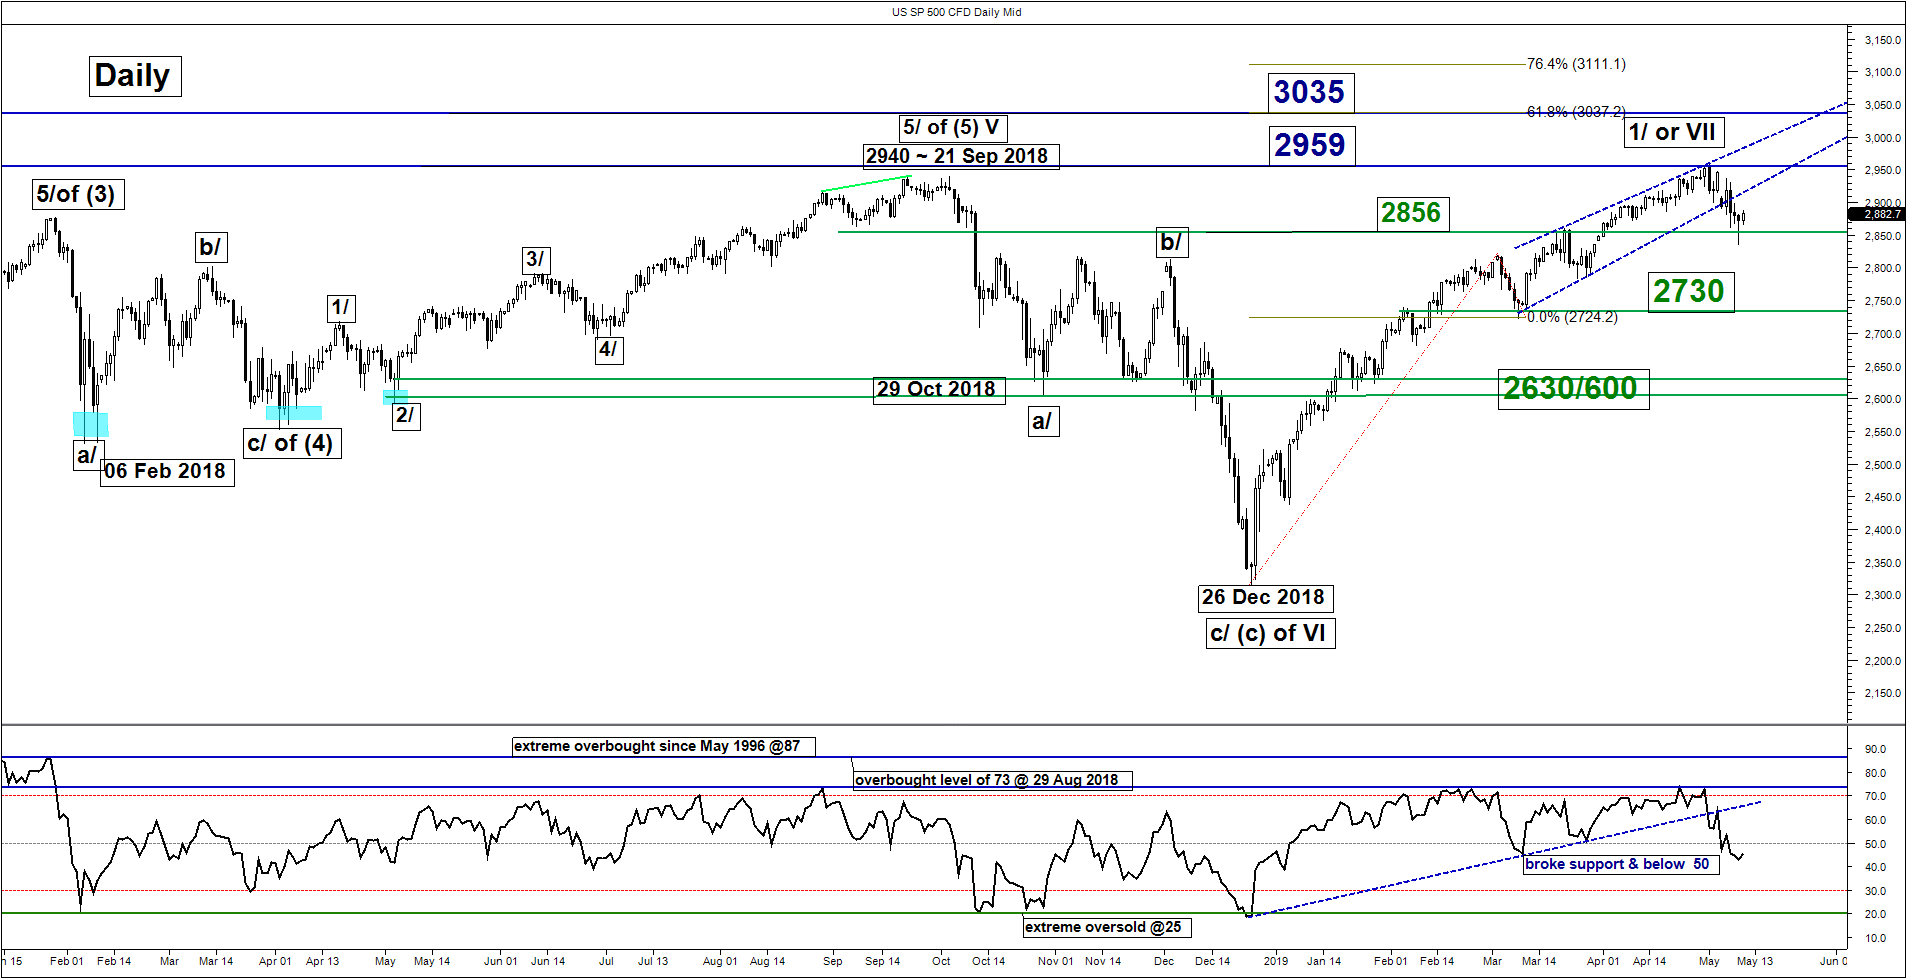
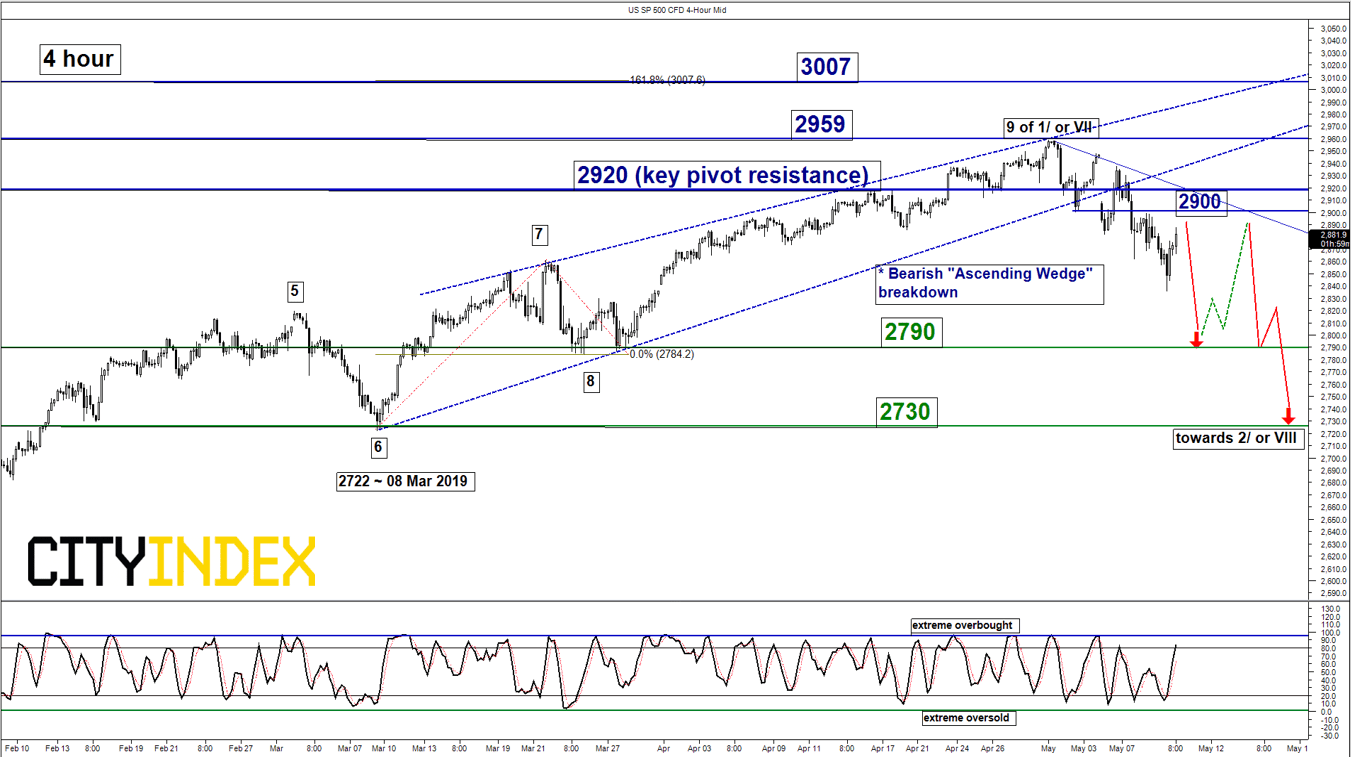
S&P 500 – Further corrective down move in progress
click to enlarge charts
Key Levels (1 to 3 weeks)
Intermediate resistance: 2900
Pivot (key resistance): 2920
Supports: 2790 & 2730
Next resistance: 2959 & 3007
Medium-term (1 to 3 weeks) Outlook
The SP 500 Index (proxy for the S&P 500 futures) has shaped the expected decline as per highlighted in our previous weekly outlook report and met the first support/target of 2875/56 (click here for a recap).
It printed a low of 2835 in yesterday, 09 May early U.S. session before it shaped a bounce of 1.2% to end the U.S. session at 2870 on the backdrop of a tense U.S/China trade relation. Trade officials from both sides have entered the final stretch of a 2-days negotiation talk in Washington to hammer out a deal before U.S. administration imposes additional tariffs on Chinese imports after 12.00 am U.S. time on Friday, 10 May. Technical elements are still negative as follow;
- The medium-term uptrend in place since 26 Dec 2018 low has been damaged as price action to the Index has shaped a bearish reversal “Ascending Wedge” configuration in shape since 08 Mar 2019 (this type of chart pattern tends to form at the end of an uptrend and likely trigger a volatile movement in the opposite direction of the prior trend). Interestingly, the rebound that has occurred after its earlier gapped down (also the bearish break of the “Ascending Wedge”) seen on Mon, 06 May after U.S. President Trump’s tariffs threat to China fired on Sun has retested and reacted off the former “Ascending Wedge” support now turns pull-back resistance at 2920.
- The 2920 resistance also confluences closely with the 61.8% Fibonacci retracement of the on-going slide from 01 May 2019 all-time high to 09 May 2019 low of 2835
- Medium-term momentum remains negative as the daily RSI oscillator remains below 50 and still has room to manoeuvre to the downside before it reaches an extreme oversold level of 25.
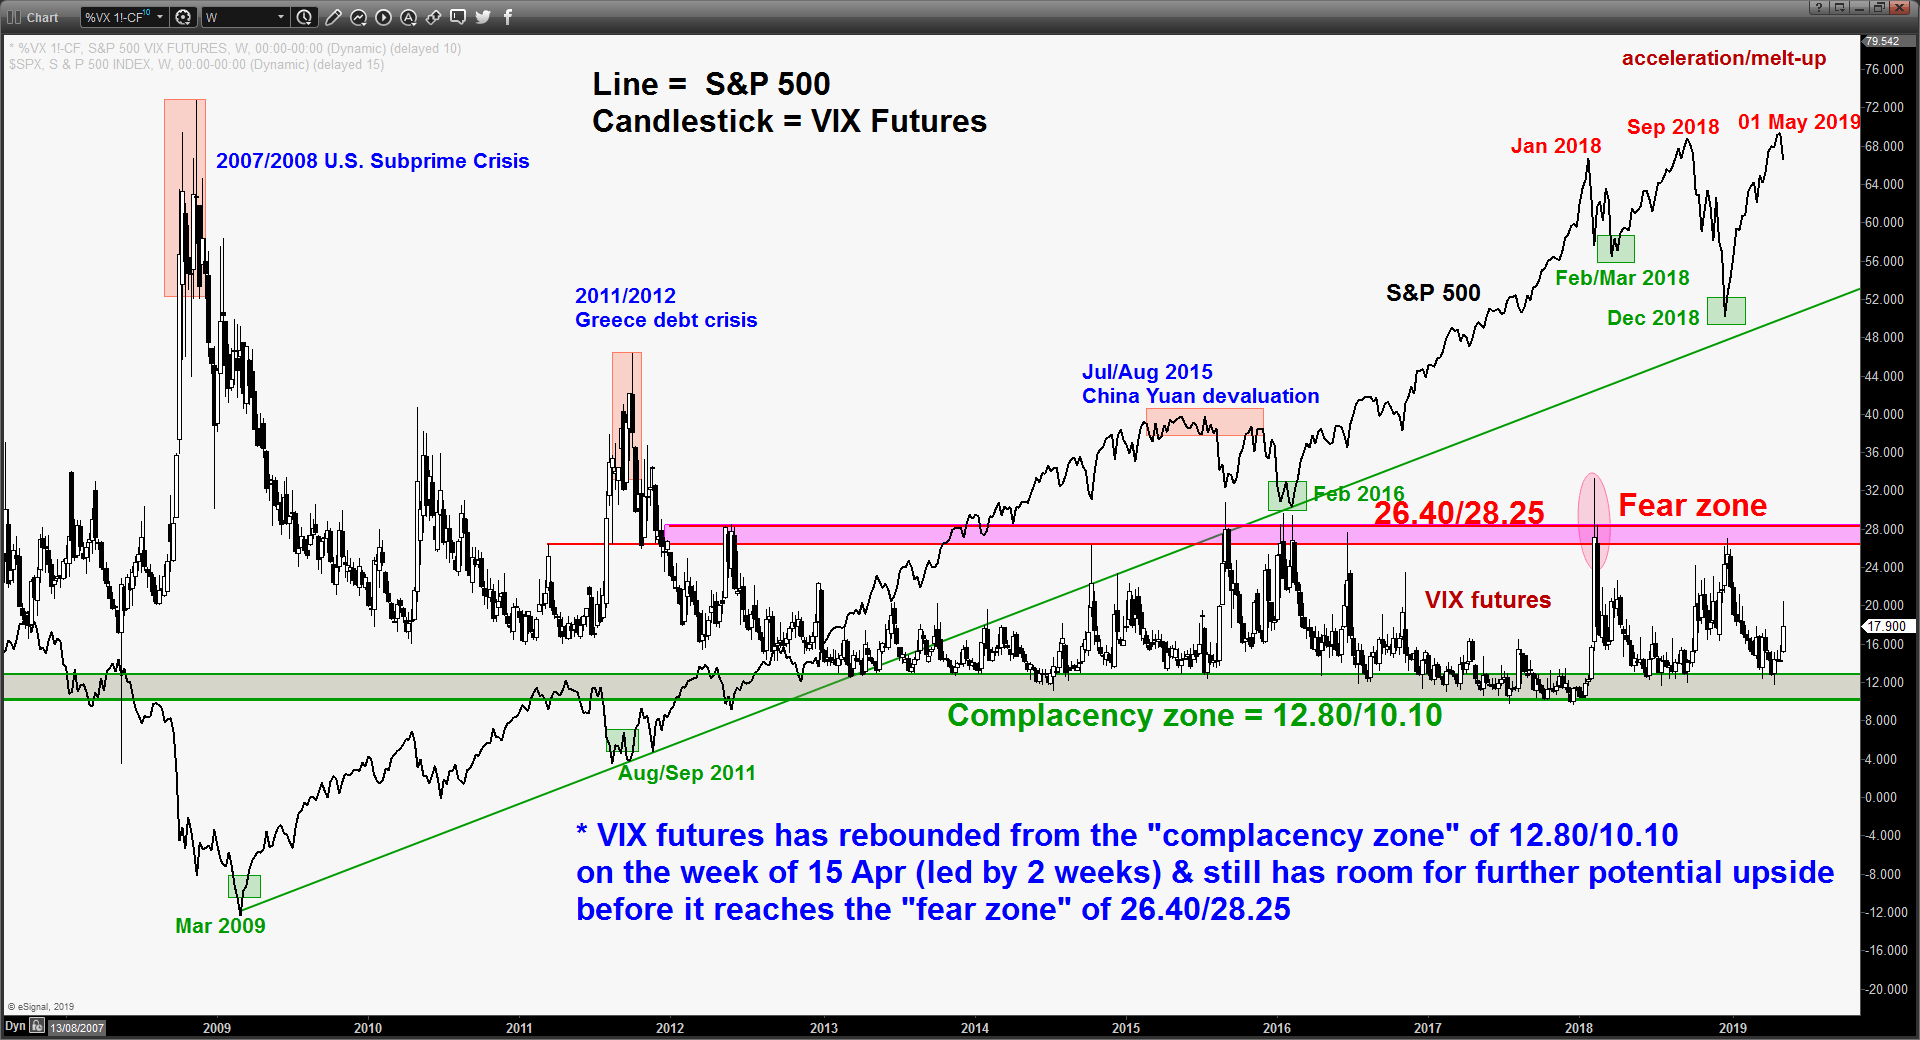
- The VIX futures has continue to incher this week after it tested the “complacency zone of 12.80/10.10 on 15 Apr 2019. It has room for further potential upside before it reaches the “fear zone” of 26.40/28.25 which translates to further downside potential in the S&P 500 before the bears capitulate.
Therefore, we maintain the bearish bias below a tightened key medium-term pivotal resistance at 2920 for another round of potential impulsive downleg to target the next supports at 2790 and 2730.
On the other hand, a clearance with a daily close above 2920 invalidates the bearish scenario for a continuation of the 5-month uptrend to retest its current all-time high at 2959 and even 3007 next (Fibonacci expansion).
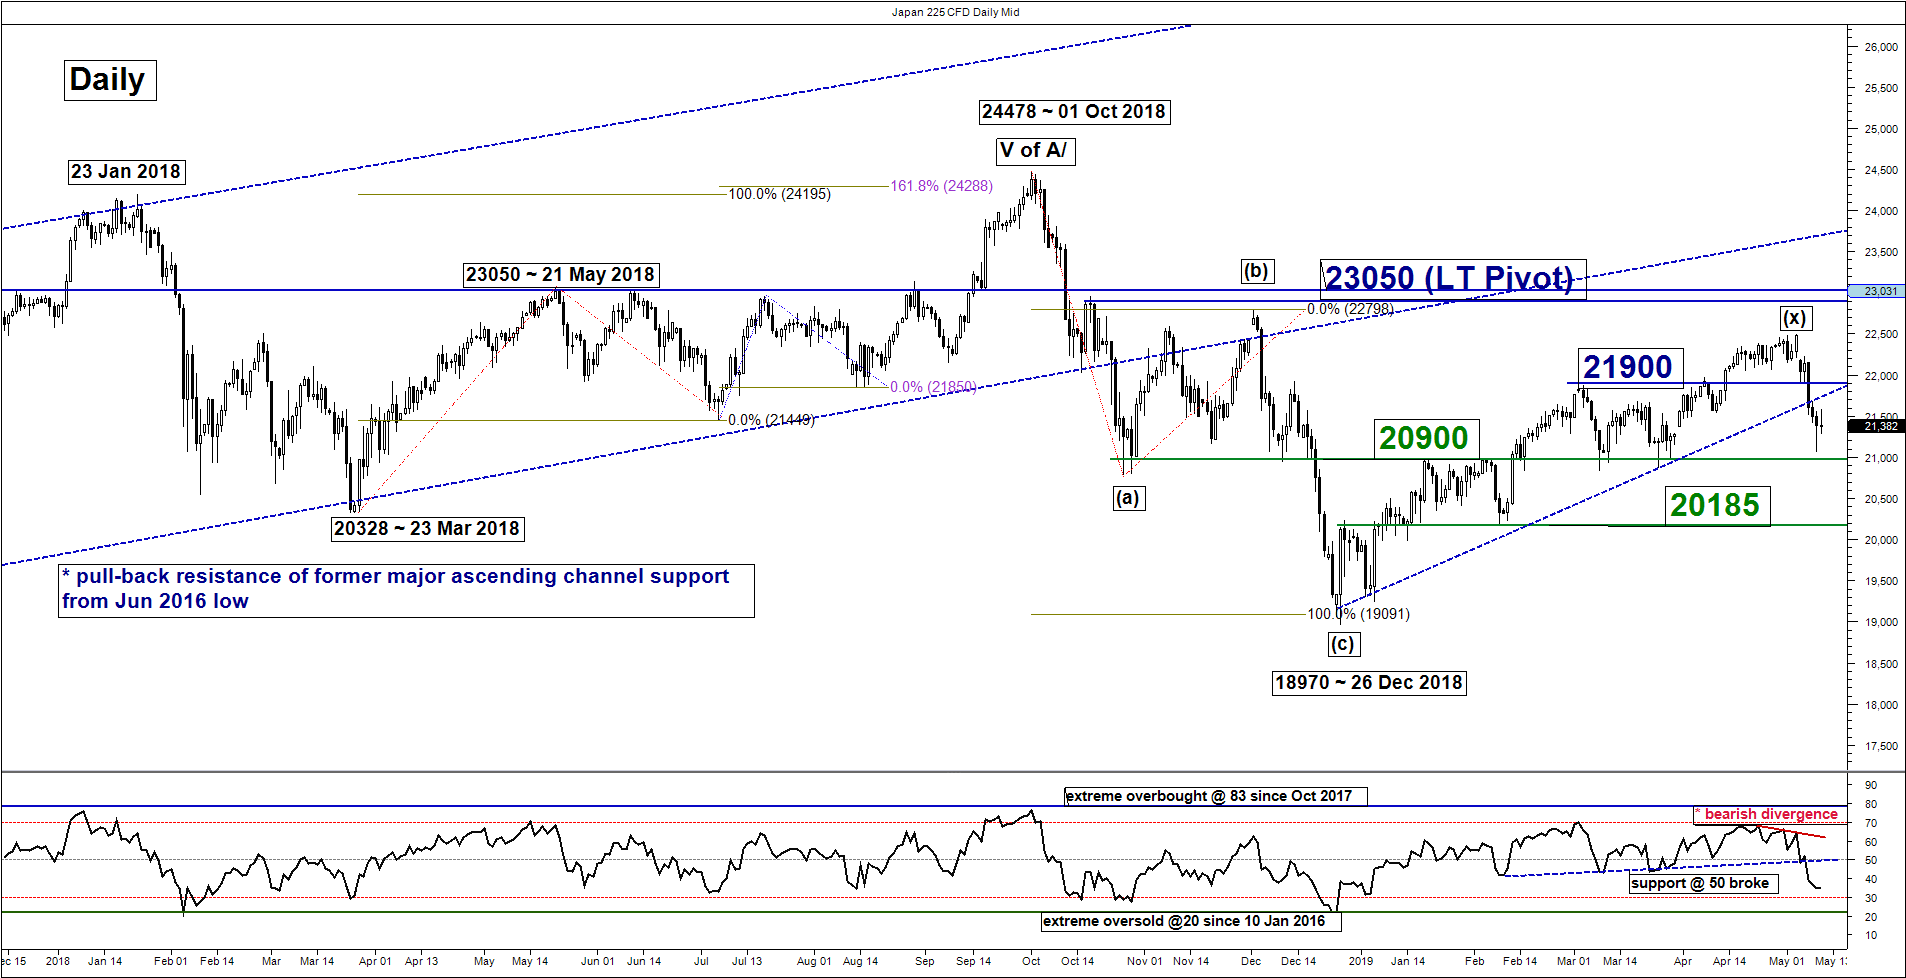
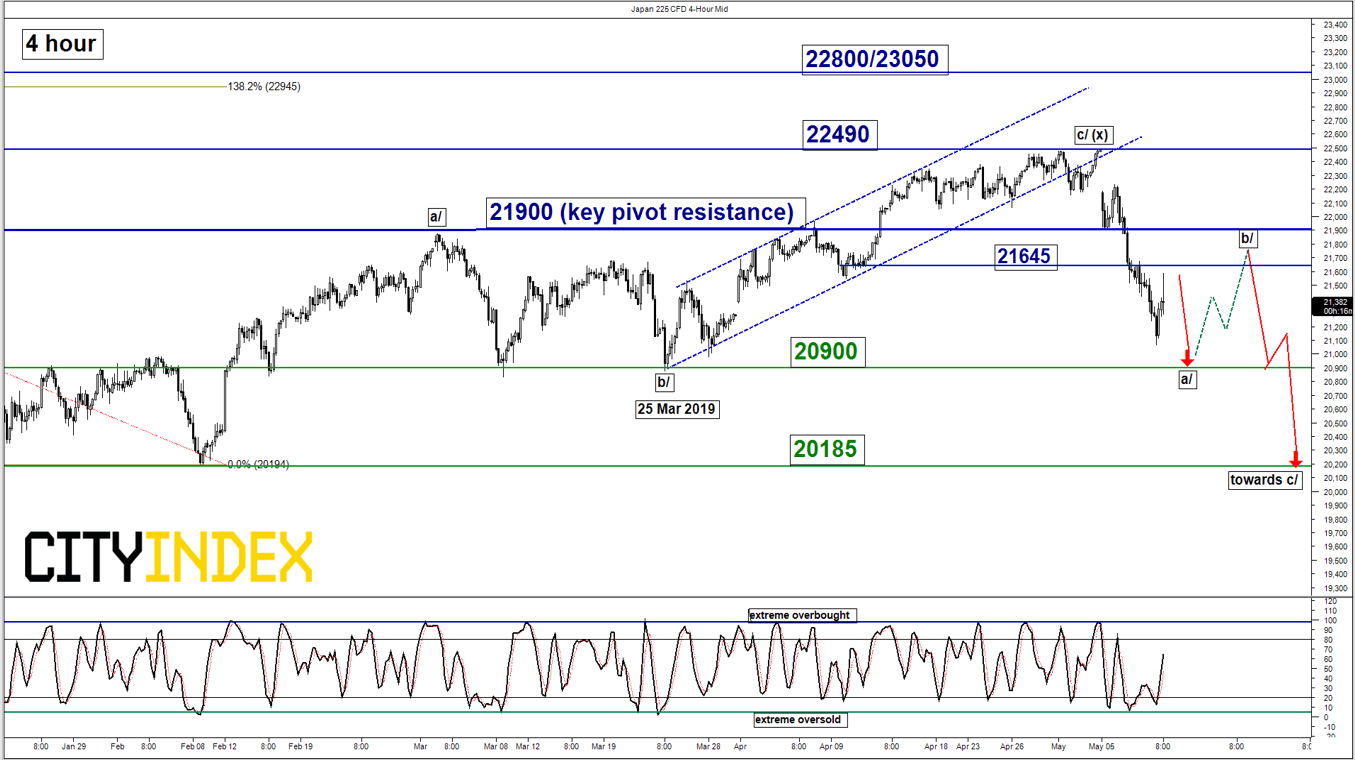
Nikkei 225 – Bearish breakdown below 21880/900
click to enlarge charts
Key Levels (1 to 3 weeks)
Intermediate resistance: 21645
Pivot (key resistance): 21900
Supports: 20900 & 20185
Next resistances: 22490 & 22800/23050
Medium-term (1 to 3 weeks) Outlook
The Japan 225 Index (proxy for the Nikkei 225 futures) has staged the bearish breakdown below the 21880 lower limit of the neutrality zone on Tues, 07 May U.S. session as per highlighted in our previous report. Thus, a multi-week corrective down move scenario has been validated.
Technical elements remain negative and the key medium-term pivotal resistance to watch will be at 21900 for a potential down move to target the next supports at 20900 before 20185.
On the other hand, a clearance with a daily close above 21900 invalidates the bearish scenario for a squeeze up towards 22490 and 22800/23050.
Charts are from City Index Advantage TraderPro & eSignal
StoneX Financial Ltd (trading as “City Index”) is an execution-only service provider. This material, whether or not it states any opinions, is for general information purposes only and it does not take into account your personal circumstances or objectives. This material has been prepared using the thoughts and opinions of the author and these may change. However, City Index does not plan to provide further updates to any material once published and it is not under any obligation to keep this material up to date. This material is short term in nature and may only relate to facts and circumstances existing at a specific time or day. Nothing in this material is (or should be considered to be) financial, investment, legal, tax or other advice and no reliance should be placed on it.
No opinion given in this material constitutes a recommendation by City Index or the author that any particular investment, security, transaction or investment strategy is suitable for any specific person. The material has not been prepared in accordance with legal requirements designed to promote the independence of investment research. Although City Index is not specifically prevented from dealing before providing this material, City Index does not seek to take advantage of the material prior to its dissemination. This material is not intended for distribution to, or use by, any person in any country or jurisdiction where such distribution or use would be contrary to local law or regulation.
For further details see our full non-independent research disclaimer and quarterly summary.
CFDs are complex instruments and come with a high risk of losing money rapidly due to leverage. 69% of retail investor accounts lose money when trading CFDs with this provider. You should consider whether you understand how CFDs work and whether you can afford to take the high risk of losing your money. CFD and Forex Trading are leveraged products and your capital is at risk. They may not be suitable for everyone. Please ensure you fully understand the risks involved by reading our full risk warning.
City Index is a trading name of StoneX Financial Ltd. Head and Registered Office: 1st Floor, Moor House, 120 London Wall, London, EC2Y 5ET. StoneX Financial Ltd is a company registered in England and Wales, number: 05616586. Authorised and regulated by the Financial Conduct Authority. FCA Register Number: 446717.
City Index is a trademark of StoneX Financial Ltd.
The information on this website is not targeted at the general public of any particular country. It is not intended for distribution to residents in any country where such distribution or use would contravene any local law or regulatory requirement.
© City Index 2024