Weekly COT Report Gold Bugs Retreat Just Off Record Highs
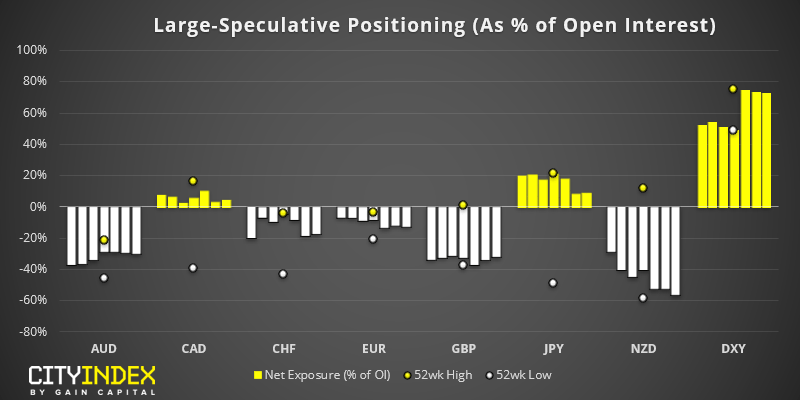
As of Tuesday 1st October:
- Bullish exposure on the USD was at $17.5 billion ($20.5 billion against G10 FX)
- Overall, only minor adjustments were made to FX majors on a weekly basis
- Net-long exposure to the USD index (DXY) hit a 2.5 year high
- Net-short exposure nudged its way to a fresh record high, although fuelled by a close of longs and shorts
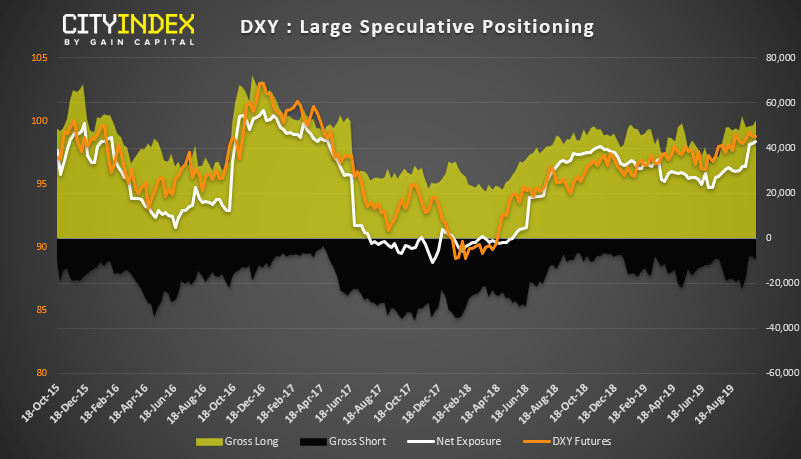
DXY: By Tuesday’s close, net-long exposure to DXY was its highest in 2.5 years. It’s 1-year Z-score was over +2 standard deviations foe the first time in 12 months. There were also 5.5 long contracts to every short, although this ratio actually peaked at 6.3 two weeks prior. However, this marketed the swing high and DXY has since retraced from its peak, so these metrics will be a little less stretched. From a price action perspective, DXY remain within a bullish channel and the its structure remains bullish above 98.6 so whilst this level holds, we favour a break to new highs.
As of Tuesday 1st October:
- Net-long exposure to gold was reduced by -11.6%
- Platinum traders reduced net-long exposure by 10.5%
- Bullish exposure to palladium hit a 3-month high
Gold: Gold bulls closed 47.6k long contracts last week, their largest weekly reduction since December 2017. This saw net-long exposure drop by 11.6%. Incidentally, the report (which was compiled on 1st October) marked the swing low on Gold. It’s also worth noting that net-long exposure was near record highs ahead of the bullish reduction. (The record high was in 2016). Whilst we’ve observed stretched positioning and warned of a potential inflection point, geopolitical tensions and weak economic data has proven too difficult to build a bear case for the yellow metal. But if those supportive features were to be removed, it then opens up the potential for a deeper correction. For now, gold could remain stubbornly near its highs and trade within a range.
Palladium: Traders have remained net-long on palladium since 2003. However, whilst prices remain at record highs, net-long exposure isn’t flagging a sentiment extreme with 1 and 3-year Z-score at +1.3 and -0.2 standard deviations respectively. Until price action suggests otherwise, palladium appears favourable to trend traders (or those seeking to buy dips).
StoneX Financial Ltd (trading as “City Index”) is an execution-only service provider. This material, whether or not it states any opinions, is for general information purposes only and it does not take into account your personal circumstances or objectives. This material has been prepared using the thoughts and opinions of the author and these may change. However, City Index does not plan to provide further updates to any material once published and it is not under any obligation to keep this material up to date. This material is short term in nature and may only relate to facts and circumstances existing at a specific time or day. Nothing in this material is (or should be considered to be) financial, investment, legal, tax or other advice and no reliance should be placed on it.
No opinion given in this material constitutes a recommendation by City Index or the author that any particular investment, security, transaction or investment strategy is suitable for any specific person. The material has not been prepared in accordance with legal requirements designed to promote the independence of investment research. Although City Index is not specifically prevented from dealing before providing this material, City Index does not seek to take advantage of the material prior to its dissemination. This material is not intended for distribution to, or use by, any person in any country or jurisdiction where such distribution or use would be contrary to local law or regulation.
For further details see our full non-independent research disclaimer and quarterly summary.
CFDs are complex instruments and come with a high risk of losing money rapidly due to leverage. 69% of retail investor accounts lose money when trading CFDs with this provider. You should consider whether you understand how CFDs work and whether you can afford to take the high risk of losing your money. CFD and Forex Trading are leveraged products and your capital is at risk. They may not be suitable for everyone. Please ensure you fully understand the risks involved by reading our full risk warning.
City Index is a trading name of StoneX Financial Ltd. Head and Registered Office: 1st Floor, Moor House, 120 London Wall, London, EC2Y 5ET. StoneX Financial Ltd is a company registered in England and Wales, number: 05616586. Authorised and regulated by the Financial Conduct Authority. FCA Register Number: 446717.
City Index is a trademark of StoneX Financial Ltd.
The information on this website is not targeted at the general public of any particular country. It is not intended for distribution to residents in any country where such distribution or use would contravene any local law or regulatory requirement.
© City Index 2024