USDCNH may spook risk assets again
The last key event for this week will be Fed Chair Powell’s speech on Fri, 23 Aug during the Jackson Hole Symposium at 1400 GMT where market participants will look for clues on the latest Fed’s guidance towards its monetary policy.
There is another significant “theatrical play” that is unfolding in the financial markets right now is the movement of USD/CNH (offshore yuan) that is creeping up slowly from its 13 Aug 2019 low of 6.9900. Recall what happen on 05 Aug 2019? On that fateful day, the China central bank, PBOC has allowed the USD/CNH to breach above the key psychological level of 7.00 to counter the latest 10% U.S. tariffs imposed on China’s products that has led to a domino effect on global risk assets where we have witnessed a synchronised sell-off in stocks (click here for a recap on our previous report).
Right now, technical elements are turning positive again for USD/CNH.
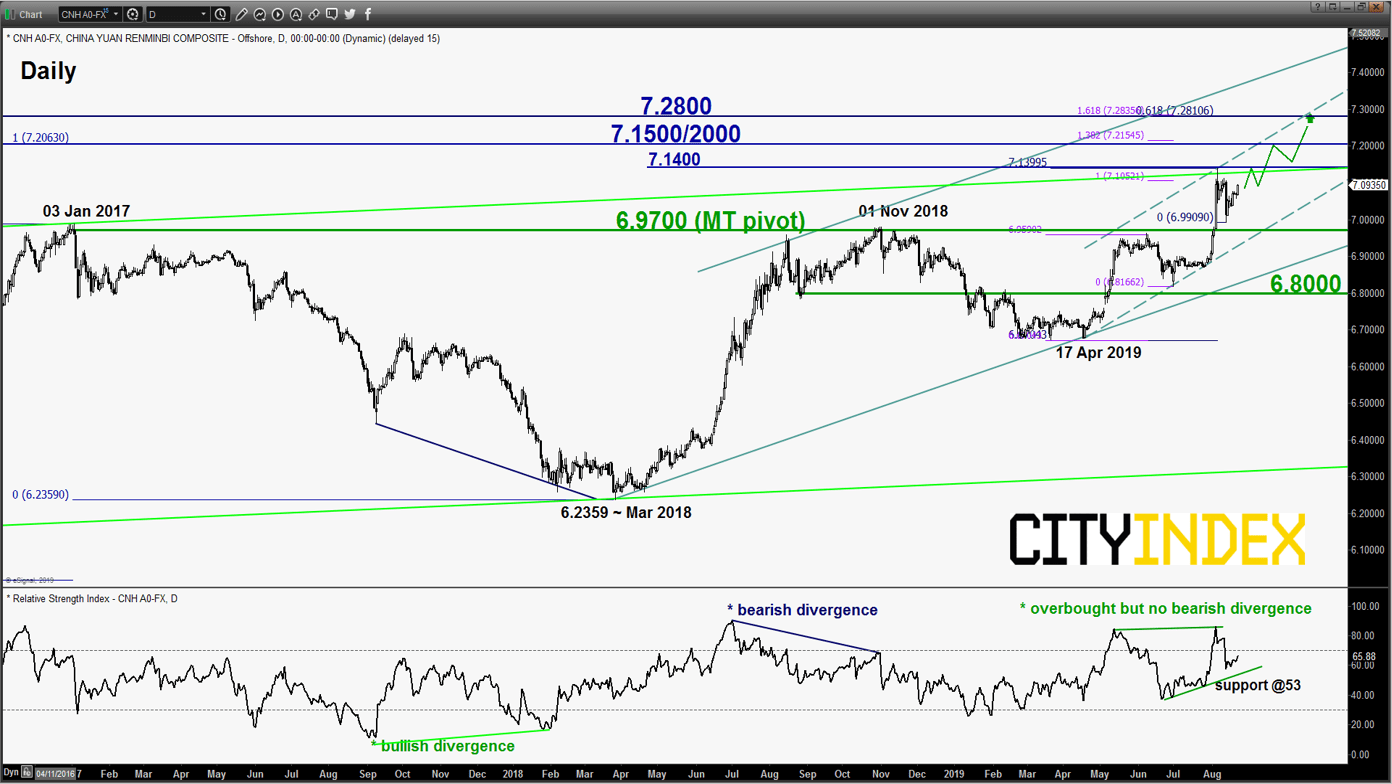
USD/CNH – Upside momentum has resurfaced
click to enlarge chart
Key Levels (1 to 3 months)
Pivot (key support): 6.9700
Resistances: 7.1500/2000 & 7.2800
Next support: 6.8000
Directional Bias (1 to 3 months)
Bullish bias as the recent 2-weeks of corrective decline sequence in place since 06 Aug 2019 high area of 7.15 may have ended. If the 6.9700 key medium-term pivotal support holds, USD/CNH is likely to resume another round of potential impulsive upleg sequence to target the next resistance at 7.1500/2000 follow by 7.2800 next. On the other hand, a break with a daily close below 6.9700 invalidates the bullish scenario for a deeper corrective decline towards the next support at 6.8000 (also close to the primary ascending channel support in place since Mar 2018 low).
Key elements
- There is no bearish divergence seen in the daily RSI oscillator even though it has hit an overbought condition on 05 Aug 2019 versus a prior bearish divergence signal that has formed in 30 Oct 2018 that led to a significant decline in the price action of USD/CNH.
- The above-mentioned observations on the daily RSI suggest that medium-term upside momentum has resurfaced for USD/CNH.
- The significant medium-term resistances stand at 7.1500/2000 and 7.2800 which are defined by the upper boundary of the medium-term ascending channel in place since 17 Apr 2019 low and Fibonacci expansion clusters.
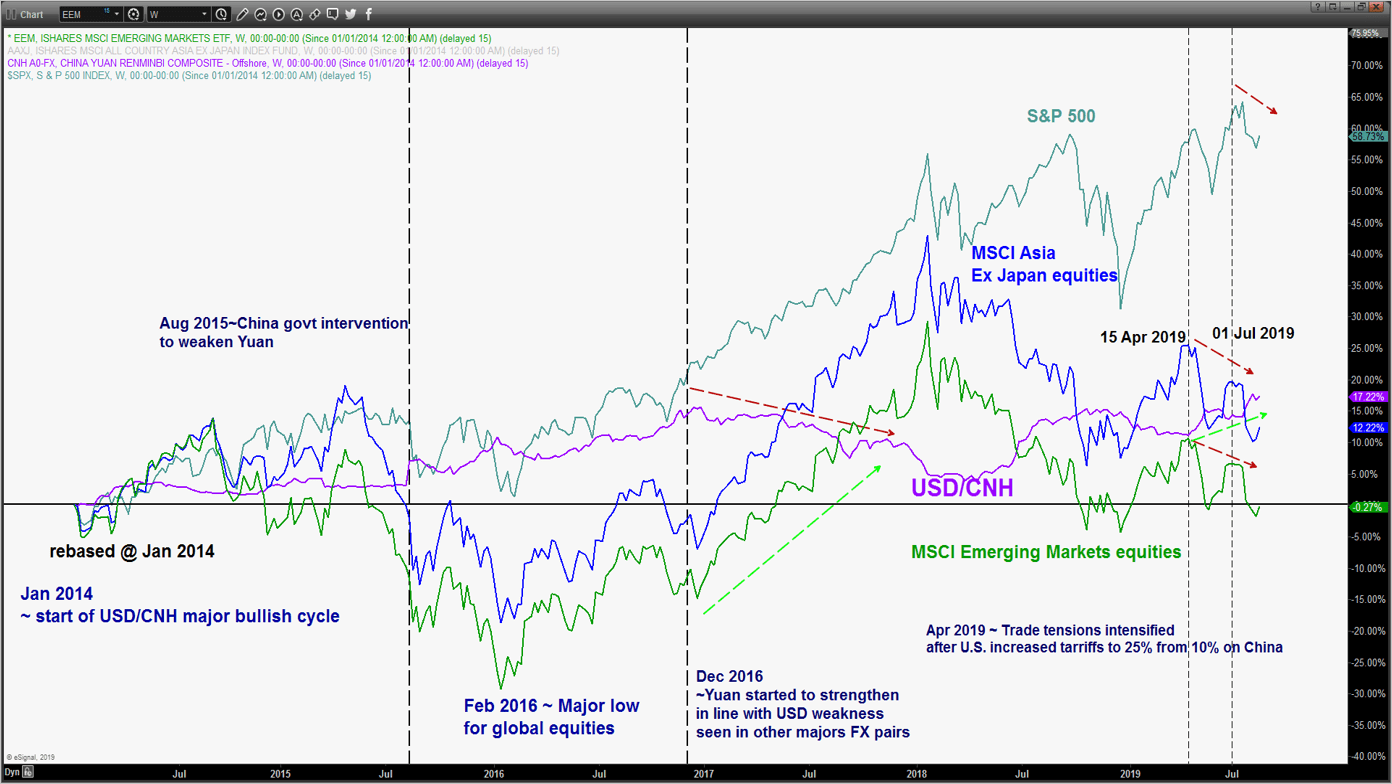
A strong USD/CNH is not good for Asia ex Japan & emerging markets equities and even S&P 500
click to enlarge chart
- Since the shock devaluation of the Chinese Yuan in Aug 2015, the movement of the USD/CNH has a significant negative correlation with the MSCI Asia Ex Japan and MSCI Emerging markets stock indices. Based on past observations, a rally in USD/CNH tends to lead to an opposite movement (a decline) in the MSCI Asia Ex Japan and MSCI Emerging markets stock indices. On the reverse, a decline in USD/CNH is likely to see an upward movement in the MSCI Asia Ex Japan and MSCI Emerging markets stock indices.
- Since Apr 2019, the USD/CNH has been on a “slow upward” trajectory which has added downside pressure in Asia Ex Japan and Emerging Markets equities.
- The S&P 500 has started to catch the “flu bug” from a strong USD/CNH. Since its all-time high printed in July 2019, the Index has declined in line with an upward movement seen in the USD/CNH.
Therefore, stock traders should start to pay very close attention to the movement of USD/CNH at this juncture.
Charts are from eSignal
StoneX Financial Ltd (trading as “City Index”) is an execution-only service provider. This material, whether or not it states any opinions, is for general information purposes only and it does not take into account your personal circumstances or objectives. This material has been prepared using the thoughts and opinions of the author and these may change. However, City Index does not plan to provide further updates to any material once published and it is not under any obligation to keep this material up to date. This material is short term in nature and may only relate to facts and circumstances existing at a specific time or day. Nothing in this material is (or should be considered to be) financial, investment, legal, tax or other advice and no reliance should be placed on it.
No opinion given in this material constitutes a recommendation by City Index or the author that any particular investment, security, transaction or investment strategy is suitable for any specific person. The material has not been prepared in accordance with legal requirements designed to promote the independence of investment research. Although City Index is not specifically prevented from dealing before providing this material, City Index does not seek to take advantage of the material prior to its dissemination. This material is not intended for distribution to, or use by, any person in any country or jurisdiction where such distribution or use would be contrary to local law or regulation.
For further details see our full non-independent research disclaimer and quarterly summary.
CFDs are complex instruments and come with a high risk of losing money rapidly due to leverage. 69% of retail investor accounts lose money when trading CFDs with this provider. You should consider whether you understand how CFDs work and whether you can afford to take the high risk of losing your money. CFD and Forex Trading are leveraged products and your capital is at risk. They may not be suitable for everyone. Please ensure you fully understand the risks involved by reading our full risk warning.
City Index is a trading name of StoneX Financial Ltd. Head and Registered Office: 1st Floor, Moor House, 120 London Wall, London, EC2Y 5ET. StoneX Financial Ltd is a company registered in England and Wales, number: 05616586. Authorised and regulated by the Financial Conduct Authority. FCA Register Number: 446717.
City Index is a trademark of StoneX Financial Ltd.
The information on this website is not targeted at the general public of any particular country. It is not intended for distribution to residents in any country where such distribution or use would contravene any local law or regulatory requirement.
© City Index 2024