USD significant breakout looks imminent
The dollar remains in a strong bullish trend due to growing speculation over a September or December Federal Reserve rate hike, which would be the first in nine years, and dovish central banks elsewhere.
Indeed, the Fed’s Lockhart has given the clearest signal yet that he would vote to hike interest rates in September; only a significant deterioration in the data would convince him to think otherwise. Today’s mixed US economic numbers are unlikely to change his view.
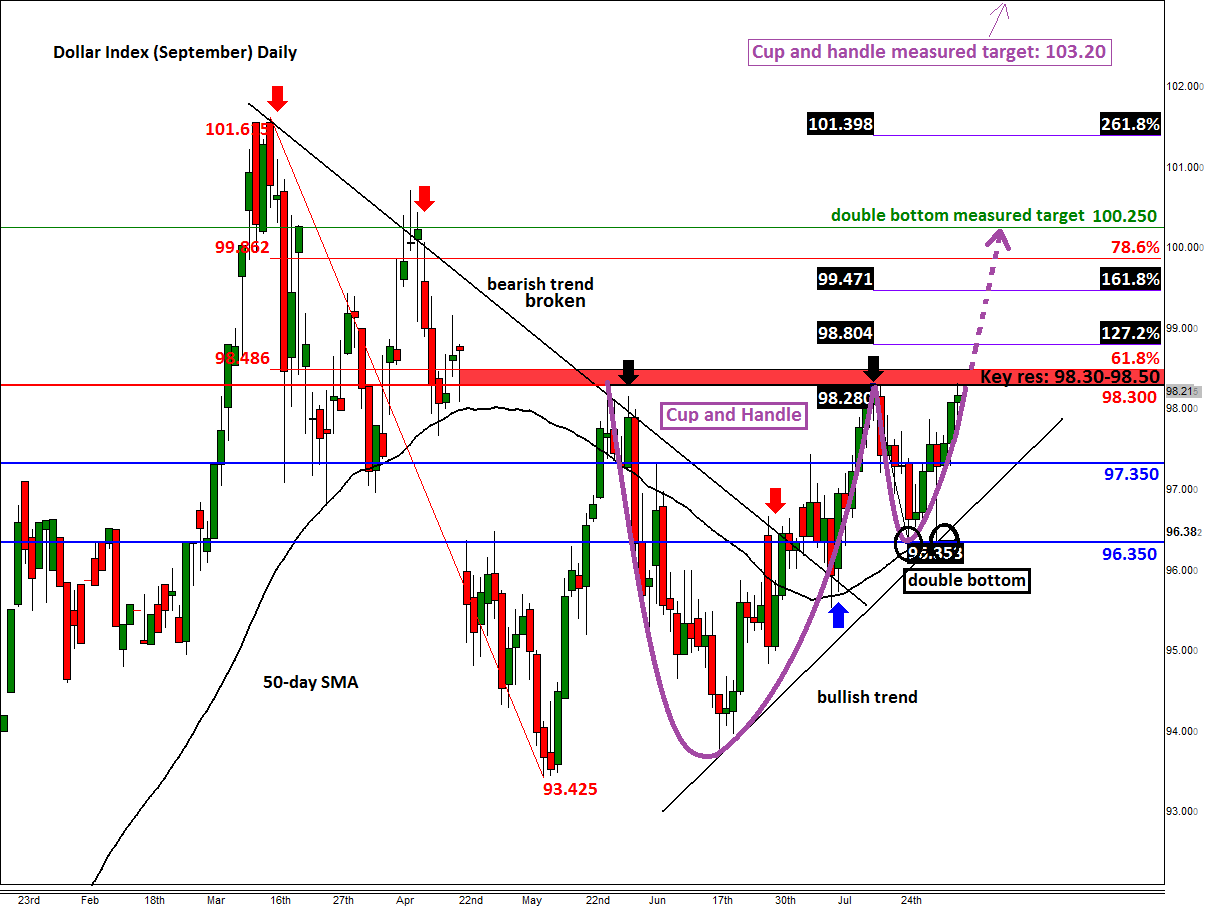
If the USD continues to respond favourably to the US macro numbers then a breakout could be on for several USD pairs, such as the USD/JPY above 124.50 and EUR/USD below 1.0820. The dollar index meanwhile is also on the verge of a breakout. As can be seen from the chart, the index has already broken above a bearish trend line and is holding comfortably above its 50-day moving average. More importantly, it has formed a double bottom reversal pattern at 96.35 and is inside a larger Cup and Handle continuation pattern. Even more importantly, it looks like it wants to break higher now as it is currently testing the key resistance area of 98.30-98.50.
The lower end of the abovementioned range is the horizontal resistance level that has provided a ceiling to prices for a good three months, while the upper end corresponds with the 61.8% Fibonacci retracement level of the downswing from the March peak. Therefore a decisive break above this range could lead to a significant rally. For short-term traders, the Fibonacci extension levels at 98.80 (127.2%) and 99.45 (161.8%) would be highly relevant. But the potential rally could extend beyond these levels over time, possibly towards 99.85 (78.6% retracement of the larger downswing) and 101.40 (261.8% extension of the short-term swing).
Meanwhile the measured double bottom target is 25 pips above the psychologically-important level of 100, at 100.25, while the target for the Cup and Handle is all the way up at 103.20. To get to these levels will need to see some solid US numbers now.
The key support levels level to watch are at 97.35 and then 100 pips lower at 96.35 – a potential break below the latter would be a very bearish outcome. A bullish trend line also goes through these levels.
StoneX Financial Ltd (trading as “City Index”) is an execution-only service provider. This material, whether or not it states any opinions, is for general information purposes only and it does not take into account your personal circumstances or objectives. This material has been prepared using the thoughts and opinions of the author and these may change. However, City Index does not plan to provide further updates to any material once published and it is not under any obligation to keep this material up to date. This material is short term in nature and may only relate to facts and circumstances existing at a specific time or day. Nothing in this material is (or should be considered to be) financial, investment, legal, tax or other advice and no reliance should be placed on it.
No opinion given in this material constitutes a recommendation by City Index or the author that any particular investment, security, transaction or investment strategy is suitable for any specific person. The material has not been prepared in accordance with legal requirements designed to promote the independence of investment research. Although City Index is not specifically prevented from dealing before providing this material, City Index does not seek to take advantage of the material prior to its dissemination. This material is not intended for distribution to, or use by, any person in any country or jurisdiction where such distribution or use would be contrary to local law or regulation.
For further details see our full non-independent research disclaimer and quarterly summary.
CFDs are complex instruments and come with a high risk of losing money rapidly due to leverage. 69% of retail investor accounts lose money when trading CFDs with this provider. You should consider whether you understand how CFDs work and whether you can afford to take the high risk of losing your money. CFD and Forex Trading are leveraged products and your capital is at risk. They may not be suitable for everyone. Please ensure you fully understand the risks involved by reading our full risk warning.
City Index is a trading name of StoneX Financial Ltd. Head and Registered Office: 1st Floor, Moor House, 120 London Wall, London, EC2Y 5ET. StoneX Financial Ltd is a company registered in England and Wales, number: 05616586. Authorised and regulated by the Financial Conduct Authority. FCA Register Number: 446717.
City Index is a trademark of StoneX Financial Ltd.
The information on this website is not targeted at the general public of any particular country. It is not intended for distribution to residents in any country where such distribution or use would contravene any local law or regulatory requirement.
© City Index 2024