USD JPY What next for the beleaguered pair
This week’s key central bank meetings have come to pass. The US Federal Reserve, the Reserve Bank of New Zealand and the Bank of Japan all decided to leave their monetary policy stances unchanged, so you would have thought that the markets would not have reacted much. Well, in the case of the Fed and the dollar, you would have probably been correct since virtually no one was expecting a rate rise at this week’s meeting. The RBNZ’s decision to leave policy unchanged surprised a few people and the New Zealand dollar rallied sharply. But it was just a drop in the ocean compared to how much the yen rallied in the aftermath of the BOJ’s meeting. The latter was expected to ease its policy, especially after fresh data showed the Japanese economy fell into deflation. Not only did it refuse to do that but there wasn’t even the slightest signal of further easing. The markets have punished the BOJ by aggressively bidding up the yen.
It remains to be seen for how much longer the BOJ will be able and willing to tolerate this pain. But it may get a helping hand in the form of a stronger performance from the dollar, should the first quarter US GDP somehow beat expectations later on or next week’s employment figures surprise to the upside. In any event, the BOJ is ready to act if the situation deteriorates further, so watch out for that possibility.
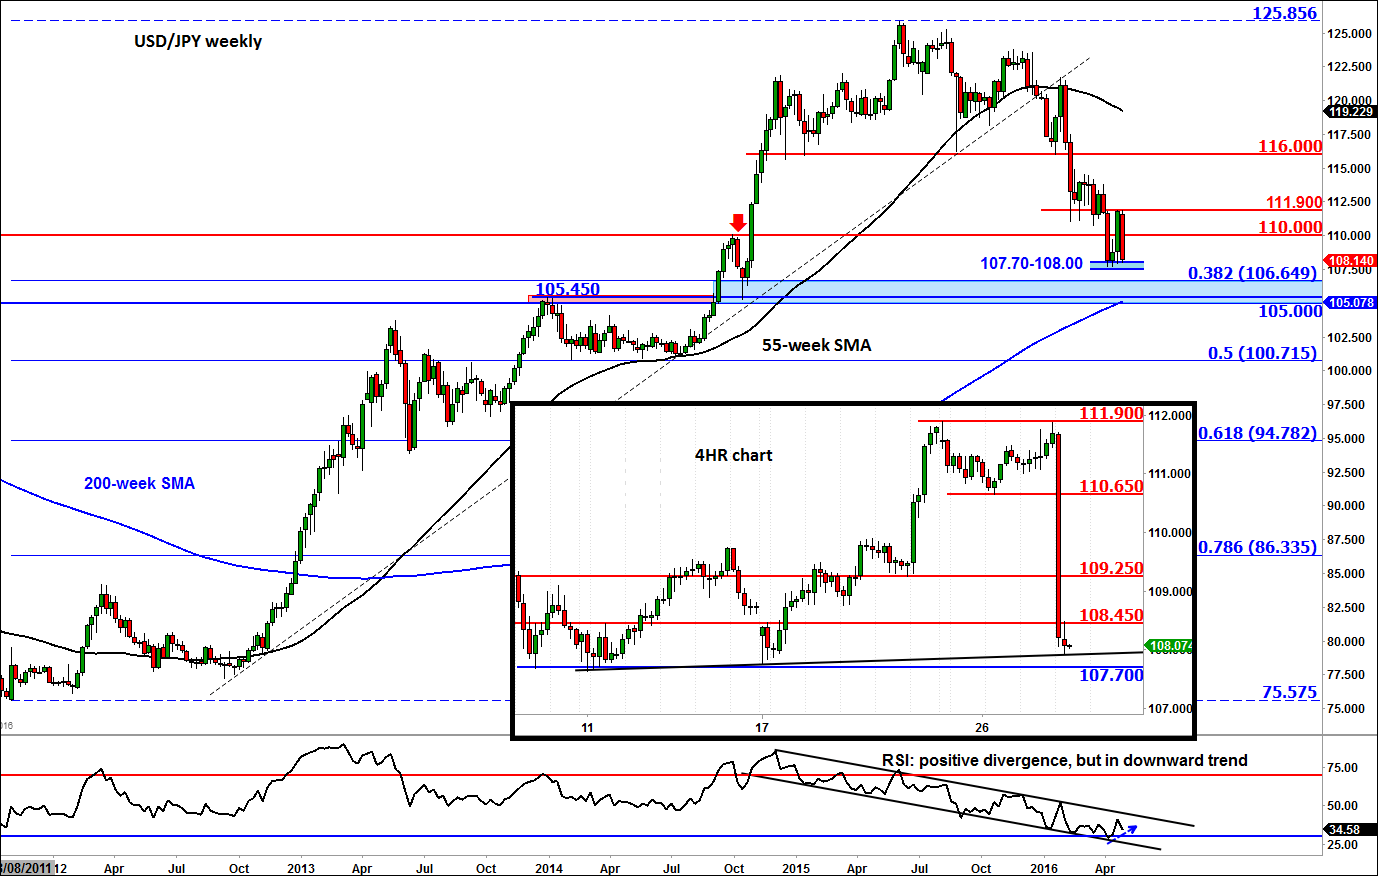
From a technical point of view, the USD/JPY charts look unsurprisingly bearish and understandably “oversold” in the short term. So we may see a small short-covering bounce before the selling resumes in the coming days or weeks. In fact, the weekly chart of the USD/JPY, below, shows an uncompleted bearish engulfing candle below 110, which could complete unless US data over the next day and a half massively overshoot expectations. The engulfing candle, if completed, would paint a bleak outlook for the start of next week.
But at the time of this writing, the USD/JPY was testing the key 107.70/108.00 area after falling a massive 400 pips from near 11.90, where it may have formed a short-term double top pattern as per the 4-hour chart in the inset – the neckline of this reversal formation being at the 107.70/108.00 range. So a small rebound here should not come as a massive surprise, especially since this area marks the low from the prior three weeks. But if this support area (eventually) breaks down decisively then the USD/JPY’s downward trend may accelerate towards the support zone shaded in light blue on the chart. This area is comprised of:
- 106.65: long-term (shallow) 38.2% Fibonacci retracement level
- 105.45: previous key resistance level, which could turn into support upon re-test
- 105.10: the (still-rising) 200-week moving average
- 105.00: a psychological level
As noted, there are a number of technical factors converging in the 105.00-106.65 area, so the USD/JPY could rebound or even form a long-term base should we get there. Conversely, if this key support range also gives way then a more significant correction could be on the way, perhaps towards 100 or even lower.
Meanwhile some of the short-term resistance levels are shown on the 4-hour chart in the inset. The most important of these resistance levels are at 109.25, 110.00 and 110.65. A potential break above the double top level of 111.90 would invalidate the near-term bearish bias, in which case a rally towards the next key reference point of 116.00 could then become a good possibility.
StoneX Financial Ltd (trading as “City Index”) is an execution-only service provider. This material, whether or not it states any opinions, is for general information purposes only and it does not take into account your personal circumstances or objectives. This material has been prepared using the thoughts and opinions of the author and these may change. However, City Index does not plan to provide further updates to any material once published and it is not under any obligation to keep this material up to date. This material is short term in nature and may only relate to facts and circumstances existing at a specific time or day. Nothing in this material is (or should be considered to be) financial, investment, legal, tax or other advice and no reliance should be placed on it.
No opinion given in this material constitutes a recommendation by City Index or the author that any particular investment, security, transaction or investment strategy is suitable for any specific person. The material has not been prepared in accordance with legal requirements designed to promote the independence of investment research. Although City Index is not specifically prevented from dealing before providing this material, City Index does not seek to take advantage of the material prior to its dissemination. This material is not intended for distribution to, or use by, any person in any country or jurisdiction where such distribution or use would be contrary to local law or regulation.
For further details see our full non-independent research disclaimer and quarterly summary.
CFDs are complex instruments and come with a high risk of losing money rapidly due to leverage. 69% of retail investor accounts lose money when trading CFDs with this provider. You should consider whether you understand how CFDs work and whether you can afford to take the high risk of losing your money. CFD and Forex Trading are leveraged products and your capital is at risk. They may not be suitable for everyone. Please ensure you fully understand the risks involved by reading our full risk warning.
City Index is a trading name of StoneX Financial Ltd. Head and Registered Office: 1st Floor, Moor House, 120 London Wall, London, EC2Y 5ET. StoneX Financial Ltd is a company registered in England and Wales, number: 05616586. Authorised and regulated by the Financial Conduct Authority. FCA Register Number: 446717.
City Index is a trademark of StoneX Financial Ltd.
The information on this website is not targeted at the general public of any particular country. It is not intended for distribution to residents in any country where such distribution or use would contravene any local law or regulatory requirement.
© City Index 2024