USD JPY Stocks plunge as gold yen rally in 8220 risk off 8221 trade
The signs were there for a stock market plunge, which is exactly what has happened today. Gold, a perceived safe-haven asset, had been rising strongly of late despite the dollar’s strength and the equity market rally. The Japanese yen, likewise another safe haven asset, has been firm and today it has got firmer. It looks like the equity market has finally got in sync with these markets. Indeed, risk was clearly off the menu at the time of this writing, with the FTSE and DAX indices trading near their lows and US index futures were pointing to a sharply lower open on Wall Street. Is this the start of the crash that many people had been waiting for? Well, that remains to be seen. In part, it depends on what Wall Street will do today. So far every dip – small or big – have been bought. But at these record high levels, there will be a lot of stop orders that had been accumulated during the melt up. I fear these stops may be tripped, triggering a sharper fall before we see a bounce.
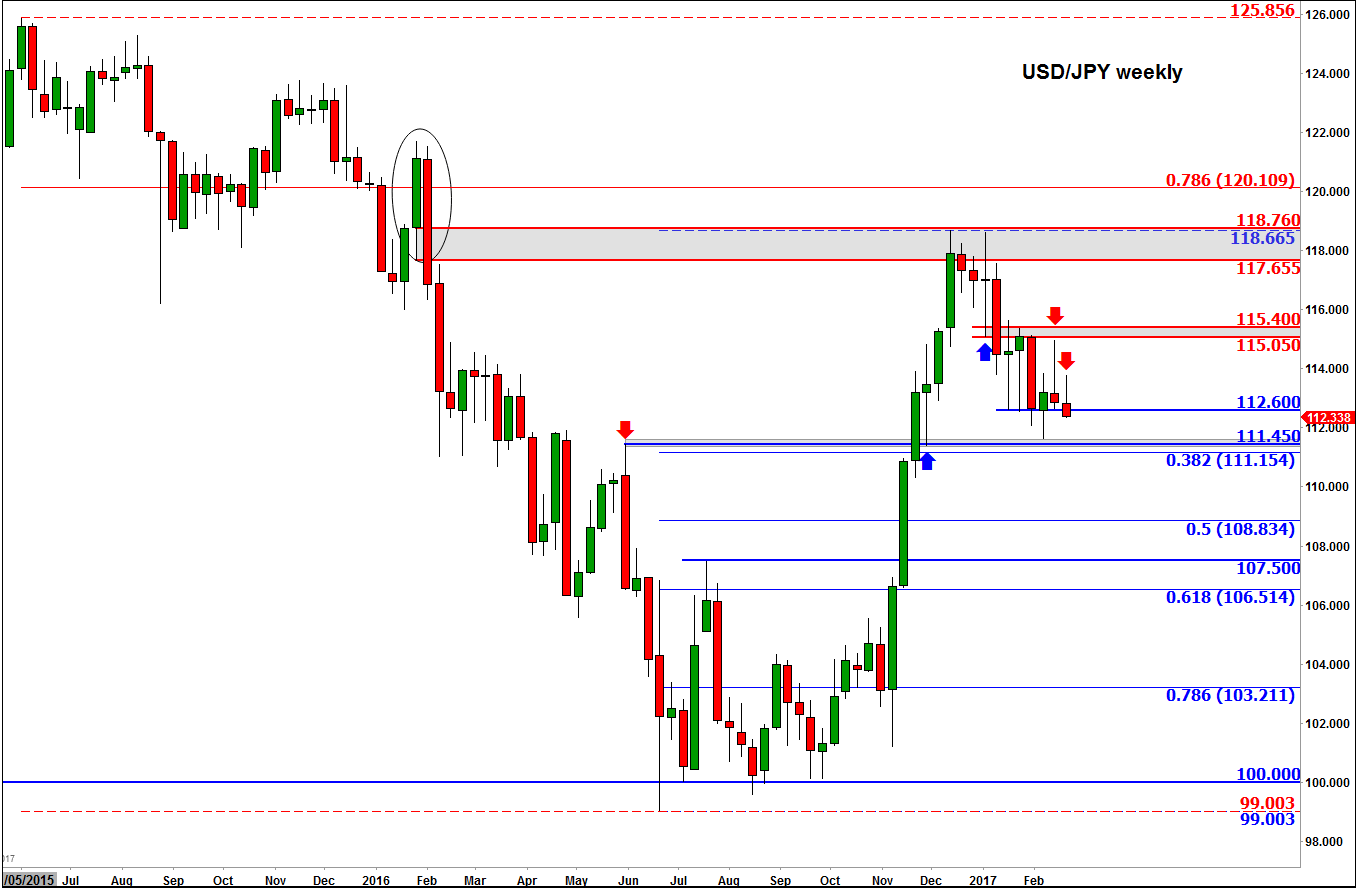
What this may mean for the USD/JPY is that we could see further declines if the sentiment does not improve quickly. Indeed, the weekly chart of the USD/JPY paints a rather bearish picture. Last week it had formed and inverted hammer as the 115.00 level held as resistance again. The advance from early this week has been pushed back and this week’s candlestick – which is yet compete of course – shows another bearish pattern. If the USD/JPY closes the week below the 112.60 support level then expect to see more losses in early next week. The next key support level is around 114.50 on the weekly time frame. This level had been support and resistance in the past and it comes in just ahead of the 38.2% Fibonacci retracement level at 111.15. Below these levels, the next significant support is at 107.50 – the last high pre breakout – followed by the 61.8% Fibonacci retracement level at 106.50. On this weekly time frame, the bias would turn back bullish if and when it climbs above 115.00/40 again. Either that or we see some other bullish reversal signs first.
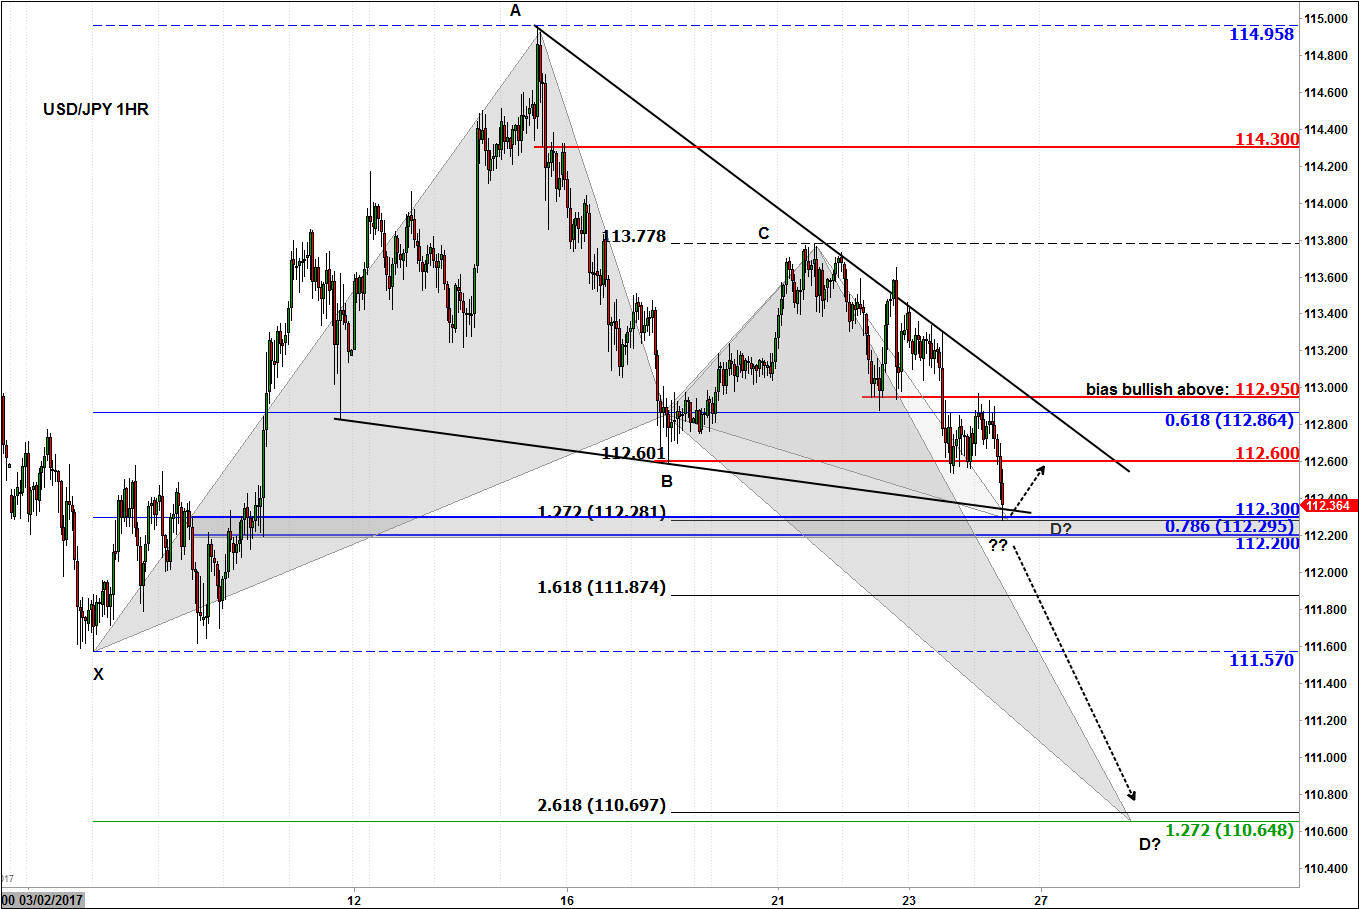
Meanwhile on the short-term time frame, there is a possibility we may see a bounce at 112.20/30 area, which was being tested at the time of this writing. As can be seen on the hourly chart, in figure 2, this is where horizontal support meets two Fibonacci levels – the 78.6% retracement of the XA swing and 127.2% extension of the BC swing. This area therefore markets the point D of a bullish Gartley pattern. Given the higher time frame bearish view, the bulls would do very well to hold their ground here at 112.20/30. We could nonetheless see a bounce here, to at least 112.60 resistance before the downward trend probably resumes. But if we start to move below 112.20 support then the next stop for the USD/JPY on the hourly time frame could be at the prior support level of 111.57 (i.e. point x), or lower still at 110.65/75, which is another area where two Fibonacci extension levels of the above price swings converge. This makes 110.65/75 the point D of a Bullish Butterfly pattern. So we could see a bounce should we get there, in part because of profit-taking from the shorts. Meanwhile if the 112.95 resistance level breaks then this would end the short-term bearish bias.
StoneX Financial Ltd (trading as “City Index”) is an execution-only service provider. This material, whether or not it states any opinions, is for general information purposes only and it does not take into account your personal circumstances or objectives. This material has been prepared using the thoughts and opinions of the author and these may change. However, City Index does not plan to provide further updates to any material once published and it is not under any obligation to keep this material up to date. This material is short term in nature and may only relate to facts and circumstances existing at a specific time or day. Nothing in this material is (or should be considered to be) financial, investment, legal, tax or other advice and no reliance should be placed on it.
No opinion given in this material constitutes a recommendation by City Index or the author that any particular investment, security, transaction or investment strategy is suitable for any specific person. The material has not been prepared in accordance with legal requirements designed to promote the independence of investment research. Although City Index is not specifically prevented from dealing before providing this material, City Index does not seek to take advantage of the material prior to its dissemination. This material is not intended for distribution to, or use by, any person in any country or jurisdiction where such distribution or use would be contrary to local law or regulation.
For further details see our full non-independent research disclaimer and quarterly summary.
CFDs are complex instruments and come with a high risk of losing money rapidly due to leverage. 69% of retail investor accounts lose money when trading CFDs with this provider. You should consider whether you understand how CFDs work and whether you can afford to take the high risk of losing your money. CFD and Forex Trading are leveraged products and your capital is at risk. They may not be suitable for everyone. Please ensure you fully understand the risks involved by reading our full risk warning.
City Index is a trading name of StoneX Financial Ltd. Head and Registered Office: 1st Floor, Moor House, 120 London Wall, London, EC2Y 5ET. StoneX Financial Ltd is a company registered in England and Wales, number: 05616586. Authorised and regulated by the Financial Conduct Authority. FCA Register Number: 446717.
City Index is a trademark of StoneX Financial Ltd.
The information on this website is not targeted at the general public of any particular country. It is not intended for distribution to residents in any country where such distribution or use would contravene any local law or regulatory requirement.
© City Index 2024