USD JPY set for a bounce
As the divergence in monetary policy between the US and Japan began to widen, the USD/JPY started its massive bull trend from around the year 2012 which ultimately ended in mid-2015, well before the December 2015 rate increase. During this period, the US central bank slowly started to unwind its extremely loose unconventional monetary policy, ending QE3 in late 2014, while the Japanese central bank continued to loosen its policy further in the form or rate cuts and QE. But the USD/JPY has fallen sharply in recent months. The USD has weakened due to the Fed becoming less and less hawkish while the JPY has soared because of the fact that the BOJ has continually failed to meet expectations with its easing steps.
Nevertheless, the US Federal Reserve is still the only major central bank which is deemed to be hawkish due to a general but slow improvement in US data, while the Bank of Japan is still one the most dovish central banks out there. This makes us fundamentally bullish on the USD/JPY. At the moment, the market is demanding further action from the BOJ, and should the USD/JPY weaken further then the central bank may have to act accordingly. But it is also possible that we will see further improvement in US data, which would make another rate increase from the Fed more likely. So, the fundamental story is still there for the USD/JPY to appreciate, even without the help of the BOJ.
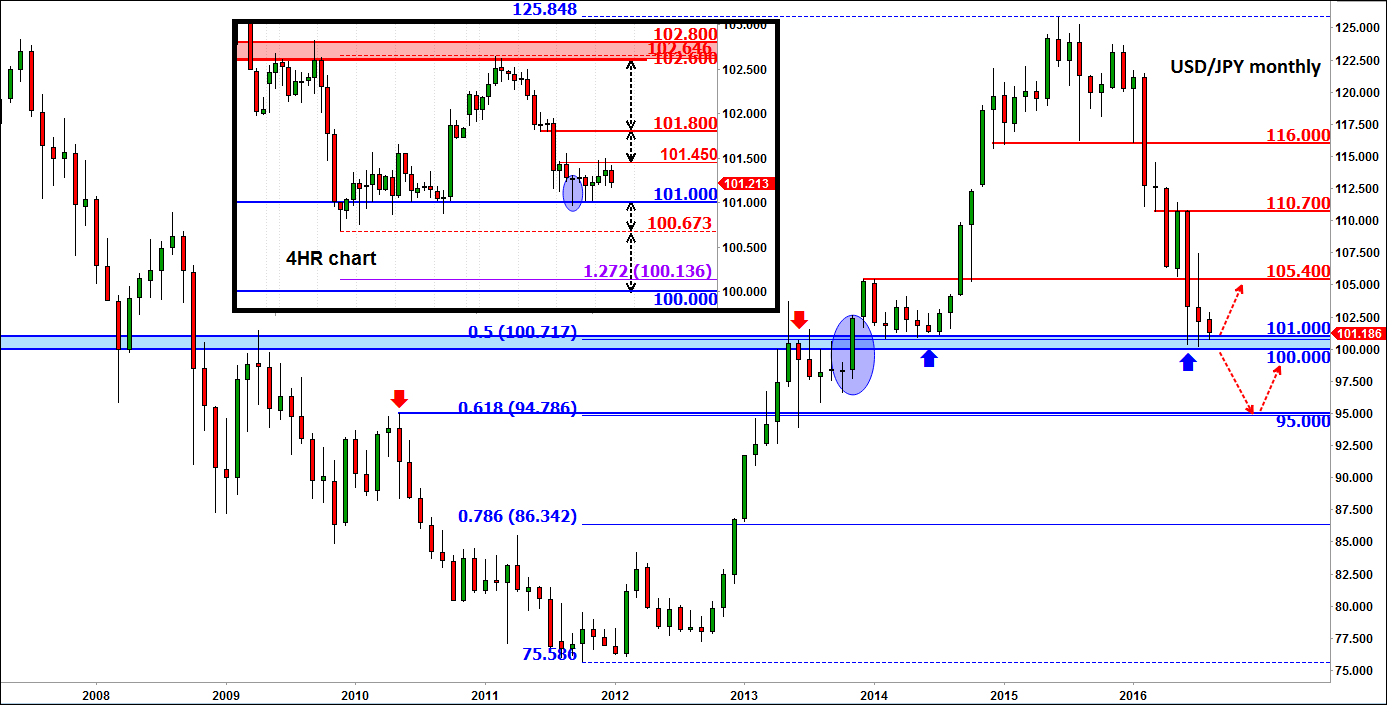
Now today I wanted to draw your attention to price action around the technically-important 100-101 area, which was a massive resistance level in the past. The USD/JPY will soon either break down further or bounce sharply from around this area. Make no mistake about it – the monthly chart is probably the most important time frame as far as major trends are concerned. So what you may see on your daily or intraday charts may have to be taken with a pinch of salt. Now the 4-hour chart in the inset shows price has been struggling to make headway even though it has had a few tests of the upper end of this 100-101 range. When price struggles to lift off quickly, it would normally make me think that a break down would be the most likely outcome rather than a rally. However, since the monthly time frame supersedes the 4-hour in terms of technical importance, it may pay to take any short-term bearish developments with a pinch of salt here.
Thus if you are bearish at these levels, it may not be a bad idea to proceed with extra care and be more nimble. But if you are bullish, then maybe waiting for confirmation would not be bad thing. Mind you, we have already seen some bullish candles on the 4-hour, such as the one highlighted (doji). But the lack of any significant bullish follow-through so far may be a sign for concern. Nevertheless, the confirmation could come in to the form of a break above a key short-term resistance level such as 101.45 and ideally 101.80. If seen, the USD/JPY may then start to squeeze higher as the shorts rush for cover. However, the 100-101 range is obviously 100 pips wide and it is possible price may test liquidity in the lower end of this range before potentially bouncing back – if it does at all.
Needless to say, a decisive break below 100 would completely invalidate the bullish outlook. In this potential scenario, the USD/JPY may go on to drop to the next significant support at 95.00, where further action from the BOJ would then become more likely, in our view. Also, the 95 handle is where the long-term 61.8% Fibonacci level meets the prior resistance, making it likely that price will at the very least stage a sharp bounce there.
So there you have it, the USD/JPY currency pair should provide plenty of good trading opportunities in due course. The only thing required now is patience. Conservative traders may wish to wait for price to make up its mind then trend in the direction of the trend.
StoneX Financial Ltd (trading as “City Index”) is an execution-only service provider. This material, whether or not it states any opinions, is for general information purposes only and it does not take into account your personal circumstances or objectives. This material has been prepared using the thoughts and opinions of the author and these may change. However, City Index does not plan to provide further updates to any material once published and it is not under any obligation to keep this material up to date. This material is short term in nature and may only relate to facts and circumstances existing at a specific time or day. Nothing in this material is (or should be considered to be) financial, investment, legal, tax or other advice and no reliance should be placed on it.
No opinion given in this material constitutes a recommendation by City Index or the author that any particular investment, security, transaction or investment strategy is suitable for any specific person. The material has not been prepared in accordance with legal requirements designed to promote the independence of investment research. Although City Index is not specifically prevented from dealing before providing this material, City Index does not seek to take advantage of the material prior to its dissemination. This material is not intended for distribution to, or use by, any person in any country or jurisdiction where such distribution or use would be contrary to local law or regulation.
For further details see our full non-independent research disclaimer and quarterly summary.
CFDs are complex instruments and come with a high risk of losing money rapidly due to leverage. 69% of retail investor accounts lose money when trading CFDs with this provider. You should consider whether you understand how CFDs work and whether you can afford to take the high risk of losing your money. CFD and Forex Trading are leveraged products and your capital is at risk. They may not be suitable for everyone. Please ensure you fully understand the risks involved by reading our full risk warning.
City Index is a trading name of StoneX Financial Ltd. Head and Registered Office: 1st Floor, Moor House, 120 London Wall, London, EC2Y 5ET. StoneX Financial Ltd is a company registered in England and Wales, number: 05616586. Authorised and regulated by the Financial Conduct Authority. FCA Register Number: 446717.
City Index is a trademark of StoneX Financial Ltd.
The information on this website is not targeted at the general public of any particular country. It is not intended for distribution to residents in any country where such distribution or use would contravene any local law or regulatory requirement.
© City Index 2024