USD JPY hits key level ahead of FOMC
Along with the US equity markets, the USD/JPY has been rallying sharply in recent weeks. But Ahead of the FOMC’s policy meeting in midweek and due to technical reasons, we wouldn’t be surprised to see a pause in the bullish trend around the 116/117 area. Overall though, the dollar remains well-supported and any weakness could very well turn out to be temporary. The Fed will most likely hike interest rates by 25 basis points on Wednesday as widely expected, but the dollar may be able to rise further if the expected rate rise is accompanied by a more hawkish-than-expected policy statement or remarks from Janet Yellen at the FOMC press conference.
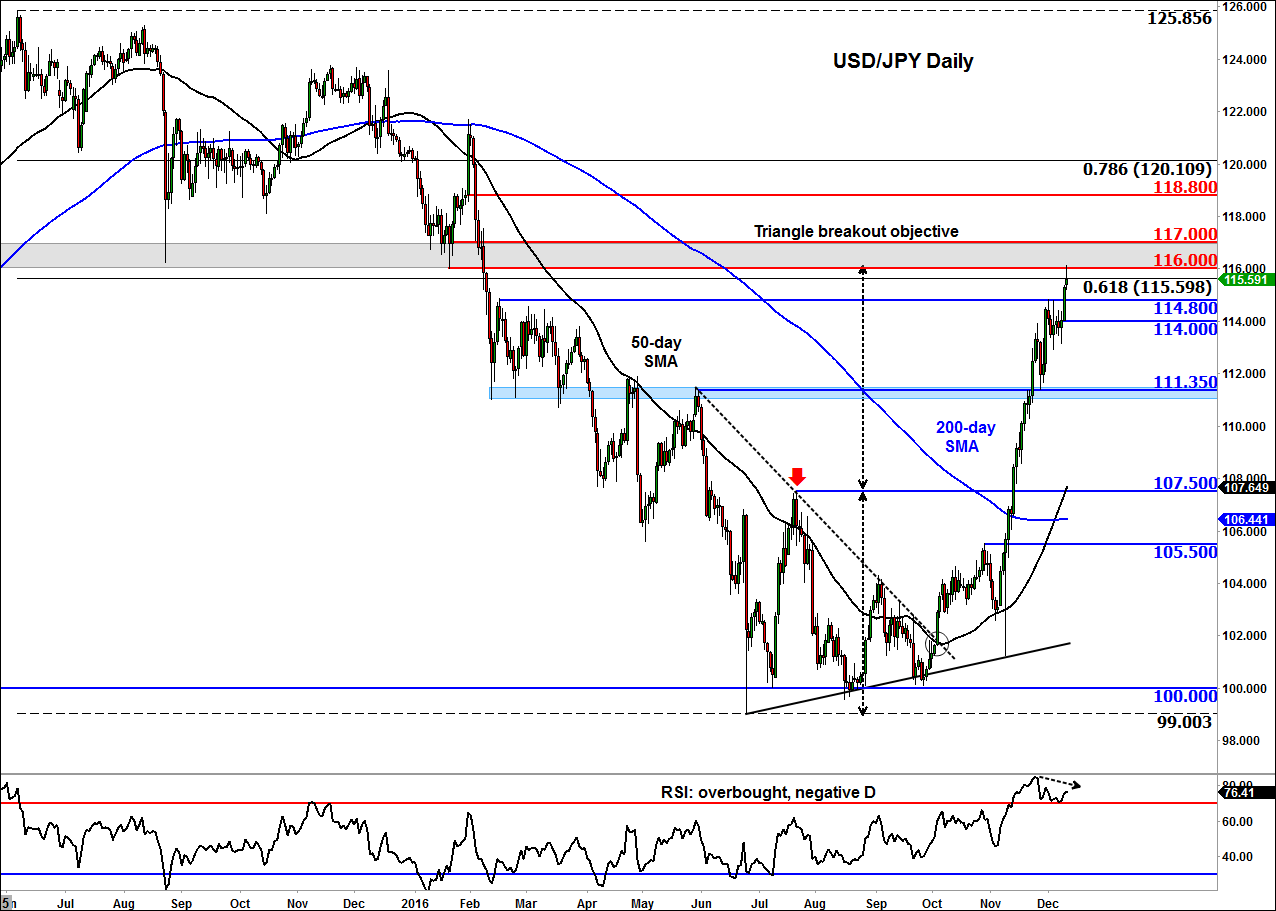
Turning our focus to the charts and we can see that the USD/JPY has now entered the 116/117 resistance range, which was the last key support prior the breakdown that took place in February. Given the sharp rally into this importance level, a short-term pullback should not come as a surprise.
In addition to this 116.00 level being previously support and now resistance, it also corresponds with the measured move objective of the triangle breakout, as per the chart. What’s more, price has reached the 61.8% Fibonacci retracement level against the last major swing high. Furthermore, it is worth mentioning the fact that the momentum indicator RSI has climbed above the ‘overbought’ threshold of 70 and is now in a state of negative divergence, making a lower high compared to the higher high on the underlying price action.
Thus for all these technical considerations, profit-taking from the bulls and some opportunistic selling from the bears could provide some pressure on the USD/JPY in the early part of this week.
However, as mentioned, the bullish trend does look quite strong and so far no break in market structure has been observed. Therefore, it is imperative to pay a lot of attention to the initial levels of support now to gauge the strength of the market. On the daily time frame, the first potential level of support is at 114.80. However if this level breaks down then the selling pressure may grow rapidly. In this case, we may see 114.00 or who knows even 111.35 before price makes its next move.
Meanwhile if and when the key 116/117 resistance area is cleared then we may see a move towards the next resistance at 118.80 and potentially beyond over time. But to get us there, the bulls may require some assistance from a hawkish Fed in midweek and maybe a more dovish-than-expected BoJ the week after.
StoneX Financial Ltd (trading as “City Index”) is an execution-only service provider. This material, whether or not it states any opinions, is for general information purposes only and it does not take into account your personal circumstances or objectives. This material has been prepared using the thoughts and opinions of the author and these may change. However, City Index does not plan to provide further updates to any material once published and it is not under any obligation to keep this material up to date. This material is short term in nature and may only relate to facts and circumstances existing at a specific time or day. Nothing in this material is (or should be considered to be) financial, investment, legal, tax or other advice and no reliance should be placed on it.
No opinion given in this material constitutes a recommendation by City Index or the author that any particular investment, security, transaction or investment strategy is suitable for any specific person. The material has not been prepared in accordance with legal requirements designed to promote the independence of investment research. Although City Index is not specifically prevented from dealing before providing this material, City Index does not seek to take advantage of the material prior to its dissemination. This material is not intended for distribution to, or use by, any person in any country or jurisdiction where such distribution or use would be contrary to local law or regulation.
For further details see our full non-independent research disclaimer and quarterly summary.
CFDs are complex instruments and come with a high risk of losing money rapidly due to leverage. 69% of retail investor accounts lose money when trading CFDs with this provider. You should consider whether you understand how CFDs work and whether you can afford to take the high risk of losing your money. CFD and Forex Trading are leveraged products and your capital is at risk. They may not be suitable for everyone. Please ensure you fully understand the risks involved by reading our full risk warning.
City Index is a trading name of StoneX Financial Ltd. Head and Registered Office: 1st Floor, Moor House, 120 London Wall, London, EC2Y 5ET. StoneX Financial Ltd is a company registered in England and Wales, number: 05616586. Authorised and regulated by the Financial Conduct Authority. FCA Register Number: 446717.
City Index is a trademark of StoneX Financial Ltd.
The information on this website is not targeted at the general public of any particular country. It is not intended for distribution to residents in any country where such distribution or use would contravene any local law or regulatory requirement.
© City Index 2024