USD JPY hits 110 where to next
The USD/JPY fell for a time below the psychological level of 110 this afternoon before bouncing back to trade around 110.30 at the time of this writing. The selling was triggered in part by dollar weakness on the back of mixed-bag US data and recent dovish commentary from the Fed, and also on safe haven flows into the yen as equities sold off. What happens next will be very important as far as the medium term direction is concerned.
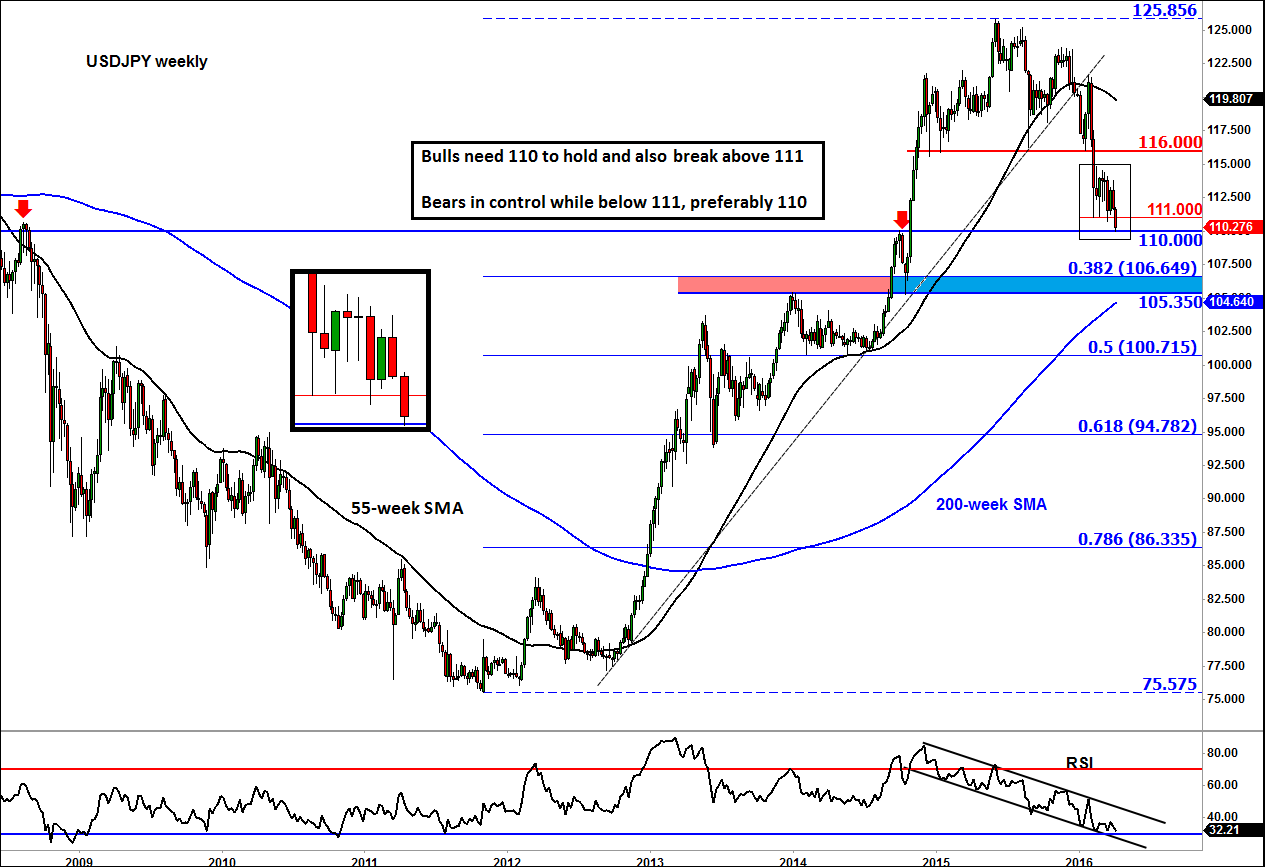
The weekly chart of the USD/JPY, below, shows that the 110 handle had been a key resistance level in the past, so there is a good chance it may turn into significant support now and lead to a big rally. However, failure to do so could lead to a significant sell-off as more long-term investors may be forced to abandon their positions, which will no doubt encourage fresh momentum selling pressure. So what happens at 110 will have a big impact on direction, potentially for the next several weeks or even months.
IF the 110 level gives way decisively then there is little further support seen on this time frame until 105.35-106.65 area. So, there is scope for another 335-535 pip drop. As can be seen from the shaded area on the chart, the upper end of this range marks the 38.2% Fibonacci retracement level of the multi-year rally, while the lower end was previously a resistance-turned-support level.
On the other hand, if the USD/JPY bounces back from the 110 level then the first major level of resistance that will need to be watched is around 111.00, the low from the recent range that price broke out from today. At this stage, the bulls will require a decisive break back above 111.00 in order for the long-term bullish trend to have any chance of resuming. Should this happen, then there is little further resistance to stand on the way of a potential rally until 116 – the neckline of the most recent bull/bear reversal pattern.
So expect to see some wild swings in the USD/JPY depending on what happens at 110.00. It should pave the way for plenty of trading opportunities.
StoneX Financial Ltd (trading as “City Index”) is an execution-only service provider. This material, whether or not it states any opinions, is for general information purposes only and it does not take into account your personal circumstances or objectives. This material has been prepared using the thoughts and opinions of the author and these may change. However, City Index does not plan to provide further updates to any material once published and it is not under any obligation to keep this material up to date. This material is short term in nature and may only relate to facts and circumstances existing at a specific time or day. Nothing in this material is (or should be considered to be) financial, investment, legal, tax or other advice and no reliance should be placed on it.
No opinion given in this material constitutes a recommendation by City Index or the author that any particular investment, security, transaction or investment strategy is suitable for any specific person. The material has not been prepared in accordance with legal requirements designed to promote the independence of investment research. Although City Index is not specifically prevented from dealing before providing this material, City Index does not seek to take advantage of the material prior to its dissemination. This material is not intended for distribution to, or use by, any person in any country or jurisdiction where such distribution or use would be contrary to local law or regulation.
For further details see our full non-independent research disclaimer and quarterly summary.
CFDs are complex instruments and come with a high risk of losing money rapidly due to leverage. 69% of retail investor accounts lose money when trading CFDs with this provider. You should consider whether you understand how CFDs work and whether you can afford to take the high risk of losing your money. CFD and Forex Trading are leveraged products and your capital is at risk. They may not be suitable for everyone. Please ensure you fully understand the risks involved by reading our full risk warning.
City Index is a trading name of StoneX Financial Ltd. Head and Registered Office: 1st Floor, Moor House, 120 London Wall, London, EC2Y 5ET. StoneX Financial Ltd is a company registered in England and Wales, number: 05616586. Authorised and regulated by the Financial Conduct Authority. FCA Register Number: 446717.
City Index is a trademark of StoneX Financial Ltd.
The information on this website is not targeted at the general public of any particular country. It is not intended for distribution to residents in any country where such distribution or use would contravene any local law or regulatory requirement.
© City Index 2024