USD JPY down but not out as Trump spooks markets
So, Donald Trump finally spoke and down went stocks and the dollar. Shares of biotech stocks took a hit after the President-elect signalled that his US government would negotiate aggressively on the price it pays for drugs. The USD/JPY, which tends to correlate positively with stocks, slumped, while the EUR/USD and even the GBP/USD surged higher. Perceived safe-haven and dollar-denominated gold and silver bounced back sharply. As we go to press the dollar was still weaker on the day, but off its worst levels.
As mentioned in my previous report, there are no fresh catalysts to drive the dollar higher in the short-term. So we may see the US currency weaken further in the days to come. However, the greenback remains well supported in the long-term as the Fed continues to be the only major hawkish central bank out there. The next potential catalysts for a dollar move are a speech by Fed Chair Janet Yellen on Friday and US CPI on Wednesday.
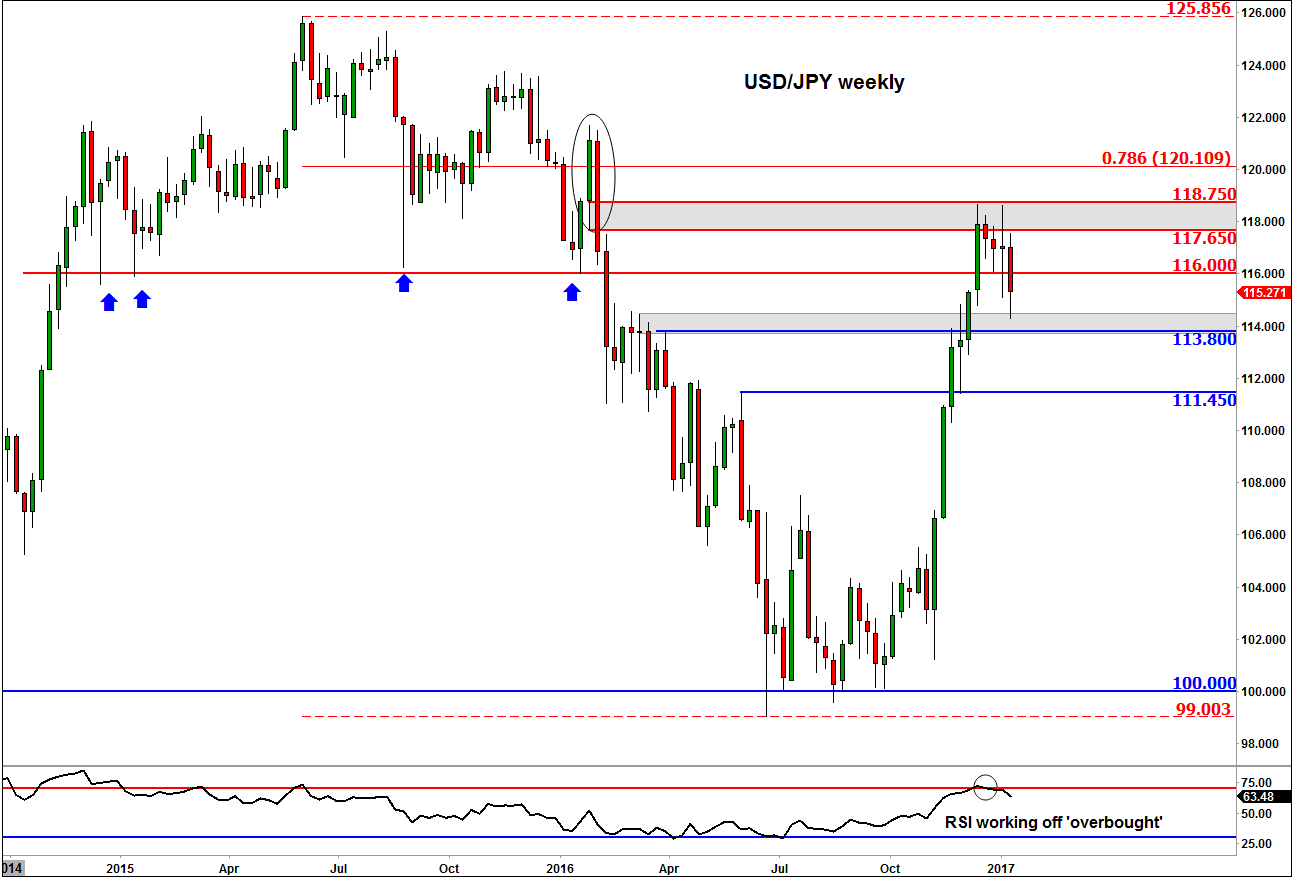
From a technical perspective, the USD/JPY has spent the best part of the last 4 weeks trying to work off ‘overbought’ conditions after its impressive rally came to a halt at end of last year. That rally stalled at a long-term resistance zone between 117.65 and 118.75. As can be seen on the chart, this was the area between the open and low of last up candle prior to the down move (circled) which preceded the drop to 100. It was here where the selling had started, in other words. Given the extent of the drop from here and also the size of the rebound, traders were always going to respect this resistance zone: buyers took profit on their longs, sellers initiated new shorts. Consequently, the USD/JPY has pulled back noticeably from this 117.65/118.75 area to drop to a low so far of 114.25.
The break of 116.00 support, if sustained, could see the USD/JPY drop to at least 113.80 and below that the next line of defence is at 111.45. These levels were previously resistance and so they could turn into support upon re-test. At this stage, a weekly close above 117.65-118.75 is needed for the long-term bullish trend to be re-established. Either that, or a distinct reversal pattern at these slightly lower levels, ideally around the above-mentioned supports, needs to be formed before we potentially see the next leg of the up move.
StoneX Financial Ltd (trading as “City Index”) is an execution-only service provider. This material, whether or not it states any opinions, is for general information purposes only and it does not take into account your personal circumstances or objectives. This material has been prepared using the thoughts and opinions of the author and these may change. However, City Index does not plan to provide further updates to any material once published and it is not under any obligation to keep this material up to date. This material is short term in nature and may only relate to facts and circumstances existing at a specific time or day. Nothing in this material is (or should be considered to be) financial, investment, legal, tax or other advice and no reliance should be placed on it.
No opinion given in this material constitutes a recommendation by City Index or the author that any particular investment, security, transaction or investment strategy is suitable for any specific person. The material has not been prepared in accordance with legal requirements designed to promote the independence of investment research. Although City Index is not specifically prevented from dealing before providing this material, City Index does not seek to take advantage of the material prior to its dissemination. This material is not intended for distribution to, or use by, any person in any country or jurisdiction where such distribution or use would be contrary to local law or regulation.
For further details see our full non-independent research disclaimer and quarterly summary.
CFDs are complex instruments and come with a high risk of losing money rapidly due to leverage. 69% of retail investor accounts lose money when trading CFDs with this provider. You should consider whether you understand how CFDs work and whether you can afford to take the high risk of losing your money. CFD and Forex Trading are leveraged products and your capital is at risk. They may not be suitable for everyone. Please ensure you fully understand the risks involved by reading our full risk warning.
City Index is a trading name of StoneX Financial Ltd. Head and Registered Office: 1st Floor, Moor House, 120 London Wall, London, EC2Y 5ET. StoneX Financial Ltd is a company registered in England and Wales, number: 05616586. Authorised and regulated by the Financial Conduct Authority. FCA Register Number: 446717.
City Index is a trademark of StoneX Financial Ltd.
The information on this website is not targeted at the general public of any particular country. It is not intended for distribution to residents in any country where such distribution or use would contravene any local law or regulatory requirement.
© City Index 2024