USD JPY Brexit or Bremain Countdown Begins
In 15 hours or so, the voting will begin and soon we will find out whether the UK public has chosen to remain or exit the EU. As you would expect, politicians are making their final pitch for votes on the last day of campaigning as they try to win support of those still undecided. Expect to see increasing levels of volatility in the interim and the markets are likely to turn very wild once the outcome of the referendum becomes clear in the early hours of Friday – especially for the British pound. But we have discussed in length the potential impactions of “Brexit” or “Bremain” on the pound, FTSE and other UK-linked markets, as well as gold. Today, we are looking at USD/JPY, which can be thought of as a proxy for risk.
If risk assets rally in the aftermath of a “remain” outcome the USD/JPY could move sharply higher, too. Demand for the safe haven yen will likely fall, while the USD could bounce as the market reprices the odds for the timing of the next rate hike in the US forward, as one less source of global uncertainty should be an encouragement for the FOMC hawks. Conversely, if the Brexit camp wins, safe haven yen could rally sharply, which should put downward pressure on the USD/JPY pair. Judging by today’s price action in the equity markets, however, it looks like investors are betting on Bremain rather than Brexit.
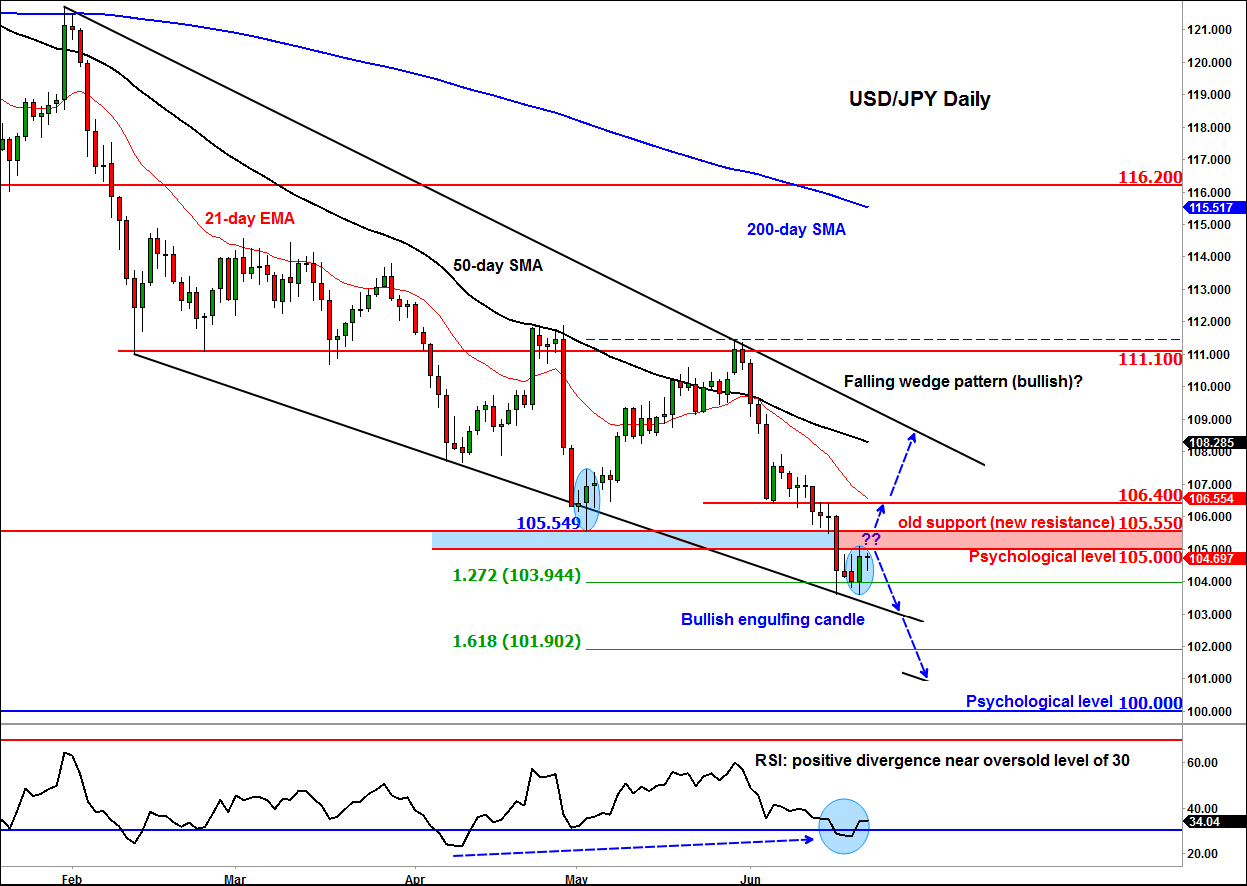
But it is for technical rather than fundamental reasons why I am paying closer attention to the USD/JPY today, for it has created several indications on its daily chart that suggests a potential bottom may be forming. That is provided that the key area between 105.00 and 105.55 does not turn into strong resistance now (good chance it will) and limit the potential gains.
So, what are these bullish indications? Well, for a start, the USD/JPY’s RSI indicator has only just recovered from 30, suggesting it may be oversold anyway. The RSI has also created a positive divergence with price: it has made a higher low compared with the lower low for the USD/JPY. This suggests that the bearish momentum may be waning.
What’s more, the USD/JPY has already created a bullish engulfing candlestick formation on its daily chart on Tuesday. This pattern clearly shows a shift from selling to buying pressure and usually, but not always, precedes further follow-up gains.
But it is important to ponder over the location of this bullish pattern in order to remain objective.
On the one hand, you have the support trend of the falling wedge pattern (which in itself is a bullish pattern) converging with the 127.2% Fibonacci extension level of the previous upswing around the 103.95 area, making it an ideal location for profit-taking.
On the other hand, however, the previous support at 105.55 and psychological level of 105.00 have both broken down, which means the USD/JPY has formed a new lower low. With price residing well below the moving averages too, no one can argue that the trend is clearly bearish and that it has accelerated.
Indeed, the kick-back rally could easily be rejected at that pivotal 105.00-105.55 area. This resistance area has already been tested once – on Tuesday – leading to a modest pullback so far. If the low of Tuesday’s reversal candle (~103.58) breaks then this would completely invalidate the bullish setup. In this potential scenario, the next stop for the USD/JPY could well be around the 161.8% Fibonacci extension level at 101.90 or the next big figure: 100.
However, if price makes another attempt and this time breaks above the 105.00-105.55 resistance area then we could see the onset of a bigger rally, as this outcome will no doubt prove some sellers wrong, which could trigger a short-covering rush. In this potential scenario, the USD/JPY could quickly rally towards the resistance trend of the falling wedge pattern, around 108.00, perhaps after a brief stop at 106.40 first.
StoneX Financial Ltd (trading as “City Index”) is an execution-only service provider. This material, whether or not it states any opinions, is for general information purposes only and it does not take into account your personal circumstances or objectives. This material has been prepared using the thoughts and opinions of the author and these may change. However, City Index does not plan to provide further updates to any material once published and it is not under any obligation to keep this material up to date. This material is short term in nature and may only relate to facts and circumstances existing at a specific time or day. Nothing in this material is (or should be considered to be) financial, investment, legal, tax or other advice and no reliance should be placed on it.
No opinion given in this material constitutes a recommendation by City Index or the author that any particular investment, security, transaction or investment strategy is suitable for any specific person. The material has not been prepared in accordance with legal requirements designed to promote the independence of investment research. Although City Index is not specifically prevented from dealing before providing this material, City Index does not seek to take advantage of the material prior to its dissemination. This material is not intended for distribution to, or use by, any person in any country or jurisdiction where such distribution or use would be contrary to local law or regulation.
For further details see our full non-independent research disclaimer and quarterly summary.
CFDs are complex instruments and come with a high risk of losing money rapidly due to leverage. 69% of retail investor accounts lose money when trading CFDs with this provider. You should consider whether you understand how CFDs work and whether you can afford to take the high risk of losing your money. CFD and Forex Trading are leveraged products and your capital is at risk. They may not be suitable for everyone. Please ensure you fully understand the risks involved by reading our full risk warning.
City Index is a trading name of StoneX Financial Ltd. Head and Registered Office: 1st Floor, Moor House, 120 London Wall, London, EC2Y 5ET. StoneX Financial Ltd is a company registered in England and Wales, number: 05616586. Authorised and regulated by the Financial Conduct Authority. FCA Register Number: 446717.
City Index is a trademark of StoneX Financial Ltd.
The information on this website is not targeted at the general public of any particular country. It is not intended for distribution to residents in any country where such distribution or use would contravene any local law or regulatory requirement.
© City Index 2024