USD JPY at key technical juncture
The USD/JPY managed to bounce off the pivotal 122.00 mark this morning, though it still remains under pressure amid safe haven flows due, above all, to the on-going situation in Greece. Traders are also exercising some caution ahead of the US nonfarm payrolls and other key data on Thursday, which explains why price has failed to rally more profoundly. After all, today’s US data releases were not bad with the consumer confidence index, for example, coming in way ahead of expectations at 101.4 for June.
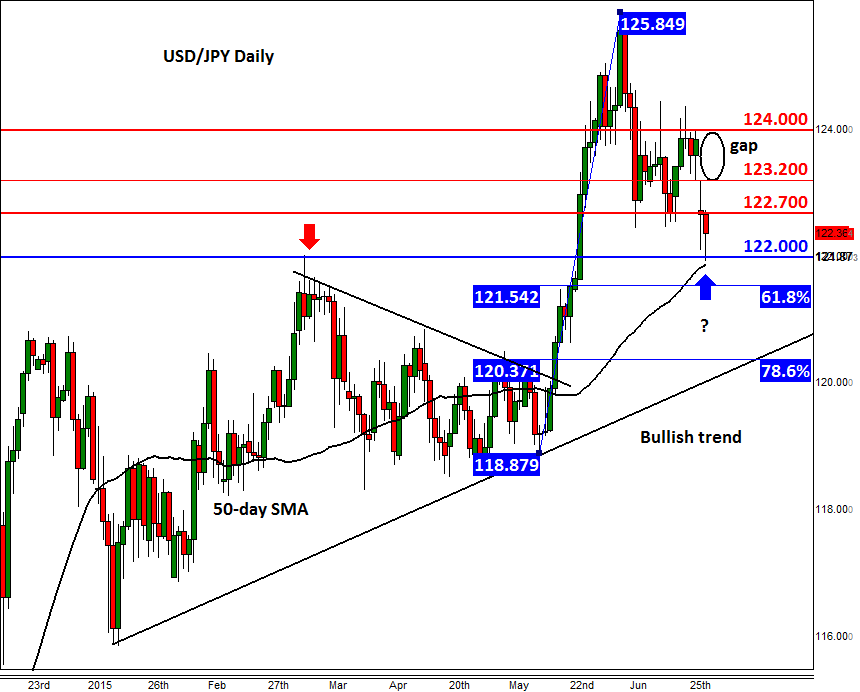
As a reminder, 122.00 was previously a sturdy level of resistance for the USD/JPY, corresponding to the March peak. This level was taken out in late May, leading to a rally that eventually fizzled out around 125.85 at the start of this month. From this peak, price has retreated somewhat dramatically and has made a few small lower highs. Indeed, the USD/JPY even created a large gap on Monday, pointing to strong selling pressure.
But the long-term trend is still bullish, so the selling pressure could abate soon. Given the technical importance of 122.00, we wouldn’t be surprised if the USD/JPY stages a rally from here. Indeed, what happens here could determine the near-term direction for price.
If the buyers hold their nerves around the 122 handle, the USD/JPY may be able to recover its poise and head towards the resistance levels shown on the chart. The immediate resistance the bears would need to tackle is at 122.70, though a more profound level is at 123.20, which was previously support. The abovementioned gap has not yet been “filled” completely. If price were to break above 123.20, there is a good chance this void will be filled completely. Additional resistance is seen around 124.00 – a closing break above here would be a significantly bullish development.
Meanwhile if support at 122.00 gives way then the bears may aim for the 50-day moving average at 121.85 followed by the 61.8% Fibonacci retracement level at 121.55. The next key support could be the bullish trend around 120.10-40.
StoneX Financial Ltd (trading as “City Index”) is an execution-only service provider. This material, whether or not it states any opinions, is for general information purposes only and it does not take into account your personal circumstances or objectives. This material has been prepared using the thoughts and opinions of the author and these may change. However, City Index does not plan to provide further updates to any material once published and it is not under any obligation to keep this material up to date. This material is short term in nature and may only relate to facts and circumstances existing at a specific time or day. Nothing in this material is (or should be considered to be) financial, investment, legal, tax or other advice and no reliance should be placed on it.
No opinion given in this material constitutes a recommendation by City Index or the author that any particular investment, security, transaction or investment strategy is suitable for any specific person. The material has not been prepared in accordance with legal requirements designed to promote the independence of investment research. Although City Index is not specifically prevented from dealing before providing this material, City Index does not seek to take advantage of the material prior to its dissemination. This material is not intended for distribution to, or use by, any person in any country or jurisdiction where such distribution or use would be contrary to local law or regulation.
For further details see our full non-independent research disclaimer and quarterly summary.
CFDs are complex instruments and come with a high risk of losing money rapidly due to leverage. 69% of retail investor accounts lose money when trading CFDs with this provider. You should consider whether you understand how CFDs work and whether you can afford to take the high risk of losing your money. CFD and Forex Trading are leveraged products and your capital is at risk. They may not be suitable for everyone. Please ensure you fully understand the risks involved by reading our full risk warning.
City Index is a trading name of StoneX Financial Ltd. Head and Registered Office: 1st Floor, Moor House, 120 London Wall, London, EC2Y 5ET. StoneX Financial Ltd is a company registered in England and Wales, number: 05616586. Authorised and regulated by the Financial Conduct Authority. FCA Register Number: 446717.
City Index is a trademark of StoneX Financial Ltd.
The information on this website is not targeted at the general public of any particular country. It is not intended for distribution to residents in any country where such distribution or use would contravene any local law or regulatory requirement.
© City Index 2024