USD JPY arrives at key support potential for short term bounce
The sell-off in stocks and oil markets has seen the safe haven US dollar rise against most major currencies, except the Japanese yen. The reason for this is because the yen is currently deemed more of a safe haven currency than the dollar. But as we have mentioned consistently this week, sentiment could turn very quickly and if the stock markets stabilise going into the second half of the week then the USD/JPY may finally start to rise. Today’s economic data have been mostly positive, although so far there has been corresponding rally in the USD/JPY. The ADP report showed a 257,000 gain in private sector payrolls in December, versus a 193,000 increased eyed. On top of this, the Markit Services PMI came out at 54.3, which was slightly above the expectations and last month’s print of 53. However the ISM non-manufacturing PMI was slightly weaker at 55.3, although the employment component showed a solid reading of 55.7 compared to 55.0 recorded in November. These leading indicators therefore point to a solid rise in the official non-farm employment, with the data scheduled for release on Friday. So, we could see the USD/JPY start to perform better in the second half of the week, especially if tonight’s FOMC meeting minutes point to a more hawkish-than-expected Federal Reserve.
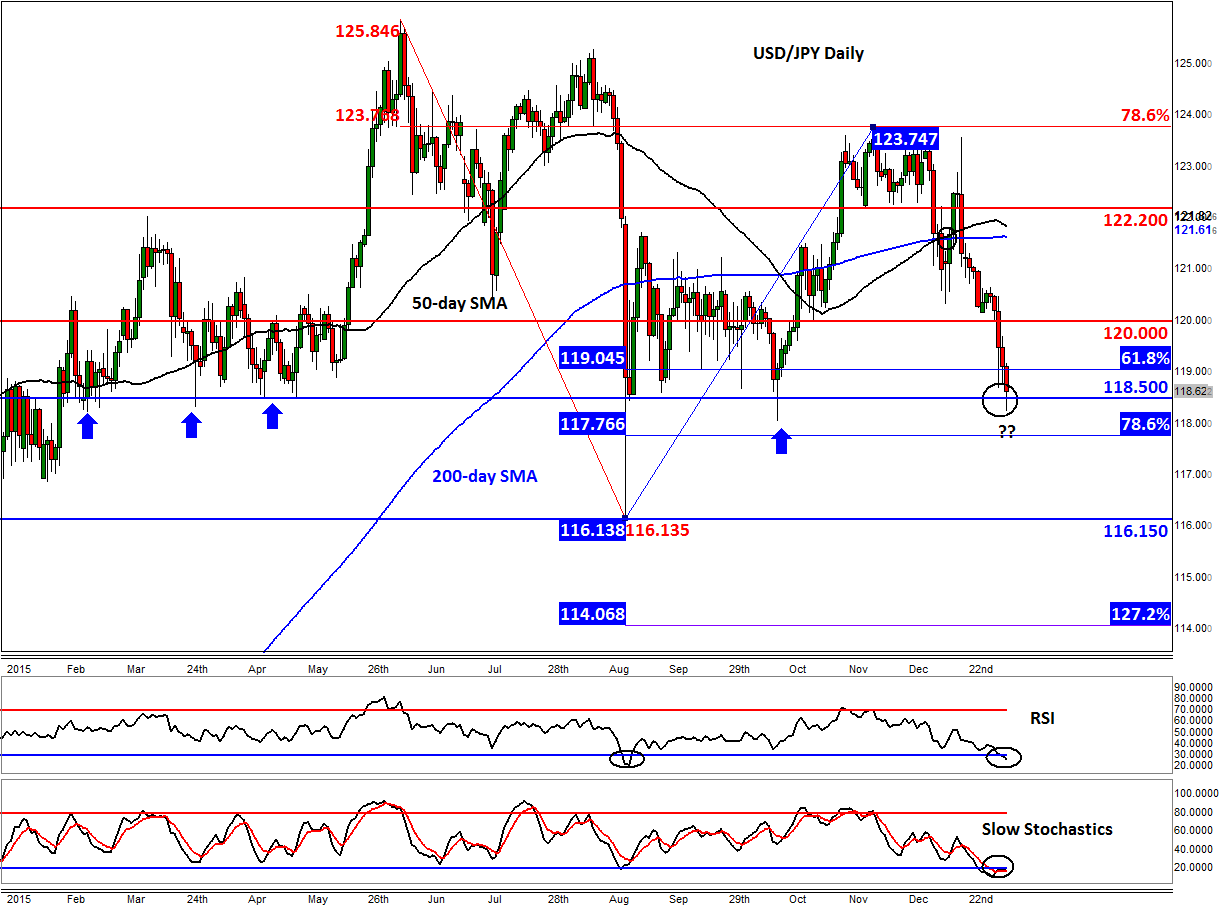
From a technical perspective, the USD/JPY is testing an important support around 118.50 today. As can be seen on the daily chart, this level has repeatedly offered support on a daily closing basis since February 2015. Thus what happens here now could determine the direction for the next several days at the very least. A rebound here could see the USD/JPY start to climb back towards and potentially beyond 120.00 again, while a close below it may lead to a significant drop. Some of the secondary indicators suggest a bounce may be due, with both the RSI and slow stochastics being below their respective oversold thresholds.
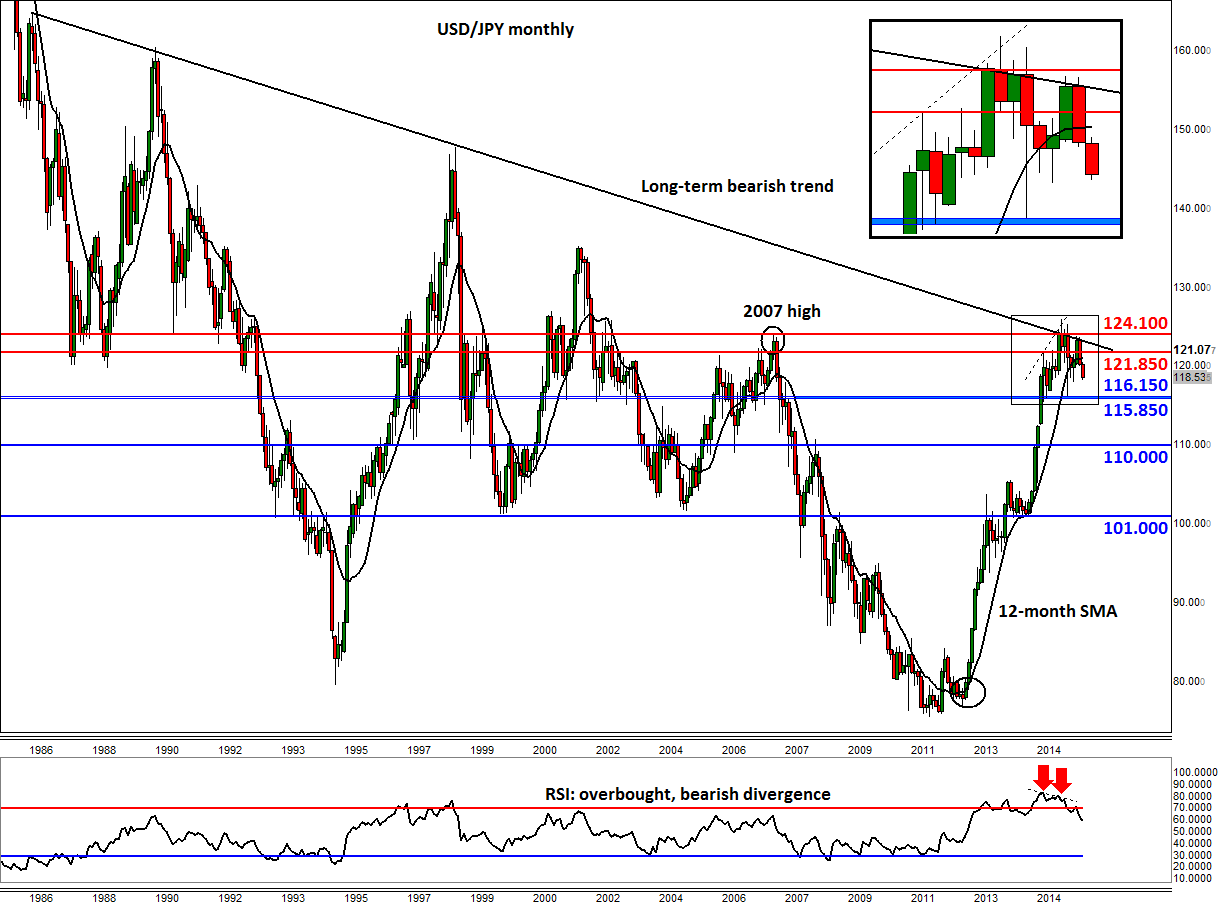
But the longer-term technical outlook is looking somewhat shaky with the monthly chart suggesting a major top may have already been formed around the 124/26 area. But before we look any further into the details, please remember that we are only talking technicals here, not fundamentals. The first thing to note on this long-term chart of the USD/JPY is that a trend line that stretches back all the way to the year 1986 has consistently provided resistance throughout 2015. On top of this, there is an apparent false breakout reversal pattern above the 2007 high of 124.10. Making the bearish case even more strong is the falling momentum: the monthly RSI has created a clear bearish divergence with price above the overbought territory of 70 i.e. it has created a lower high when price made its most recent higher high. Worryingly for the bulls, the next major long-term support is not seen until the psychologically-important level of 110 – more than 850 pips away from here – although there is some near term support around the 2015 lows of 115.85-116.15 (shaded in blue). What’s more, the 12-month moving average, which had consistently provided support to USD/JPY since price broke above it back in October 2012, has broken down.
On the flip side however, the relatively tight consolidation below the long-term bearish trend may mean that price is gearing up for a potential break out soon. If this happens, the USD/JPY could climb to significantly higher levels in 2016, especially given the fundamental backdrop of growing divergence between monetary policies of the US and Japan. We remain fundamentally bullish in the medium to long term outlook, until proven wrong. But from a purely technical point of view, the monthly closing break below the 12-month moving average is a short-term bearish development we can’t ignore, and this has already led to a sharp drop at the start of this year.
StoneX Financial Ltd (trading as “City Index”) is an execution-only service provider. This material, whether or not it states any opinions, is for general information purposes only and it does not take into account your personal circumstances or objectives. This material has been prepared using the thoughts and opinions of the author and these may change. However, City Index does not plan to provide further updates to any material once published and it is not under any obligation to keep this material up to date. This material is short term in nature and may only relate to facts and circumstances existing at a specific time or day. Nothing in this material is (or should be considered to be) financial, investment, legal, tax or other advice and no reliance should be placed on it.
No opinion given in this material constitutes a recommendation by City Index or the author that any particular investment, security, transaction or investment strategy is suitable for any specific person. The material has not been prepared in accordance with legal requirements designed to promote the independence of investment research. Although City Index is not specifically prevented from dealing before providing this material, City Index does not seek to take advantage of the material prior to its dissemination. This material is not intended for distribution to, or use by, any person in any country or jurisdiction where such distribution or use would be contrary to local law or regulation.
For further details see our full non-independent research disclaimer and quarterly summary.
CFDs are complex instruments and come with a high risk of losing money rapidly due to leverage. 69% of retail investor accounts lose money when trading CFDs with this provider. You should consider whether you understand how CFDs work and whether you can afford to take the high risk of losing your money. CFD and Forex Trading are leveraged products and your capital is at risk. They may not be suitable for everyone. Please ensure you fully understand the risks involved by reading our full risk warning.
City Index is a trading name of StoneX Financial Ltd. Head and Registered Office: 1st Floor, Moor House, 120 London Wall, London, EC2Y 5ET. StoneX Financial Ltd is a company registered in England and Wales, number: 05616586. Authorised and regulated by the Financial Conduct Authority. FCA Register Number: 446717.
City Index is a trademark of StoneX Financial Ltd.
The information on this website is not targeted at the general public of any particular country. It is not intended for distribution to residents in any country where such distribution or use would contravene any local law or regulatory requirement.
© City Index 2024