USD JPY another day another weaker dollar
At the time of this writing the US dollar was a touch firmer against the likes of the euro and the Aussie, but lower versus the pound and yen, leaving the Dollar Index basically flat, but below that critical 100 level. So far, there are no signs of a comeback for the greenback. It sure wasn’t helped by the fact that unemployment claims showed a surprise increase last week. Apart from a few Fed speakers, there isn’t any significant US data scheduled for the remainder of this or next week to change the dollar’s current trend. So, the US currency may drift further lower. Any potential bounces should be taken with a pinch of salt, unless there is a clear break in the downtrend structure.
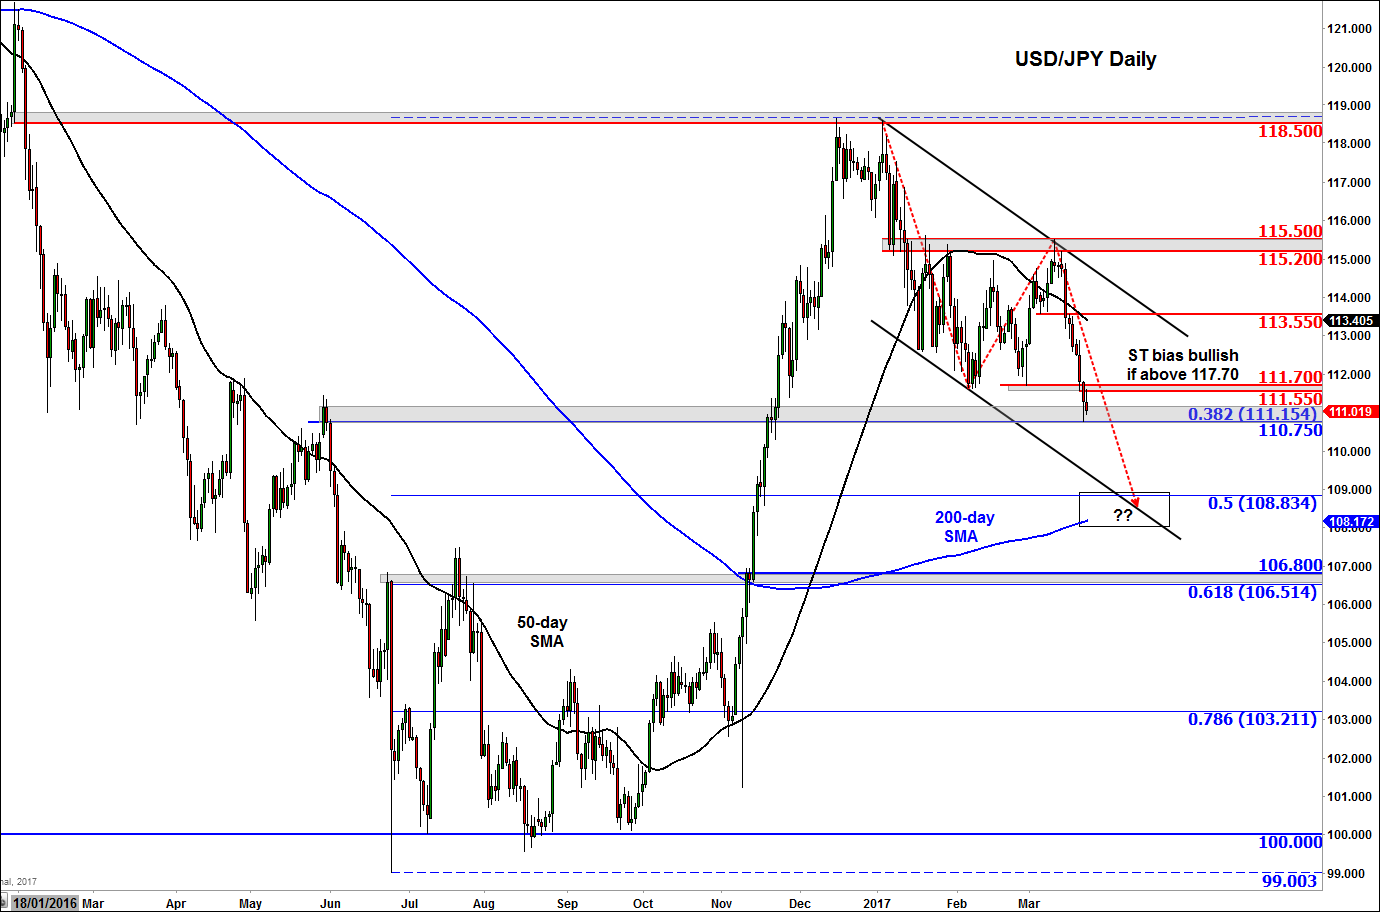
The dollar’s relentless selling saw the USD/JPY finally break below key support around 111.55/75 at the start of this week. It has since held below this area, which suggests further technical follow-up selling could be on the way. The sell-off has paused for breath around 110.75-111.15, an area which was previously support and resistance and ties in with the 38.2% Fibonacci retracement level against the low from last year. But if the USD/JPY were to break below this support region, which is our base case scenario, then the next stop could be around the 108-109 area. This is where the support trend of the bearish channel meets the 50% retracement level and the 200-day moving average. In addition, the point D of an AB=CD price move completes there. Thus, as a minimum, we should expect to see a bounce if the USD/JPY were to get there. But there’s an even stronger level of support further lower around 1.0650/80 area, as this was the last resistance prior to the breakout and it also ties in with the 61.8% Fibonacci retracement level. It is here where it is more likely that may see a bottom on the USD/JPY, though there is also a good chance for this to happen around the 200-day average.
But it is far too early to say anything technically bullish about the USD/JPY with a high degree of confidence, even if we remain fundamentally bullish on this par. Thus, for now, the bulls appear to be losing control of the trend. However, if they somehow manage to push the USD/JPY back above the broken support at 111.55/70 area then that could lead to a short-covering bounce, possibly towards the top of the bearish channel. The long-term bullish trend would only be re-established in the event the USD/JPY breaks out of the bearish channel to the upside.
StoneX Financial Ltd (trading as “City Index”) is an execution-only service provider. This material, whether or not it states any opinions, is for general information purposes only and it does not take into account your personal circumstances or objectives. This material has been prepared using the thoughts and opinions of the author and these may change. However, City Index does not plan to provide further updates to any material once published and it is not under any obligation to keep this material up to date. This material is short term in nature and may only relate to facts and circumstances existing at a specific time or day. Nothing in this material is (or should be considered to be) financial, investment, legal, tax or other advice and no reliance should be placed on it.
No opinion given in this material constitutes a recommendation by City Index or the author that any particular investment, security, transaction or investment strategy is suitable for any specific person. The material has not been prepared in accordance with legal requirements designed to promote the independence of investment research. Although City Index is not specifically prevented from dealing before providing this material, City Index does not seek to take advantage of the material prior to its dissemination. This material is not intended for distribution to, or use by, any person in any country or jurisdiction where such distribution or use would be contrary to local law or regulation.
For further details see our full non-independent research disclaimer and quarterly summary.
CFDs are complex instruments and come with a high risk of losing money rapidly due to leverage. 69% of retail investor accounts lose money when trading CFDs with this provider. You should consider whether you understand how CFDs work and whether you can afford to take the high risk of losing your money. CFD and Forex Trading are leveraged products and your capital is at risk. They may not be suitable for everyone. Please ensure you fully understand the risks involved by reading our full risk warning.
City Index is a trading name of StoneX Financial Ltd. Head and Registered Office: 1st Floor, Moor House, 120 London Wall, London, EC2Y 5ET. StoneX Financial Ltd is a company registered in England and Wales, number: 05616586. Authorised and regulated by the Financial Conduct Authority. FCA Register Number: 446717.
City Index is a trademark of StoneX Financial Ltd.
The information on this website is not targeted at the general public of any particular country. It is not intended for distribution to residents in any country where such distribution or use would contravene any local law or regulatory requirement.
© City Index 2024