USD JPY 2016 a year for the bulls or bears
It is already the end of 2015 and what a year it has been for the financial markets. US equity markets took investors for a wild ride only to end almost where they started; oil was on a slippery slope as it plummeted to multi-year lows as OPEC decided to keep its taps open, adding more crude to an already-saturated market due to the shale revolution; the Swiss franc soared in January but bled lower for much of the year after the SNB dropped its 1.20 EUR/CHF floor, and the EUR/USD fell below 1.05 after the ECB introduced QE, while the Fed raised interest rates for the first time since 2006. There are many questions investors will be asking themselves in 2016, and no doubt the next rate hike from the Fed will be among the main talking points. Yet, despite a hawkish Fed and still-dovish central banks elsewhere, the USD has not exactly caused any major fireworks with the Dollar Index consistently being capped below 100. Indeed, the USD/JPY’s 2015 range was a mere 1000 pips despite the growing divergence of monetary policy between the Fed and BOJ. Will 2016 bring the USD/JPY bullish speculators better luck?
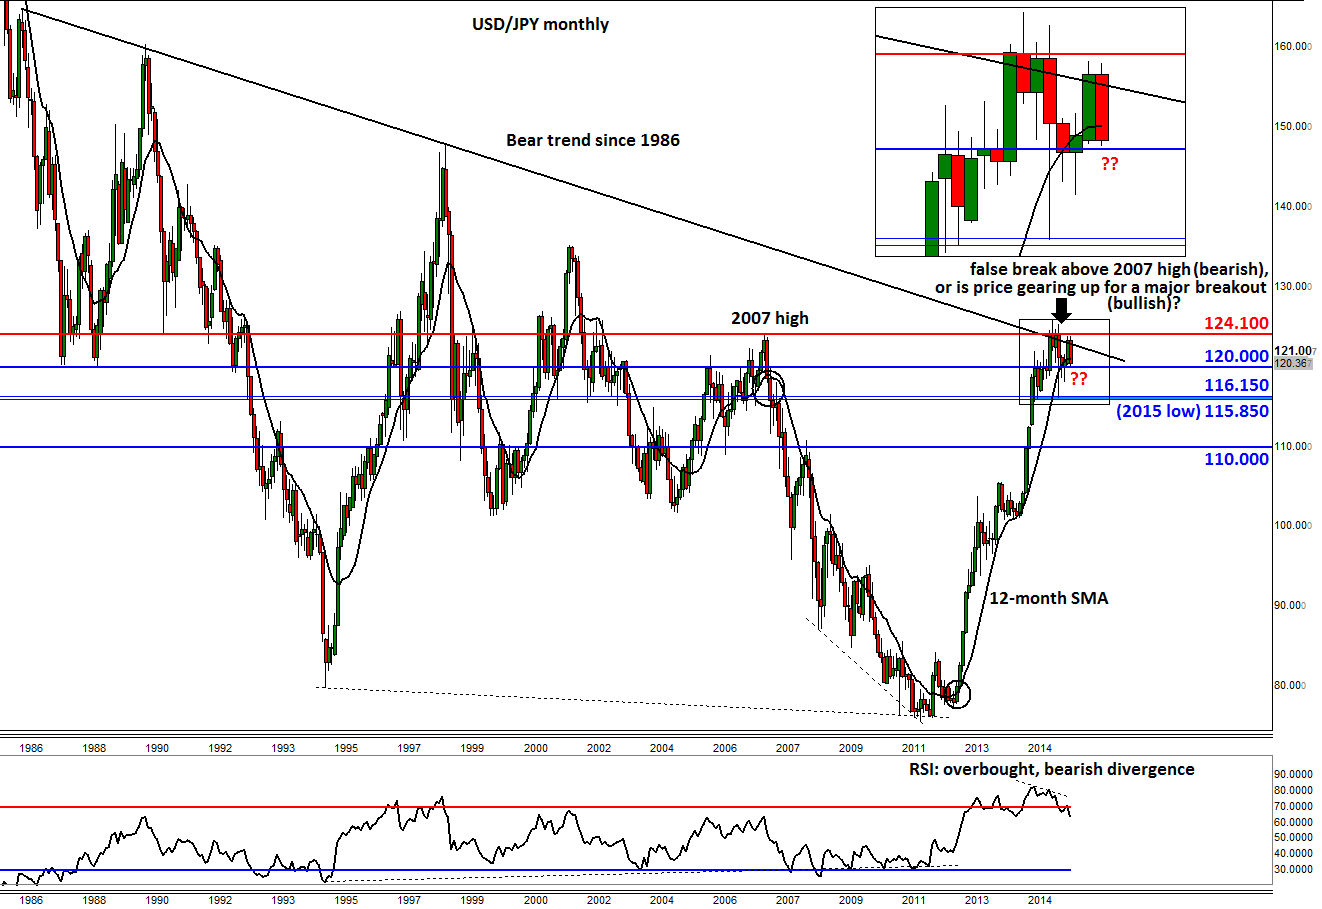
While no one knows the answer to that question, a good indication in terms of what to expect in 2016 can be provided by looking at the charts of the USD/JPY. Given that it is the end of the month, quarter and year and keeping the theme of longer-term outlook going, today we are looking at the monthly chart of the USD/JPY. A quick glance at this long-term chart suggests a major top may have already been formed around the 124/26 area. But before we look further into the details, please remember that we are only talking technicals here, not fundamentals. It could be that the BoJ may decide to massively increase its QE programme once again next year and/or the Fed embarks on a surprisingly sharp tightening cycle, say as a result of a sudden jump in inflation due for example to a rally in oil prices. But technical analysis should not be ignored whatever the fundamental backdrop, as the reaction of price to news is always more important than the news itself. If “bullish” news consistently fails to lift the USD/JPY then it would strongly suggest that a top is formed. And on a side note, the USD/JPY’s strong correlation with the equity markets, if sustained, point to lower levels for the major indices, especially the Nikkei, IF indeed the FX pair has already topped out. But again may I remind you that at this point, this is only a potential scenario and could easily become invalid if the USD/JPY stages a 400-500 pip rally from these levels at some stage in 2016, which of course is not impossible.
Anyway, the first thing to note on this monthly chart of the USD/JPY is that a trend line that stretches back all the way to the year 1986 has consistently provided resistance throughout 2015. On top of this, there is an apparent false breakout reversal pattern above the 2007 high of 124.10. Making the bearish case even more strong is the falling momentum: the RSI has created a clear bearish divergence with price above the overbought territory of 70 i.e. it has created a lower high when price made its most recent higher high. Worryingly for the bulls, the next major long-term support is not seen until the psychologically-important level of 110 – more than 1000 pips away from here – although there is also some near term support around the 2015 lows of 115.85-116.15 (shaded in blue). What’s more, the 12-month moving average, which has consistently provided support to USD/JPY since price broke above it back in October 2012, is beginning to look somewhat shaky. A decisive break below the average, would confirm the change in the trend.
On the flip side however, the relatively tight consolidation below the long-term bearish trend may mean that price is gearing up for a potential break out. If this happens, the USD/JPY could climb to significantly higher levels, especially given the fundamental backdrop of growing divergence between monetary policies of the US and Japan. We remain cautiously bullish in the medium term until proven wrong. But a monthly closing break below the 12-month moving average and psychological support at 120.00 would be a short-term bearish development, which could lead to further near term losses. On the upside, a decisive break above the 2007 high of 124.10 would be a significantly bullish development.
One final point about the first week of 2016: there will be plenty of economic data, including the FOMC’s meeting minutes and the US monthly jobs report, to look forward to. So expect some fireworks then in case we don’t get some today. We wish you a Happy New Year!
StoneX Financial Ltd (trading as “City Index”) is an execution-only service provider. This material, whether or not it states any opinions, is for general information purposes only and it does not take into account your personal circumstances or objectives. This material has been prepared using the thoughts and opinions of the author and these may change. However, City Index does not plan to provide further updates to any material once published and it is not under any obligation to keep this material up to date. This material is short term in nature and may only relate to facts and circumstances existing at a specific time or day. Nothing in this material is (or should be considered to be) financial, investment, legal, tax or other advice and no reliance should be placed on it.
No opinion given in this material constitutes a recommendation by City Index or the author that any particular investment, security, transaction or investment strategy is suitable for any specific person. The material has not been prepared in accordance with legal requirements designed to promote the independence of investment research. Although City Index is not specifically prevented from dealing before providing this material, City Index does not seek to take advantage of the material prior to its dissemination. This material is not intended for distribution to, or use by, any person in any country or jurisdiction where such distribution or use would be contrary to local law or regulation.
For further details see our full non-independent research disclaimer and quarterly summary.
CFDs are complex instruments and come with a high risk of losing money rapidly due to leverage. 69% of retail investor accounts lose money when trading CFDs with this provider. You should consider whether you understand how CFDs work and whether you can afford to take the high risk of losing your money. CFD and Forex Trading are leveraged products and your capital is at risk. They may not be suitable for everyone. Please ensure you fully understand the risks involved by reading our full risk warning.
City Index is a trading name of StoneX Financial Ltd. Head and Registered Office: 1st Floor, Moor House, 120 London Wall, London, EC2Y 5ET. StoneX Financial Ltd is a company registered in England and Wales, number: 05616586. Authorised and regulated by the Financial Conduct Authority. FCA Register Number: 446717.
City Index is a trademark of StoneX Financial Ltd.
The information on this website is not targeted at the general public of any particular country. It is not intended for distribution to residents in any country where such distribution or use would contravene any local law or regulatory requirement.
© City Index 2024